Bubble Formation on a Single Orifice in a Gas Solid Fluidized Bed
Using Digital Image Analysis
A. Dehghan Lotfabad, S. Movahedirad, M. T. Sadeghi
School of Chemical Engineering, Iran University of Science and Technology (IUST), P.O. Box 16765-163, Tehran, Iran
Received: August 2015 Accepted: October 2015
Abstract
Digital Image Analysis (DIA) has been employed to characterize the time evolution of a bubble injected from a single orifice into a pseudo 2-dimensional gas-solid fluidized bed. The injected bubble diameter increased with the square root of time before detachment. During bubble free flight in the bed, its diameter remains approximately constant. The center of mass of the bubble increases with the second power of the time. The results show that the classical models for bubble injection can predict the time evolution of bubble diameter, and its center of mass. Bubble tends to elongate during injection and after detachment its height to width aspect ratio decreases. Image analyzing results were also used for the study of gas leakage from the bubble to emulsion phase, and it has been shown that the dense phase expands up to 1.04 times the minimum fluidization condition for large bubbles. The expansion ratio of the dense phase increases linearly with bubble diameter.
Keywords: Fluidized Bed, Bubble Formation, Digital Image Analysis
1. Introduction
Bubbles play a key role in many chemical [1,2] and physical [3] processes in gas solid fluidized beds. There are many published research papers in two main branches of experimental [4,5] and theoretical [6-9] works about gas solid bubbly fluidized beds. Bubbles the particle-free regions of the fluidized beds– form on the gas distributor detach from it and then fly through the bed. At the top surface of the bed bubbles erupt the bed surface toward the bed freeboard.
The bubble size and frequency of the bubble formation deeply affect the bubble size distribution in gas solid fluidized beds [4].
In the simulation space, discrete bubble modeling (DBM) approach is a recently developed method and suitable for large-scale gas solid fluidized bed simulation [9-12]. In the first DBM works that were developed for gas solid fluidized beds [9-12] the initial bubble diameter and its position have been fed to the model as input parameters. Actually, the initial bubble diameter and its position were dictated to the model as a pre-known parameter. Experimental evidence on the bubble formation shows that it is a more realistic approach to inject new bubbles in a gradual process [13,14]. Smaller bubbles formed at the distributor lead to tinier bubbles in a freely bubbling fluidized bed. So, it is important to know more about the bubble formation process in the bed.
In this regard, some experimental and modeling investigations on the formation of bubbles at the gas distributor in fluidized beds are published on both 2-D and 3-D spaces. In numerical studies, both Eulerian-Eulerian [15,16] and Eulerian-Eulerian-Lagrangian,
[8,17] approaches have been used to study the bubble formation on a single orifice in fluidized beds. In experimental works Nieuwland et al. [13] studied experimentally, the effect of particle properties on the bubble formation at a single orifice in a 2D bed and a semi-circular bed and compared results of a semi-circular bed with a 2D axisymmetric simulation.
Harrison and Leung [18] proposed a model for the bubble formation on a single orifice with the assumption of no gas exchange from the bubble to the surrounding emulsion phase. Yang et al. [19] and Zenz [20] had found that the gas leaks from a bubble to the emulsion phase with a velocity equal to the minimum fluidization velocity. In another model, applying the Darcy’s law for gas leakage from bubble to dense phase, Caram and Hsu [21] obtained a formula for gas leakage velocity at the bubble surface. Their model has good agreement with experimental data.
systems contains larger particles that are more pronounced than the leakage from bubbles formed in small particle systems. In the present study glass beads that belong to the Geldart D-type classification [27] have been studied.
2. Experimental
2-1. Experimental set-up and equipment The experimental apparatus is schematically illustrated in Fig. 1. The
two-dimensional fluidized bed was made of glass, 0.3 m (length)×0.018 m (thickness)×0.80m (height). Air premixed with steam was injected into the bed passing from a porous distributor equipped with a nozzle at the center to generate different sizes of single bubbles in the presence of background gas maintained at the minimum fluidization velocity (umf).
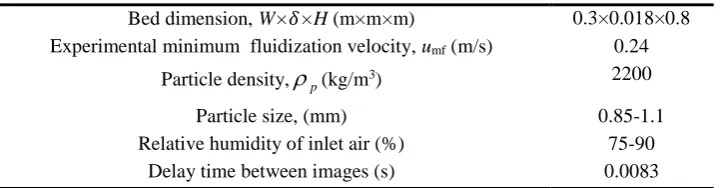
Table 1
Experimental conditions and camera settings.
Bed dimension, W×𝛿×H (m×m×m) 0.3×0.018×0.8 Experimental minimum fluidization velocity, umf (m/s) 0.24
Particle density,p(kg/m3) 2200
Particle size, (mm) 0.85-1.1 Relative humidity of inlet air (%) 75-90
Delay time between images (s) 0.0083
For capturing images from the bed, a forward illumination technique was used following the works done by Movahedirad [4,5] with the aid of two halogen lamps. A black curtain was hung behind the bed to distinguish between bubbles and emulsion
phases. A high speed camera (maximum frame rate of 1200 fps) was used to capture images of the bed. Details of the experiments are summarized in Table 1.
2-2. Materials
Spherical glass beads (Pana Glass Beads Co., Iran) in the range of 850-1100 micrometers were filled in the bed. The particles belong to the D-type based on Geldart classification. The compressed air was supplied from the air net of the lab.
2-3. Digital image analysis
According to Movahedirad et al. [4,5] Digital Image Analysis (DIA) technique was used to
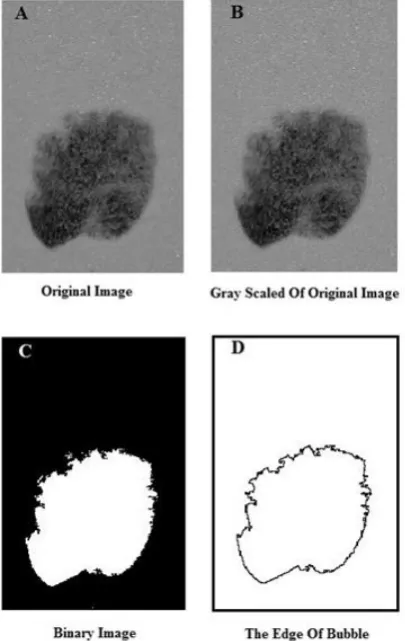
obtain general features of bubble such as bubble equivalent diameter, bubble aspect ratio and its center of mass. The captured image (Fig. 2A) was first converted to the grayscale (Fig. 2B) and then changed to binary (Fig. 2C) (black and white) image. Then the bubble edge was detected (Fig. 2D), and the bubble area was calculated using the number of pixels enveloped inside the detected edge, and the scaling factor based on the bed width.
Figure 2. A) main image, B) Grayscale image, C) binary image and D) the detected edge of the bubble.
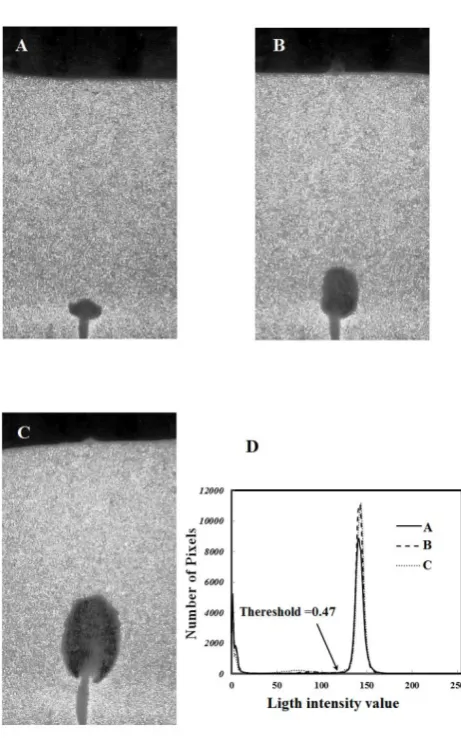
Fig. 3D shows the light intensity histograms of the images for three different sizes of bubbles (Figs A-C). As can be seen, there are two peaks in the histograms. The positions of these peaks are approximately the same for three images. The first peak corresponds to the
Figure 3. A-C three images with different sizes of bubbles and D) the light intensity histograms.
3. Results and discussion
In this section the evolution of size, center of mass and shape of the bubbles during the gas injection have been discussed. Moreover, the assumption of gas leakage for injected bubbles have been studied and argued.
3-1. Change in bubble diameter and center of mass
According to Harrison and Leong [18], Zenz [20] and Caram and Hsu [21] mass and momentum conservation of a bubble during formation are given by:
𝑑𝑉
𝑑𝑡 = 𝑄 − 𝑈𝑒𝑥𝐴 (1)
𝑑 (𝜌𝑒𝑉𝐶𝑣𝑚𝑑𝑠𝑑𝑡)
𝑑𝑡 = 𝜌𝑒𝑉|𝑔| (2)
Where V and A are the bubble volume and boundary area respectively; Q is the gas injection rate from orifice, and 𝑈𝑒𝑥 is the gas exchange velocity between bubble and dense phase.
𝑑𝑏= √
4𝑄 𝜋 𝑡
(3)
𝑠 =|𝑔|𝑡
2
4𝐶𝑣𝑚
(4)
Where Cvm is the virtual mass coefficient
of bubble. As can be seen from equations (3)
and (4) bubble diameter and its center of
mass grow with √𝑡 and 𝑡2 respectively.
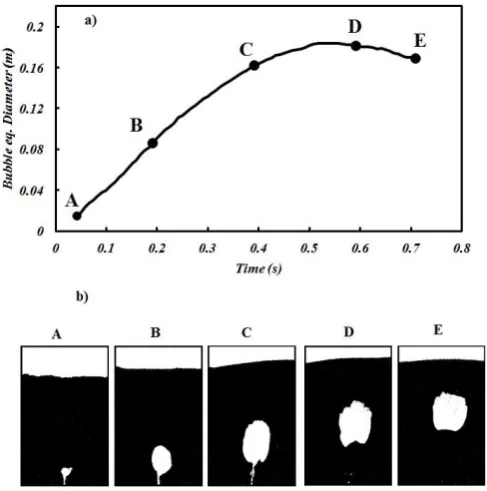
As can be seen in Figs. 4a and 4b for a typical bubble the bubble size increases to a maximum value and then remains approximately constant when it rises through the bed.
Figure 4. a) The bubble size evolution during injection and b) the corresponding images of the bubble.
The bubble growth through the time at initial states of injection (before detachment) is recorded, and the data of about 120 bubbles is fitted with a power law function.
Figure 5. The average value for power law fitting parameter “b” of bubble diameter versus time.
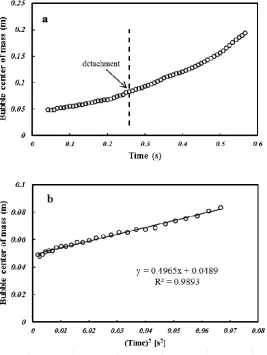
Fig. 6a shows the variation of a typical
bubble center of mass from an injection start
until bubble eruption at the bed surface. In Fig. 6b, the bubble’s center of mass before
detachment plotted versus t2. As can be seen
from this figure this data was also well fitted
with the t2 (R-squared value of 𝑅2 ≈ 0.99).
This shows that the simple model presented
by Harrison and Leong can predict the change
of the bubble’s center of mass fairly.
3-2. Changes in bubble shape
To characterize bubble shape, the bubble’s
aspect ratio is defined according to Kuipers et al. [15] as the ratio of bubble’s length in
vertical direction to its width in horizontal
direction. (see Fig. 7a). For this purpose, an
ellipse has been fitted around the bubble, and
the bubble aspect ratio has been defined
according to Fig. 7a.
Figure 7. a) The aspect ratio of a bubble and b) the time evolution of bubble’s aspect ratio during injection process.
Fig. 7b shows the variations of the aspect ratio of a typical bubble during the injection process. As can be seen from this figure, bubbles stretch vertically until a maximum value is reached and then the aspect ratio decreases monotonically.
The maximum bubble aspect ratios were determined for more than 100 bubbles and the results have been plotted in Fig. 8. As can be seen from this figure the average value of
Figure 8. The maximum bubble’s aspect ratio for more than 100 bubbles versus bubble diameter.
3-3. Gas leakage from bubble to emulsion phase
There are two main theoretical models about bubble formation at a single orifice in a gas solid fluidized bed. The first is based on the work done by Harrison and Leoung [18] who assumed no leakage from bubble boundaries into the emulsion phase. On the other hand, Caram and Hsu [21] assumed the gas leakage from bubble to dense phase in their model. Recently, Verma et al. [15] compared their TFM simulation results with these two models and showed that the simulation results are closer to the second model.
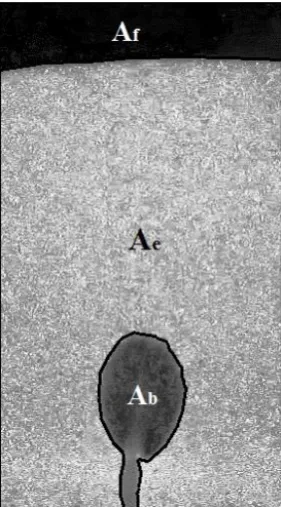
Figure 9. Representation of the bubble, emulsion and freeboard regions in a typical image.
In the present work to study the gas leakage from bubble to emulsion phase, the emulsion phase expansion after bubble injection is characterized using image processing technique. According to Fig. 9, the total bed area captured in the image is:
Where Abed, Ae, Ab and Af are the areas of
bed, emulsion phase, bubble and freeboard respectively.
A dense phase expansion coefficient (α) could be defined as the ratio of emulsion phase volume with presence of the bubble to the emulsion phase volume at minimum fluidization condition:
𝛼 = 𝐴𝑒
𝐴𝑚𝑓
(6)
This parameter shows the relative amount of the gas leaked from bubble into the dense phase in excess of minimum fluidization condition. A mass balance on the particulate phase is as follows:
(1 − 𝜀𝑚𝑓)𝐴𝑚𝑓= (1 − 𝜀𝑒)𝐴𝑒 (7)
Leads to the following equation in terms of 𝛼 and 𝜀𝑚𝑓:
𝜀𝑒
𝜀𝑚𝑓
= 1
𝜀𝑚𝑓
−1
𝛼
(1 − 𝜀𝑚𝑓)
𝜀𝑚𝑓
(8)
The 𝜀𝑒
𝜀𝑚𝑓 parameter was calculated for
different bubble sizes according to the procedure described in this section and plotted against equivalent bubble diameter. Fig. 10 shows the linear proportionality of
the 𝜀𝑒
𝜀𝑚𝑓 with the bubble diameter. In pseudo
2-D fluidized bed, bubble boundary is the multiplication of the bed thickness (𝛿) by bubble perimeter (𝜋𝑑𝑏). This corresponds
with the fact that the gas leakage from large bubbles is greater than the gas leakage from smaller ones due to the larger interfacial area of bubbles with dense phase.
Figure 10. 𝜀𝑒
𝜀𝑚𝑓 versus bubble equivalent diameter.
4. Conclusions
Digital Image Analysis (DIA) technique is used to study the bubble injection process from a single orifice on the gas distributor of a pseudo 2-D gas solid fluidized bed. Bubble size and center of mass, its shape and the gas leakage from the bubble to dense phase during the injection process have been studied and
compared with two basic models of Harrison and Leong [19] and Caram and Hsu [21].
The following results have been obtained:
The center of mass of the bubble increases with the second power of the time, which corresponds with the mentioned theoretical models.
Bubble’s aspect ratio (height/width) increases to a maximum value until the detachment time and then decreases during the bubble rise in the bed.
The image-processing results show that the bubble to dense phase gas leakage increased linearly with the bubble diameter which is in agreement with the assumption that the leakage increased with the bubble to emulsion phase boundary surface.
Nomenclatures
A [m2] bubble boundary area
b
A [m2] bubble area captured in each image
bed
A [m2] bed area captured in each image
e
A [m2] emulsion phase area captured in each image
f
A [m2] freeboard area captured in each image
mf
A [m2] emulsion phase area in minimum fluidization condition
vm
C [-] virtual mass coefficient
b
d [m] bubble diameter
|𝑔| [m/s2] the magnitude of gravity acceleration
H [m] height of fluidized bed
Q [m2/s1] gas flow rate injected from orifice
s [m] center of mass of the bubble
T [s] time
ex
u [m/s] the velocity of gas exchange from bubble to emulsion phase
mf
u [m/s] minimum fluidization velocity
V [m3] bubble volume
W [m] bed width
Greek letters
𝛼 [-] dense phase expansion coefficient
𝜀𝑒 [-] void fraction in emulsion phase
𝜀𝑚𝑓 [-] void fraction at minimum fluidization condition
e
[kg/m3] emulsion phase bulk density, kg/m3
p
[kg/m3] Particle’s density, kg/m3
References
1. Dehnavi, M. A. Shahhosseini, S. Hashemabadi, S. H. and Ghafelebashi, S. M., "CFD based evaluation of polymer
[2] Marschall, K. J. R and Mleczko, L., "Experimental Investigations of Catalytic Partial Oxidation of Methane to Synthesis Gas in Various Types of Fluidized-Bed Reactors", Chem. Eng. Technol., 23 (1), 31 (2000).
[3] Dosta, M. Antonyuk, S. and Heinrich,S., "Multiscale Simulation of the Fluidized Bed Granulation Process", Chem. Eng. Technol., 35 (8), 1373 (2012).
[4] Movahedirad, S. Molaei Dehkordi, A. Banaei, M. Deen, N. G. van Sint Annaland M. and Kuipers, J. A. M., "Bubble Size Distribution in Two-Dimensional Gas–Solid Fluidized Beds", Ind. Eng. Chem. Res., 51 (18), 6571 (2012).
[5] Movahedirad, S. Molaei Dehkordi, A. Abbaszade Molaei, E. Haghi, M. Banaei, M. and Kuipers, J. A. M., "Bubble Splitting in a Pseudo2D Gas - Solid Fluidized Bed for Geldart B-Type Particles", Chem. Eng. Technol., 37 (12), 2096 (2014).
[6] Kuipers, J. A. M. Prins, W. and Van Swaaij, W. P. M., "Theoretical and experimental bubble formation at a single orifice in a two-dimensional gas-fluidized bed", Chem. Eng. Sci., 46 (11), 2881 (1991).
[7] Sun, L. Zhao, F. Zhang, Q. Li, D. and Lu, H., "Numerical Simulation of Particle Segregation in Vibration Fluidized Beds", Chem. Eng. Technol., 37 (12), 2109 (2014).
[8] Olaofe, O. O. van der Hoef, M. A. and Kuipers, J. A. M., "Bubble formation at a
single orifice in a 2D gas-fluidized bed", Chem. Eng. Sci., 66 (12), 2764 (2011).
[9] Movahedirad, S. Dehkordi, A. M. Deen, N. G. van Sint Annaland, M. and Kuipers, J. A. M. H., "Novel phenomenological discrete bubble model of freely bubbling dense gas–solid fluidized beds: Application to two‐ dimensional beds", AIChE J., 58 (11), 3306 (2012).
[10] Movahedirad, S. Ghafari, M. Dehkordi, A. M., "Discrete Bubble Model for Prediction of Bubble Behavior in 3D Fluidized Beds", Chem. Eng. Technol., 35 (5), 929 (2012).
[11] Movahedirad, S. Ghafari, M. and Dehkordi, A. M., "A Novel Model for Predicting the Dense Phase Behavior of 3D Gas‐Solid Fluidized Beds", Chem. Eng. Technol., 37 (1), 103 (2012).
[12] Bokkers, G. A. Laverman, J. A. van Sint Annaland, M. and Kuipers, J. A. M., "Modelling of large-scale dense gas– solid bubbling fluidised beds using a novel discrete bubble model", Chem Eng Sci., 61 (17), 5590 (2006).
[13] Nieuwland, J. J., "Hydrodynamic modelling of gas-solid two-phase flows" Ph.D. Thesis, Twente University, Enschede, The Netherlands. (1995).
[14] Nieuwland, J. J. Veenendaal, M. L. Kuipers, J. A. M. and van Swaaij, W. P. M., "Bubble formation at a single orifice in gas-fluidised beds", Chem. Eng. Sci., 51 (17) , 4087 (1996).
formation at a central orifice in a gas– solid fluidized bed predicted by three-dimensional two-fluid model simulations", Chem. Eng. J., 245, 217 (2014).
[16] Huttenhuis, P. J. G. Kuipers, J. A. M. and van Swaaij, W. P. M., "The effect of gas-phase density on bubble formation at a single orifice in a two-dimensional gas-fluidized bed", Chem. Eng. Sci., 51 (24) ,5273 (1996).
[17] Rong, L, Zhan, J. and Wu, C., "Effect of various parameters on bubble formation due to a single jet pulse in two-dimensional coarse-particle fluidized beds", Adv. Powder Technol., 23 (3), 398 (2012).
[18] Harrison, D. and Leung, L. S., "Bubble formation at an orifice in a fluidized bed", Chem. Eng. Res. Des., 39 ,409 (1961).
[19] Yang, W. C. Revay, D. Anderson, R. G. Chelen, E. J. Keairns, D. L. and Cicero, D. C., "Fluidization Phenomena in a large-scale, cold-flow model", in: Kunii, D., Toei R., (Eds.), Fluidization IV, Engineering Foundation, New York, p. 77 (1984).
[20] Zenz, F. A., "Bubble Formation and Grid Design", Inst. Chem. Eng. Symp. Ser., 136, 136 (1968).
[21] Caram, H. S. and Hsu, K. K., "Bubble formation and gas leakage in fluidized beds", Chem. Eng. Sci., 41 (6), 1445 (1986).
[22] Busciglio, A. Vella, G. Micale, G. and Rizzuti, L., "Experimental analysis of bubble size distributions in 2D gas
fluidized beds", Chem. Eng. Sci., 65 (16), 4782 (2010).
[23] Busciglio, A. Grisafi, F. Scargiali, F. and Brucato, A., "On the measurement of bubble size distribution in gas–liquid contactors via light sheet and image analysis", Chem. Eng. Sci., 65 (8), 2558 (2010).
[24] Asegehegn, T. W. Schreiber, M. and Krautz, H. J., "Investigation of bubble behavior in fluidized beds with and without immersed horizontal tubes using a digital image analysis technique", Powder Technology., 210 (3), 248 (2011).
[25] Caicedo, G. R. Marqués, J. P. Ruı́z, M. G. and Soler, J. G., "A study on the behaviour of bubbles of a 2D gas–solid fluidized bed using digital image analysis", Chem. Eng.Process.: Process Intensification, 42 (1), 9 (2003).
[26] Bokkers, G. A. van Sint Annaland, M. and Kuipers, J. A. M., "Mixing and segregation in a bidisperse gas–solid fluidised bed: a numerical and experimental study", Powder Technol., 140 (3), 176 (2004).
[27] Geldart, D., "Types of gas fluidization”, Powder Technol., 7 (5), 285 (1973).