Effect of different oxygen levels on growth performance, stress
response and oxygen consumption in two weight groups of great
sturgeon
Huso huso
Bagherzadeh Lakani, F. ; Sattari, M.
*; Falahatkar, B.
Received: April 2012 Accepted: June 2012
Abstract
In the present study, different oxygen levels were examined in two weight groups of great sturgeon Huso huso including small size (with initial weight 280.9 ± 49.2 g) and large size (with initial weight 1217.9 ± 138.1 g). The fish were kept in hypoxia (2-3 mg/l), normoxia (5-6 mg/l) and hyperoxia (9-10 mg/l) conditions for 8 weeks and then were individually placed in the tanks with oxygen level of 6 mg/l to levels causing sedate fish and subsequently dissolved oxygen level in water was measured every 30 minutes. No significant effects on blood cortisol and glucose levels were observed after 8 weeks (P>0.05), but there were significant differences in cortisol concentrations between treatments (P<0.05) after stress. Significant differences were found in cortisol and glucose levels in pre and post stress conditions in small size, but no significant differences were observed (P>0.05) in large size. There were no significant differences in oxygen consumption among treatments (P>0.05). Results revealed that dissolved oxygen had a significant effect on growth of H. huso and also a low level of oxygen accompanied by reduction in feed intake resulted in lower growth and changes in stress response.
Keywords: Huso huso, Growth performance, Hypoxia, Hyperoxia, Oxygen consumption
_________________________________________
Fisheries Department, Faculty of Natural Resources, University of Guilan, Sowmeh Sara, 1144, Guilan, Iran. *Corresponding author's email: [email protected]
Introduction
The dissolved oxygen (DO) level plays a key role in water quality in aquaculture (Timmons et al., 2001; Valverde et al., 2006) and adequate concentrations of oxygen in water are vital to intensive fish farming (Ritola et al., 2002). The measurement of oxygen consumption is an indirect way to estimate metabolism in fish (Pichavant et al., 2001). DO, besides feed and temperature, is the most important factor controlling growth, and a constant DO content below a critical level is considered to decrease feed consumption, growth and feed conversion efficiency (Jobling, 1994). Critical range of oxygen for acceptable growth is about 5 mg/l (Brett, 1979) and for feed intake is about 50-70% saturation (Jobling, 1995). Boyd (1982) demonstrated that DO concentration between 3-5 mg/lis harmful for fish growth.
In intensive aquaculture of many species, it is now common to oxygenate the water to increase biomass and production (Olsvik et al., 2006). Exposure to both hyperoxia and hypoxia may damage to aquatic organisms, resulting in suboptimal growth and hence lower biomass production (Wedemeyer, 1997), but long-term effects of exposure to hyperoxia are less known (Olsvik et al., 2006).
Stress is a situation in which the organism's homeostasis is threatened by endogenous or exogenous stimuli, whereas the stress response is the adaptive strategy enabling individuals to cope with the situation (Chrousos and Gold, 1992). Handling, transport, confinement, social hierarchies, agonistic behavior, poor water
quality (e.g. hypoxia) and xenobiotics are conditions causing stress responses in aquaculture (Barton and Iwama, 1991; Davis, 2006). Studies on various fish species and different types of stressors have led to the conclusion that behavioral and physiological responses to stressors are vary between species and type of stressor (Barton and Iwama, 1991; Iwama et al., 2006).
The primary indicator of stress response is the increase of serum cortisol level (Cataldi et al., 1998) and it is most commonly measured indicator of stress that usually provides a good reflection of the severity and duration of the stress response (Barton and Iwama, 1991; Wendelaar Bonga, 1997; Fevolden et al., 2002).
The sturgeons are the members of chondrosteans that most species are worldwide endangered because of overfishing , pollution and habitat degradation (Birstein, 1993; Billard and Lecointre, 2001). Thus there has been an increased demand for information on all aspect of sturgeon biology and physiology (Billard and Lecointre, 2001; Baker et al., 2005) find the knowledge in aquaculture or stocks rehabilitation of these species.
Great sturgeon or beluga (Huso huso) is the largest sturgeon and it is suitable for aquaculture because of fast growth, reproduction in captivity, and tolerance of unfavorable rearing conditions (Vlasenko, 1994; Falahatkar et al., 2009), reared as fingerlings in some Iranian government hatcheries for stocks enhancement, but are also selected for culture in confined systems for commercial purposes (Falahatkar et al.,
___________________________________________________________________________ 2009). Stressors such as grading, handling,
crowding and poor water quality can have deleterious effects on growth and welfare of H. huso (Falahatkar et al., 2009). Results of Falahatkar and Barton (2007); Rafatnezhad et al. (2008) andFalahatkar et al.(2009)suggest that H. huso is relatively resistant to handling disturbances during aquaculture practices, but are nevertheless responsive to stress factors. Despite the economic importance of H. huso there is little information about the oxygen requirements of this species, thus the objective of this study was conducted to determine the biochemical factors in blood including serum cortisol (as primary response) and glucose (as secondary response) levels, growth performance and oxygen consumption in two weight group of H. huso that reared in water with three different saturation levels of DO ; hypoxia, normoxia, and hyperoxia then exposed to low oxygen stress.
Materials and methods
Fish
Twenty seven fish with mean initial body weight of 1217.9 ± 138.1 g (as large size)
and 54 fish with mean initial body weight of 280.9 ± 49.2 g (as small size) were provided form International Sturgeon Research Institute (Rasht, north of Iran).
Experimental design
The fish were held in 18 fiberglass tanks (1 m diameter with water depth 30 cm, 0.8 m2 surface area and 500 L volume) at a water temperature of 18 ± 0.7 ºC, NO2
0.02 ± 0.01 mg/l, Fe 0.025 ± 0.001 ppm, NH4 0.00 and pH= 6.4 under controlled
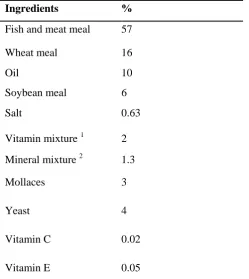
photoperiod (18L:6D) during the experimental period. Fish were acclimated to experimental tank for one week then randomly distributed in 9 tanks for each weight group (3 fish per tank in large size (3653.7 ± 322.1 g) and 6 fish per tank for small size (1685.3 ± 55.3 g). Food was offered three times (8:00, 16:00, 24:00) daily with a dry diet made at International Sturgeon Research Institute for this species (44.8 % crude protein; 18.9 % crude fat; 10.28 % ash; 1.17 % fibre)(Table 1). Food was supplied as 1–2 % body weight daily, according to water temperature during the experimental period.
Table 1-Ingredients of the experimental diet
1 - Science laboratory: vit A , 1400000 IU; vit D3 , 400000 IU; vit E, 40; K3, 2; B1, 6; B2,
8; B3, 12; B5, 40; B6, 4; B9, 2; B12, 0.008; H2 0.24; O, 60; Inositol, 20;
B.H.T, 20; Carrier up to 1 kg.
2- Science laboratory: Fe 26; Zn,12.5; Se, 2; Co, 0.48 ; Cu, 4.2 ; Mn, 15.8 ; I, 1 ; Choline Chloride , 12 ; Career up to 1 kg.
Dissolved oxygen was measured by an oxymeter (OXi323-B/SET) 6 times a day (8, 11, 13, 16, 20, 24). Oxygen treatments including hypoxia (2-3 mg/l), normoxia (5-6 mg/l) and hyperoxia (9-10 mg/l) (Brett, 1979; Boyd, 1982; Jobling, 1995; Buentello et al., 2000; Crampton et al., 2003) were set up with managing inflowing water and using system equipped with oxygen enriching for hyper oxygenation (pure oxygen injected). Hypoxic conditions were obtained by reducing the water inflow (without reducing water volume in the tank) and reducing aeration in the tanks. Oxygen content gradually decreased to 2-3 mg/l. The inflowing water in all treatments was
the same as that of hypoxia. In normoxia treatment the oxygen saturation set up with aeration system. Fish were kept in this situation for 8 weeks.
Sampling and analysis
Biometric measurements of fish were carried out every 2 weeks. To obtain blood samples, 1 fish per tank from large size and 2 fish from small size were taken. After initially sampling of all 27 fish (9 fish in large size and 18 in lower weight), aeration and water flow were stopped. After sedation, blood samples were taken again from the same 27 fish. Approximately, 2 ml of blood were taken from the caudal vein of each fish using a 5
% Ingredients
57 Fish and meat meal
16 Wheat meal
10 Oil
6 Soybean meal
0.63 Salt
2 Vitamin mixture 1
1.3 Mineral mixture 2
3 Mollaces
4 Yeast
0.02 Vitamin C
0.05 Vitamin E
___________________________________________________________________________ ml syringe (Hrubec and Smith, 2000). Test
tubes containing blood were centrifuged for 10 min at 3000 g. Serum was stored at −20°
C for measuring cortisol and glucose levels. Serum cortisol was measured by radioimmunoassay (Redding et al., 1984), and glucose was measured using glucose oxidase methods (Bayunova et al., 2002). Oxygen consumption was measured according to the following formula
(Valverde et al., 2006):
MO2 =
where MO2 is the individual oxygen
consumption expressed as mg O2/kg/h;
[O2] t1− [O2] t2 is the difference in oxygen
concentrations (mg O2/l) over
measurement time; V is the volume of the tank in liter; B is fish biomass in kg , and t is time (h ) during which oxygen consumption was measured. The tanks filled with water and covered with a plastic sheet to prevent diffusing atmospheric oxygen and then the groups were placed in different tanks according to their size (30 l for small size and 90 l for larger one). Fish were placed individually in the tanks and
from oxygen saturation 6 mg/l to the fish sedation, every 30 min O2 concentration in
water was measured using an oxygen-meter.
Statistical analysis
At first, Kolmogorov-Smirnov test was applied to check the data normality. Data
collected from the experiment were subjected to One-Way analysis of variance (ANOVA) test using SPSS 13.0 (Chicago, IL). When a significant difference was found, the differences between treatment means were determined by Tukey’s tests as a post-hoc test. Effects of fish weight as a covariate on glucose and cortisol determined by ANCOVA analysis and there were no significant difference then student’s t-test were done to determine differences between pre-stress and post-stress group means. Differences were considered statistically significant when P
< 0.05. Data are expressed as mean ± SE for each treatment.
Results
No mortality was observed over the eight weeks of the experimental period. Oxygen levels influenced growth parameters of H. huso. Mean weight of the fish were unaffected by oxygen treatments for the first 4 weeks in small size and for the first 2 weeks in large size, but after that until the end of the study, fish showed significant differences in mean weight (P
= 0.005, Fig. 1). In small size, oxygen treatments showed significant differences in fork length (P = 0.019, Table 2). There were significant differences in feed intake between treatments in both groups (P = 0.019, Table 2).
([O2] t1-[O2] t2) ×V (B×V)
Figure.1: Mean weight of H. huso during 8 weeks rearing under different oxygen levels.A:
small size. B: large size. Significant difference were shown by different letter (a, ab, b) as determined by ANOVA and Tukey’s test at P ≤ 0.05. All values are mean ± SE.
___________________________________________________________________________
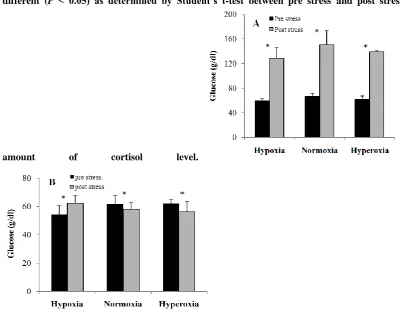
The effects of hypoxia, normoxia and hyperoxia showed no significant effect on cortisol and glucose levels after eight weeks in large size (P = 0.926 and 0.531, respectively) and small size (P = 0.308 for cortisol and P = 0.433 for glucose), but after stress there were significant differences in cortisol concentrations between treatments in small size (P = 0.001) and large size (P = 0.012). There were no significant differences in glucose levels between treatments in small size (P
= 0.655) and large size (P = 0.776). Significant differences between cortisol values before and after stress in small and large size (P = 0.006 and 0.001) and glucose levels in small size were found
(P = 0.002) but in large size, no significant differences in amount of glucose were observed (P = 0.874; Figs. 2, 3).
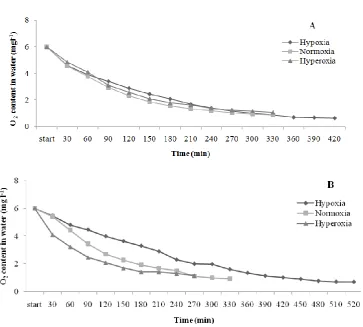
There were no significant differences between oxygen consumption in treatments in large size (P = 0.889) and small size (P = 0.864; Fig. 4). The lowest amount of oxygen that fish could stand at normoxia and hyperoxia treatments was 0.88 mg/l in small size and 0.94 for normoxia and 1.07 for hyperoxia in large size. The O2 content that fish in hypoxia
treatment could resist in large size was 0.71 mg/l but in small size fish could stand even until the amounts of O2 in water was
0.57 mg/l.
Figure 2: Serum cortisol levels (mean ± SE) pre and post oxygen deprivation stress of H. huso that reared at different oxygen levels for 8 weeks. A: small size (n=18). B: large size (n=9). Significant
___________________________________________________________________________ differences among different treatments were shown by a different superscript in the columns (a, b) at P ≤ 0.05 as determined by One Way ANOVA and Tukey’s test. (*) shows significantly
different (P < 0.05) as determined by Student’s t-test between pre stress and post stress
amount of cortisol level.
Figure 3: Serum glucose levels (mean ± SE) pre and post oxygen deprivation stress of H. huso
that reared at different oxygen levels for 8 weeks. A: small size (n=18). B: large size (n=9). * shows significantly different (P < 0.05) as determined by student’s t-test between pre stress and post stress.
Figure 4: Oxygen consumption in comparison to body weight (MO2)
during 2 h in two weight groups of H. huso reared under different oxygen levels for 8 weeks. Values are mean ± SE.
Figure 5: Oxygen consumption (mg/l) of H. huso reared at different oxygen levels for 8 weeks. A: small size. B: large size.
Discussion
Growth
At the end of the experiment, in large size the mean body weight of fish reared at hyperoxia treatment was significantly higher than in the group maintained at hypoxia and normoxia treatment. Similarly, the growth of halibut (Hippoglossus hippoglossus L.) progressively increased when the oxygen saturation increased from 57 to 100% (Thorarensen et al., 2010). There is some evidence that moderate hyperoxia may improve the growth of fish (Foss et al., 2003; Dabrowski et al., 2004; Hosfeld et al., 2008) while Person-Le Ruyet et al. (2002) reported that after exposure to O2-supersaturation for 30 days
juvenile turbot (Scophthalmus maximus)
showed no significant differences in feed intake and growth. In the other study, Ritola et al. (2002) stated that none of episodic hyperoxia treatment or continuous hyperoxia caused mortality or result in better growth in rainbow trout (Oncorhynchus mykiss). The results of the present study concur with those of several other studies, which indicate that oxygen saturation close to 100% or even higher required to support the maximum growth (Buentello et al., 2000; Crampton et al., 2003). In the present study growth of the fish reared at hypoxia treatment was significantly lower than normoxia and hyperoxia in small size. Tran-Duy et al. (2008) stated reduced feed intake and growth of Nile tilapia (Oreochromis
___________________________________________________________________________
niloticus) with an average weight of 37 and 190 g at DO concentrations of about 2.8 mg/l and 3.2 mg/l. Feed intake and satiation in fish are regulated by physiological, social or environmental factors, or by the interaction among them (Tran-Duy et al., 2008). Rafatnezhad and Falahatkar (2011) mentioned that the most important factors responsible for the differences in growth are primarily oxygen concentration. So, decrease in oxygen content could regulate the growth of H. huso juveniles. The results from present study clearly showed reduced feed intake and growth of H. huso at hypoxic condition. Fish stop eating when oxygen supply does not satisfy oxygen demand (Pauly, 1981). Decreased feed utilization might be an indicator of the higher levels of stress (Rafatnezhad and Falahatkar, 2011) and it could be an indirect mechanism by which prolonged hypoxia reduces growth and may be a way to reduce energy and thus oxygen demand (Pichavant et al., 2001).
Oxygen consumption
In the present study there were no significant differences between oxygen consumption in treatments in large size and small size. Considering that the time course and severity of hypoxia greatly influence the degree of physiological responses of fish (Boutilier et al., 1988). Randall (1982) described that fish respond to a decrease in the levels of dissolved oxygen by increasing both ventilatory frequency and ventilation volume rate. The cost for ventilation has been estimated at the level of 3–10% of the resting oxygen consumption at normoxia (Farrell and Steffensen, 1987; Rantin et al., 1992), but it
may increase to 50% at hypoxia (Hughes and Saunders, 1970). So, any increase in ventilation will reduce the energy available for other metabolic processes such as growth (Jones, 1971). During hypoxia, increased pumping will induce a rise in oxygen demand (Berschick et al., 1987). With declining oxygen tensions a point is reached, the critical oxygen tension, at which the oxygen demand of the respiratory pumps exceeds the extra oxygen supplied by hyperventilation and so oxygen consumption declines (Hughes, 1973). In the present study, there were no significant differences between oxygen consumption in the treatments but in hypoxia, fish could resist at low oxygen concentration more than other treatments. This can be related to changes in respiratory mechanism of fish in hypoxia treatment during 8 weeks of experiment. Oxygen consumption rate varies with fish weight and maximum oxygen uptake capacity relative to body weight in bigger fish is lower than in smaller one, because the gill surface area is allometrically related to body weight (Tran-Duy et al., 2008). Similarly, in the present study fish in large size had smaller oxygen uptake. Foss et al.
(2003) reported that in spotted wolffish (Anarhichas minor) O2 consumption was
significantly higher under hyperoxic compare to normoxic conditions. Thillart and Verbeek (1991) reported excess oxygen consumption in goldfish, Carrasius auratus, after varying durations of hypoxia and anoxia.
Some species of sturgeon exhibit significant reductions in routine metabolic rates when exposed to hypoxia (Ruer et al.,
1987; Crocker and Cech, 1997) but Nonnotte et al. (1993) demonstrated that Siberian sturgeon, Acipenser baeri, exhibited a doubling in the respiration rate after returning to normoxia from a progressive hypoxic exposure over 4.5 h when compared to a normoxic control. They have shown that sturgeon, like most other fish, exhibit typical O2 regulatory
behavior when subjected to gradual and moderate hypoxia.
Stress responses
There was no significant difference in glucose and cortisol levels between the treatments at the end of the experiment. Reasons for the apparent low responses to stressor in H. huso may be related to their evolutionary history associated with the development of their adaptive responses to stressors in their natural environment (Falahakar and Baron, 2007). Barton and Iwama (1991) mentioned that cortisol levels around 10 ng ml−1 is a level generally considered representative of unstressed fish, thus the slow and relatively weak cortisol response to stressors, and low serum glucose levels at the end of experiment may be related to the adaptation of H. huso to experimental treatments after 8 weeks.
After stress, there were no significant differences in glucose levels between the treatments but in small size there was significant difference before and after stress. After stress, there were significant differences in cortisol levels between the treatments in both groups. In small size in hyperoxia average of cortisol concentration significantly elevated but in hypoxia fish showed lower amount of cortisol and average of cortisol
concentration significantly changed. Average of cortisol concentration in fish from normoxia was within the amount of cortisol in hypoxia and hyperoxia treatment. In large size the increase of cortisol after stress was significant. This difference in responses to stress between hypoxia and hyperoxia treatments may be related to sturgeon ability to adapt effectively to low O2-concentrations. This adaptation is
attributable to several changes that may occur during long-term exposure to non-lethal hypoxia; increases in the oxygen- carrying capacity or increase in the tissue glycogen reserves (Jobling, 1994). In large size, higher level of cortisol in hyperoxia treatment may be related to 8 weeks rearing in high level of oxygen saturation in which the fish could not resist at lower amount of oxygen saturation during stress.
There are several reports about response of fish to stressors that are related to hypoxia. For example, high levels of catecholamines were observed by Metcalfe and Butler (1989) in Scyliorhinus canicula
submitted to moderate hypoxia. Lays et al.
(2009) reported that when spotted wolffish were exposed to a gradually decreasing oxygen level in the tank, a significant elevated plasma cortisol level (35 ng ml−1) was seen in the fish that remained in the tank until oxygen saturation had decreased to 20% oxygen saturation after 2.5 h and plasma glucose levels showed only moderate increases (~70%) following disturbance and hypoxia challenges. In other study on turbot after an exposure to moderate hypoxia (45% of O2-saturation) no sign of stress was
noticed (Pichavant et al. 2000). In Sole,
Solea solea, no major change in the physiological status was observed after a
___________________________________________________________________________ hour exposure to a hypoxic challenge of 40%
O2-saturation (Dalla Via et al., 1994; Thillart
et al., 1994). Fridell et al. (2007) reported that after combination of hyperoxygenation and reduced water flow (hyperoxic) the cortisol levels were significantly higher in hyperoxic group compared to controls maintained under normal oxygen saturation and water flow (normoxic) indicating chronic stress. This is supported the result of present study that after stress, the fish placed in hyperoxia and normoxia treatment could not resist at that situation and significantly showed high levels of cortisol in both large and small sizes. In other study, Person-Le Ruyet et al. (2002) demonstrated that after exposure to O2-supersaturation for 30 days,
juvenile turbot showed no sign of stress. In summary, the results of present study revealed that weight groups had no effects on stress indices at the end of experimental period and this is according to previous studies with juvenile H. huso (Falahatkar and Barton, 2007; Rafatnezhad et al., 2008, Falahatkar et al., 2009), thus the findings suggest that this species is relatively resistant to stressors during aquaculture practices and fish did not show high levels of glucose and cortisol at the end of the experiment. This showed that H. huso could adapt to different oxygen conditions. Results of the present study revealed that dissolved oxygen had a significant effect on growth and a low level of oxygen accompanied by reduction in feed intake result in lower growth. More future studies about other related indices and gene expression can be useful.
Acknowledgments
We acknowledge the support from the International Sturgeon Research Institute for
providing the fish and facilities for this experiment.
References
Baker, D. W., Wood, A. M., Litvak, M. K. and Kiffer, J. D., 2005. Hematology of juvenile Acipenser oxyrinchus and
Acipenser brevirostrum at rest and following forced activity. Journal of Fish Biology, 66, 208–221.
Barton, B. A. and Iwama, G. K., 1991. Physiological changes in fish from stress in aquaculture with emphasis on the response and effects of corticosteroids.
Annual Review of Fish Diseases, 1, 3–26. Bayunova, L., Barannikova, I. and Semenkova, T., 2002. Sturgeon stress reactions in aquaculture. Journal of Applied Ichthyology, 18, 397–404.
Berschick, P., Bridges, C. R. and Grieshaber, M. K., 1987. The influence of hyperoxia, hypoxia and temperature on the respiratory physiology of the intertidal rockpool fish Gobius cobitis
Pallas. Journal of Experimental Biology, 130, 369-387.
Billard, R. and Lecointre, G., 2001. Biology and conservation of sturgeon and paddlefish. Reviews in Fish Biology and Fisheries, 10, 355–392.
Birstein, V. J., 1993. Sturgeons and paddlefishes: threatened fishes in need of conservation. Conservation Biology, 7, 773–787.
Boutilier, R. G., Dobson, G., Hoeger, U. and Randall, D. J., 1988. Acute exposure to graded levels of hypoxia in
rainbow trout (Salmo gairdneri): metabolic and respiratory adaptations.
Respiration Physiology, 71, 69–82. Boyd, C.E., 1982. Water quality
management for pond fish culture. Elsevier Scientific Publishing Company, Amsterdam, the Netherlands. 318 p. Brett, J.R., 1979. Environmental factors and
growth. Hoar, W.S., Randall, D.J., Brett, J.R. Eds., Fish Physiology, Vol. VIII. Academic Press, London, pp. 599–675. Buentello, J. A., Gatlin, D. M. and Neill,
W. H., 2000. Effects of water temperature and dissolved oxygen on daily feed consumption, feed utilization and growth of channel catfish (Ictalurus punctatus). Aquaculture, 182, 339–352. Cataldi, E., Di Marco, P., Mandich, A. and
Cataudella, S., 1998. Serum parameters of Adriatic sturgeon Acipenser naccarii
(Pisces: Acipenseriformes): effects of temperature and stress. Comparative Biochemistry and Physiology (A) 121, 351–354.
Chrousos, G.P. and Gold, P.W., 1992. The concepts of stress and stress system disorders. Journal of the American Medical Association, 267, 1244–1252. Crampton, V., Hølland, P.M., Bergheim,
A., Gausen, M. and Næss, A., 2003. Oxygen effects on caged salmon. Fish Farming International, 26–27.
Crocker, C.E. and Cech, J.J., 1997. Effects of environmental hypoxia on oxygen consumption rate and swimming activity
in juvenile white sturgeon, Acipenser transmontanus, in relation to temperature and life intervals. Environmental Biology of Fishes, 50, 383–389.
Dabrowski, K., Lee, K., Guz. L., Verlhac, V. and Gabaudan, J., 2004. Effects of dietary ascorbic acid on oxygen stress (hypoxia or hyperoxia), growth and tissue vitamin concentrations in juvenile rainbow trout (Oncorhynchus mykiss).
Aquaculture, 233, 383–392.
Dalla Via, Thillart, G., Cattani, O. and Cortesi, P., 1998. Behavioral responses and biochemical correlates in Solea solea
to gradual hypoxic exposure. Canadian Journal of Zoology, 76, 2108-2113. Davis, K.B., 2006. Management of
physiological stress in finfish aquaculture. North American Journal of Aquaculture, 65, 116–121.
Falahatkar, B. and Barton, B. A., 2007. Preliminary observations of physiological responses to acute handling and confinement in juvenile beluga Huso huso L. Aquaculture Research, 38, 1786-1789.
Falahatkar, B., Poursaeid, S., Shakoorian, M. and Barton, B., 2009. Responses to handling and confinement stressors in juvenile great sturgeon Huso huso. Journal of Fish Biology, 75, 784–796. Farrell, A.P. and Steffensen, J.F., 1987. An
analysis of the energetic cost of the branchial and cardiac pumps during sustained swimming in trout. Fish Physiology and Biochemistry, 4, 73–79.
___________________________________________________________________________ Fevolden, S. E., Roed, K. H. and Fjalestad,
K. T., 2002. Selection response of cortisol and lysozyme in rainbow trout and correlation to growth. Aquaculture, 205, 61–75.
Foss, A., Vollen, T. and Øiestad V., 2003. Growth and oxygen consumption in normal and O2 supersaturated water, and
interactive effects of O2 saturation and
ammonia on growth in spotted wolffish (Anarhichas minor Olafsen).
Aquaculture, 224, 105–116.
Fridell, F., Gadan, K., Sundh, H., Taranger, G.L., Glette, J., Olsen, R.E., Sundell, K. and Evensen, Ø., 2007. Effect of hyperoxygenation and low water flow on the primary stress response and susceptibility of Atlantic salmon
Salmo salar L. to experimental challenge with IPN virus. Aquaculture, 270, 23–35. Hosfeld, C.D., Engevik, A., Mollan, T.,
Lunde, T.M., Waagbø, R., Olsen, A.B., Breck, O., Stefansson, S. and Fivelstad, S., 2008. Long-term separate and combined effects of environmental hypercapnia and hyperoxia in Atlantic salmon (Salmo salar L.) smolts.
Aquaculture, 280, 146–153.
Hrubec, T.C. and Smith, S.A., 2000. Hematology of fish. In Veterinary Hematology, 5th edn (Feldman, B.F., Zinkl, J.G. & Jain, N.C., eds), pp. 1120– 1125. Philadelphia, PA: Lippincott Williams and Wilkins.
Hughes, G.M., 1973. Respiratory responses to hypoxia in fish. American Zoologist,
13, 475-489.
Iwama, G.K., Afonso, L.O.B. and Vijayan, M.M., 2006. Stress in fishes. In: Evans, D.H., Claiborne, J.B. (Eds.).The Physiology of Fishes. Taylor and Francis group, Boca Raton, pp. 319–342.
Jobling, M., 1994. Fish Bioenergetics. Chapman & Hall, London, Vol. XIV, 309 p.
Jobling, M., 1995. Environmental biology of fishes. Chapman and Hall Fish and fisheries series 16, 1–35.
Jones, D.R., 1971. Theoretical analysis of factors which may limit the maximum oxygen uptake of fish: the oxygen costs of cardiac and branchial pumps. Journal of Theoretical Biology, 32, 241–249. Lays, N., Iversen, M.M.T., Frantzen, M.
and Jørgensen, E.H., 2009. Physiological stress responses in spotted wolffish (Anarhichas minor) subjected to acute disturbance and progressive hypoxia. Aquaculture, 295, 126–133. Metcalfe, J.D. and Butler, P.J., 1989. The
use of alpha-methylp- tyrosine to control circulating catecholamines in the dogfish
Scyliorhinus canicula: the effects on gas exchange in normoxia and hypoxia.
Journal of Experimental Biology, 141, 21–32.
Nonnotte, G., Maxime, V., Truchot, J.P., WiUiot, P. and Peyraud, C., 1993. Respiratory responses to progressive ambient hypoxia in the sturgeon,
Acipenser baeri. Respiratory Physiology, 91, 71–82.
Olsvik, P. A., Kristensen, T., Waagbø, R., Tollefsen, K. E., Rosseland, B. O. and Toften, H., 2006. Effects of hypo- and hyperoxia on transcription levels of five stress genes and the glutathione system in liver of Atlantic cod Gadus morhua. The Journal of Experimental Biology, 209, 2893–2901.
Pauly, D., 1981. The relationships between gill surface area and growth performance in fish: a generalization of von Bertalanffy's theory of growth. Berichte der Deutshchen Wissenchaftlichen Kommission fur Meeresforschung, 28,
251–282.
Person-Le Ruyet, J., Pichavant, K., Vacher, C., Le Bayon, N., Sévère, A. and Boeuf, G., 2002. Effects of O2
supersaturation on metabolism and growth in juvenile turbot (Scophthalmus maximus L.). Aquaculture, 205, 373–383. Pichavant, K., Person-Le-Ruyet, J., Le
Bayon, N., Severe, A., Le Roux, A. and Boeuf, G., 2001. Comparative effects of long-term hypoxia on growth, feeding and oxygen consumption in juvenile turbot and European sea bass. Journal of Fish Biology, 59, 875–883.
Pichavant, K., Person-Le-Ruyet, J., Le Bayon, N., Severe, A., Le Roux, A., Quemener, L., Maxime, V., Nonnotte, G. and Boeuf, G., 2000. Effects of hypoxia on growth and metabolism of
juvenile turbot. Aquaculture, 188, 103– 114.
Rafatnezhad, S. and Falahatkar, B., 2011. Nitrogenous compounds and oxygen concentration as the key density dependent factors to optimize growth of beluga, Huso huso (Actinopterygii: Acipenseriformes: Acipenseridae), in circular fiberglass tanks. Acta Ichthyologica Et Piscatoria, 41, 285–291. Randall, D.J., 1982. The control of respiration and circulation in fish during hypoxia and exercise. Journal of Experimental Biology, 100, 275–288. Rantin, F.T., Kalinin, A.L., Glass, M.L.
and Fernandes, M.N., 1992. Respiratory responses to hypoxia in relation to mode of life of two erythrinid species (Hoplias malabaricus and Hoplias lacerdae).
Journal of Fish Biology, 41, 805–812. Redding, J.M., Schreck, C.B., Birks, E.K.
and Ewing, R.D., 1984. Cortisol and its effects on plasma thyroid hormone and electrolyte concentrations in fresh water and during seawater acclimation in yearling coho salmon, Oncorhynchus kisutch. General and Comparative Endocrinology, 54, 146–155.
Ritola, O., Tossasvainen, K., Kiuru, T., Lindstorm-Seppa, P. and Molsa, H., 2002. Effect of continuous and episodic hyperoxia on stress and hepatic glutathione levels in one-summer old rainbow trout (Oncorhynchus mykiss).
Journal of Applied Ichthyology, 18, 159– 164.
___________________________________________________________________________ Ruer, P.M., Cech, Jr.J.J. and Doroshov,
S.I., 1987. Routine metabolism of the white sturgeon, Acipenser transmontanus: effect of population density and hypoxia. Aquaculture, 62, 45–52.
Solati, N. H. and Falahatkar, B., 2007. Stress responses in sub-yearling great sturgeon to the air exposure. Caspian Journal of Environmental Sciences, 5, 99–103.
Thillart, G., Dalla Via, J., Vitali, G. and Cortesi, P., 1994. Influence of long-term hypoxia exposure on the energy metabolism of Solea solea. I. Critical O2
levels for aerobic and anaerobic metabolism. Marine Ecology Progress Series, 104, 109–117.
Thorarensen, H., Gustavsson, A. and Mallya, Y., 2010. The effect of oxygen saturation on the growth and feed conversion of Atlantic halibut (Hippoglossus hippoglossus L.).
Aquaculture, 309, 96–102.
Timmons, M.B., Ebeling, J.M., Wheaton, F.W., Summerfelt, S.T. and Vinci, B.J., 2001. Recirculating Aquaculture Systems. NRAC Publication, Cayuga Aqua Ventures, Ithaca. 34:151–154. Tran-Duy, A., Schrama, J.W., van Dam,
A.A. and Verreth, J.A.J. 2008. Effects of oxygen concentration and body weight on maximum feed intake, growth and
hematological parameters of Nile tilapia,
Oreochromis niloticus. Aquaculture, 275, 152–162.
Thillart, G. and Verbeek, R., 1991. Anoxia-induced oxygen debt of goldfish,
Carassius auratus. Physiological Zoology, 64, 525–540.
Valverde, J.C., Martínez López, F.J. and García, B.G., 2006. Oxygen consumption and ventilatory frequency responses to gradual hypoxia in common dentex (Dentex dentex): Basis for suitable oxygen level estimations. Aquaculture, 256, 542–551.
Vlasenko, A.D., 1994. Sturgeon status in the Caspian Sea. The International Conference on Sturgeon Biodiversity and Conservation. New York, NY, USA. July 1994.
Wedemeyer, G.A., 1997. Effects of rearing conditions on the health and physiological quality of fish in intensive culture. In: G.K. Iwama, A.D. Pickering, J.P. Sumpter, Schreck, C.B. (Eds), Fish Stress and Health. Aquaculture, 62, pp. 35–71. Cambridge: Cambridge University Press.
Wendelaar Bonga, S.E., 1997. The stress response in fish. Physiological Reviews, 77, 591–625.