Copyright © 2009-2010, Usability Professionals’ Association and the authors. Permission to make digital or hard
Awareness Measures Based on
Eye Tracking
William AlbertDirector
Design and Usability Center Bentley University
175 Forest St. Waltham, MA 02452 USA
Donna Tedesco Senior Usability Specialist Fidelity Investments 82 Devonshire, V3B Boston, MA 02109 USA
Abstract
Participants in a usability evaluation are often asked whether they noticed certain elements after some level of interaction with a design. The purpose of this study was to evaluate the reliability of self-reported awareness measures using eye tracking data. Participants were shown 20 popular
homepages for 7 seconds each and then asked afterwards if they saw 2 particular elements on each page. The results showed that self-reported awareness measures are reliable, but can vary depending on question structure and object type. These findings have implications for how usability practitioners ask questions about object awareness, and how that information is used in the design process.
Keywords
Introduction
Usability professionals often obtain participants self-reported measures of ease of use, with tools such as the System Usability Scale (SUS). Although subjective measures don’t always correlate with performance measures (e.g., success and time), self-reported questions such as those in the SUS have shown to be a reliable measure of attitudes, even at small sample sizes (Brooke, 1996; Tedesco & Tullis, 2006; Tullis & Stetson, 2004).
Another, perhaps more controversial, self-reported measure used in usability testing is
awareness; during or after a usability testing session it is common for a moderator to ask the
participant whether or not s/he had seen a particular element (Norgaard & Hornbaek, 2006). A moderator asks an awareness question because during the task the participant didn’t mention or use the element, and the moderator wants to understand why. For example, if a website introduces a new promotional area in the center of the homepage that leads to new functionality in the site, one goal of the usability test may be to see whether or not people click on that area, and why. Clickstream data or straight observation of a simple task-based test will reveal whether or not people use it; but for the participants who don’t, was it because they didn’t see the area altogether? Was it because they saw it but didn’t comprehend or attend to it? Or maybe saw it but decided it wasn’t what they wanted? Therefore the moderator may be inclined to ask, “Did you see this area while you were working through the task, or not?” or “How sure are you that you saw this area or not?” and follow up with questions to gather an explanation for why it wasn’t used.
One concern when asking this type of question is that we’re placing a fair amount of trust in what the participant is saying, or their self-reported awareness. Does the participant really remember seeing it? Does s/he have a false memory of it?
Some may say that instead of collecting self-reported awareness measures, practitioners should just use eye tracking as a reliable way to measure awareness during usability testing. There are a couple of problems with this argument. First, although the technology is improving and becoming more accessible to practitioners, eye tracking systems are still expensive. Most practitioners do not have access to an eye tracking system in their daily testing. Second, the data alone may still not completely provide insight into why a particular element wasn’t used, even if it was noticed. Asking self-reported awareness questions enables a conversation, or a follow-up question around the qualities of the element that prompt a user to act or not to act. Although such questions in testing may not be strictly related to the ease of use of an element, it speaks to the holistic user experience that is becoming of prominent importance for
practitioners.
Until eye tracking systems become less expensive and thus a more popular tool, usability practitioners may continue to ask questions regarding self-reported awareness. This prompted us to study how reliable self-reported awareness measures are using eye tracking data to validate it.
Related research by Guan, Lee, Cuddihy, and Ramey (2006) studied the validity of the Retrospective Think Aloud (RTA) method using eye tracking data. The RTA method is one in which a testing moderator waits until the end of the study to hear participants’ thoughts about their experiences (as opposed to the commonly used Concurrent Think Aloud method). This is usually initiated by playing back a video of the session to jog participants’ memories. In this fashion, Guan et al.’s research participants attempted some simple and complex tasks on a software interface, and then were shown a video playback of the session, complete with a running screen capture of where they were clicking and interacting. Participants were asked to think aloud along to the video to recount their experiences.
of validation were based mostly on whether they saw what they had claimed to. They weren’t being asked directly whether or not they saw an element. Guan et al. did measure the extent to which participants did not discuss elements that they in fact visually attended to. They labeled these as omissions. Participants had omissions 47% of the time, meaning that almost half of the time they did not mention elements that they looked at. As the researchers discussed,
omissions may have occurred because participants forgot about seeing the elements, or perhaps simply because they just didn’t think or care to mention them. Regardless, our research question still stands—if participants don’t talk about an element in question, did they see it or not?
A more closely related research study (Johansen & Hansen, 2006) gave participants simple tasks to perform, all of which involved finding information on a webpage. Participants’ eye movements were captured with an eye tracker while they performed the task. Immediately after the task they were asked to repeat their eye movements on the webpage, which was also captured with an eye tracker. Preliminary results of the study showed that participants’
recollections of elements they had seen, as captured by their attempted repeated eye
movements, were valid 70% of the time. Upon further investigation, they found that there was some evidence that the types of elements participants attended to created some difference in validity of recollection; for example, a logo was recollected only 34% of the time, while photos, navigation elements, and text elements were remembered 77%, 74%, and 75% of the time, respectively. It is possible that repeating eye movements may yield different results than verbally remembering seeing an element, and it is also possible that participants unnaturally concentrated harder to remember their gazes in anticipation of repeating them. Despite or even in light of these possibilities, the research suggests that there may be greater error (at least 30%) associated with participants’ recollections of elements on a page they had just seen—and especially differing by type of element. This was a more likely hypothesis for our research, given that psychology studies have shown that humans are not able to reliably recount their
experiences, nor for that matter, understand their basis for decision-making (Wilson, 2004). This study extended on this previous research by examining the reliability of self-reported awareness measures commonly used in usability testing.
Methods
Two experiments were conducted with a total of 80 participants (46 females and 34 males). Participants were randomly split into two groups of 40: one group using an eye tracking system (ET), and one group not using an eye tracking system (NET). The procedure for each participant was as follows:
All participants signed a consent form stating the purpose of the study and their rights as study participants.
For the eye tracking group, participants were first calibrated on a Tobii 1750 eye tracking system. All 40 participants in the ET group were successfully calibrated. The participants in the NET group were not calibrated nor told anything about the eye tracking system.
Each participant was shown a PowerPoint presentation. The first two slides of the presentation consisted of instructions.
Participants were told that they would be seeing a series of popular webpages. They were instructed to “try to get a sense of the key information on the page.” They were told that they would be asked about what they saw on each of the pages, and there was no right or wrong response.
Following the instructions, each participant was shown screenshots of 20 different homepages of various popular websites, including CNet, Craigslist, eBay, Yahoo, ESPN, eTrade, Monster, CNN, Target, YouTube, Yahoo!, etc. Websites were chosen based on general familiarity and representing a cross-section of interests.
The homepage for each of these websites was shown for 7 seconds (the study
screenshot). After 7 seconds it automatically advanced to a 1 second buffer page, and
Each participant was then asked 1 of 2 questions about the area outlined in red (the highlighted area), herein referred to as Experiment 1 and Experiment 2. For Experiment 1, 40 participants were asked “Tell us whether you noticed each highlighted area, on a 3-point scale”:
1 = Definitely did not notice
2 = Not sure
3 = Definitely did notice
For Experiment 2, 40 participants were asked “How much time did you spend looking at the highlighted area?” The participants were asked to respond to this question using a 5-point scale, with 1 representing not spending any time at all looking at an element and 5 representing spending a long time looking at an element.
Each participant in an experiment group was given the same question for all homepages. There were, therefore, 40 participants each in Experiments 1 and 2 (including 20 eye tracking and 20 non-eye tracking for both experiments) (see Table 1). After the participant answered the question for each of the two elements on the test screenshot homepage, s/he manually advanced the screenshot to the next timed study screenshot homepage. Each participant went through the same process for all 20 homepages and 2 elements per page, for a total of 40 elements per participant. The study took approximately 15 minutes per participant.
Table 1. Number of Participants for Each Experiment and Eye Tracking Condition
Eye Tracking Condition Expt. 1 (“Did you notice”) Expt. 2 (“How much time”)
Yes (ET) 20 participants 20 participants
No (NET) 20 participants 20 participants
There was a deliberate effort to choose different types of elements, as it was possible that the reliability for self-reported awareness was better for certain types of elements. Specifically, we wanted to compare elements that were based on image (i.e., advertisement or picture), navigation, and function (requiring some interaction such as a search box). Figure 1 is an example of both the study screenshot and test screenshot for The Weather Channel homepage. The two elements highlighted include a picture advertisement and a functional search feature.
Figure 1. Study screenshot (left) and test screenshot (right) for the homepage of The Weather Channel, showing elements bounded by a thick red rectangle
search box at the top of Figure 1) subtended 2O vertical and 9O horizontal. All participants were given two free movie passes at the conclusion of the study.
Memory Test
Aside from comparing participants’ responses with eye tracking data, we wanted to incorporate a memory test as another way to measure the reliability of participants’ responses. For 7 of the 40 elements (each on a separate homepage), we swapped a new element into the exact location on the test screenshot where the original element had appeared on the study screenshot. These new elements were mixed in with all the others, and participants were not told about them until the end of the study. This was executed in both experiments, as well as for both the eye tracking and non-eye tracking conditions. Figure 2 shows an example of an element on the eBay study screenshot, and the new element replacing it on the test screenshot. During the study, only a few participants remarked that the visual elements appeared to have changed from one screen to the next. In these cases, the moderator did not acknowledge nor deny the fact that an element may have changed. At the conclusion of the study, participants were told that some of the elements did change from one screen to the next. None of the participants reported any negative comments about this aspect of the study.
Figure 2. The study screenshot for the eBay homepage (left) and the test screenshot for the eBay homepage showing a “fake” element (“sold out tickets”)
Results
For all analyses we excluded neutral responses—i.e., Not sure for Experiment 1 and the neutral rating of 3 for Experiment 2. Although it is important to offer a neutral or unsure response as a legitimate answer choice, it is obvious that a neutral or unsure response such as “I’m not sure” would not provide meaningful direction, regardless of its reliability. Moreover, it is not possible to test the reliability or accuracy of a neutral response with eye tracking or memory test data. Therefore the analyses to follow were all broken down by definitely saw and definitely did not see in the case of Experiment 1, and top 2 box (a response of four or five on the 5-point scale) and bottom 2 box (a response of one or two on the 5-point scale) for time spent on an element in the case of Experiment 2.
Eye Tracking vs. Non-Eye Tracking
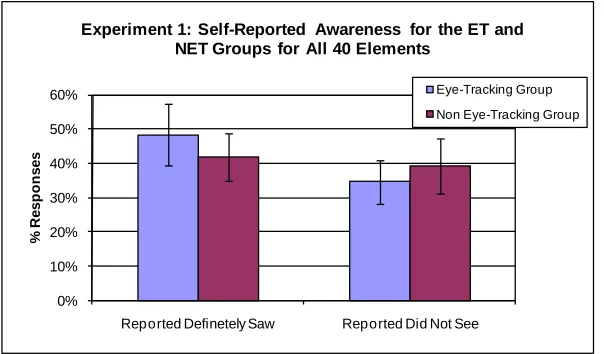
Figure 3 shows the responses for the ET and NET groups for Experiment 1. ET participants reported definitely seeing an element 48% of the time, compared to 42% of the time for the NET group. This difference was not statistically different, t(38) = 1.14, p = 0.26. The ET group reported definitely not seeing an element 35% of the time, compared to 39% of the time for the NET group. This difference was also not statistically significant, t(38) = 0.86, p = 0.39. Overall, this result suggested that the presence of the eye tracking technology did not significantly influence how participants responded to the question posed in Experiment 1.
0% 10% 20% 30% 40% 50% 60%
Reported Definetely Saw Reported Did Not See
%
R
e
s
p
o
n
s
e
s
Experiment 1: Self-Reported Awareness for the ET and NET Groups for All 40 Elements
Eye-Tracking Group
Non Eye-Tracking Group
Figure 3. Average self-reported awareness of ET vs. NET groups for Experiment 1 (error bars represent 95% confidence intervals)
Figure 4 shows the responses of the ET and NET groups for Experiment 2. ET participants reported spending a long time looking at the elements (top 2 box response) about 17% of the time, compared to 21% of the time for the NET group. This difference was not statistically significant, t(38) = 0.89, p = 0.38. ET participants reported spending little or no time looking (bottom 2 box response) at the elements 66% of the time, compared to 62% of the time for the NET group. This difference also was not statistically significant, t(38) = 0.74, p = 0.46. Similar to Experiment 1, there was no data to suggest that there was a significant impact of eye tracking on participants responses to the question posed in Experiment 2.
Experiment 2: ET vs NET Groups (for all 40 elements)
0% 10% 20% 30% 40% 50% 60% 70% 80%
Top 2 Box Bottom 2 Box
%
o
f
R
e
s
p
o
n
s
e
s Eye-Tracking Group Non Eye-Tracking Group
Even though there was not a statistical difference between the ET and NET groups for either Experiment 1 or 2, NET participants trended towards more likely to say they definitely saw an element and spent a long time looking at an element. This was not surprising because the NET group knew there was no way their responses could be validated. We speculated that ET participants tended to be slightly more conservative in their responses. Because this was only a slight trend, it was safe to assume that any results of the ET-only data would generalize to typical testing situations in which participants were not being eye tracked.
Fixation Count
Fixation count is one type of data that is calculated from the eye tracking software. Fixation count refers to the total number of fixations a participant has on a pre-defined Area of Interest (AOI). All 40 of the elements were individually defined as AOIs. A fixation is defined by a time parameter. The system default of 100 ms was used in both experiments. Therefore, a fixation was defined as having fixated in a given area for at least 100 ms.
The first test on the reliability of self-reported awareness was based on fixation count. If there was no difference in fixation count based on how they responded to the questions in
Experiments 1 and 2, we concluded that there was absolutely no reliability in their self-reported awareness. If we did observe a difference in fixation count, we concluded that, at a minimum, there was a difference in eye movement patterns based on a self-reported awareness response. For all of these analyses, we excluded the 7 “fake” elements that were used as part of the memory test.
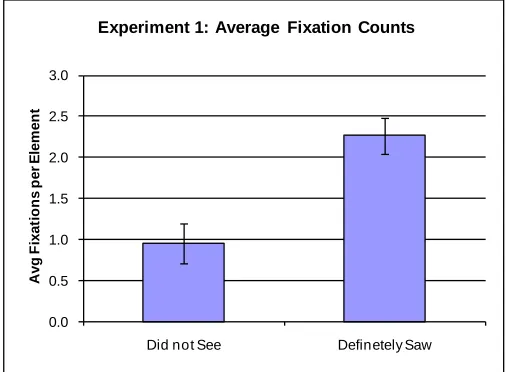
In Experiment 1, participants who responded that they definitely saw an element had an average of 2.3 fixations, compared to 0.9 fixations for those who responded that they did not see an element (see Figure 5). This difference was statistically significant,t(38) = 5.45, p < 0.001.
0.0 0.5 1.0 1.5 2.0 2.5 3.0
Did not See Definetely Saw
A
v
g
F
ix
a
ti
o
n
s
p
e
r
E
le
m
e
n
t
Experiment 1: Average Fixation Counts
Figure 5. Average fixation counts for Experiment 1 by response type (error bars represent the 95% confidence interval)
Experiment 2: Average Fixation Counts 0.0 0.5 1.0 1.5 2.0 2.5 3.0 3.5
Bottom 2 Box Top 2 Box
A v g F ix a ti o n s p e r E le m e n t
Figure 6. Average fixation counts for Experiment 2 by response type (error bars represent the 95% confidence interval)
Overall, the number of fixations per element differed significantly for both response types in Experiments 1 and 2. This finding shows that there is at least some level of reliability for self-reported awareness measures based on fixations.
Gaze Duration
To further test minimal reliability of self-reported awareness, gaze duration was examined. Gaze duration is the total time spent fixating within any AOI or element. Gaze duration could include one or more consecutive or non-consecutive fixations on a single AOI. For example, a
participant could fixate on the element for 230 ms, focus their attention on another area of the webpage, and then re-focus their attention within the AOI for another 270 ms, resulting in total gaze duration of 500 ms. Similar to fixation counts, we excluded the 7 fake elements that were used as part of the memory test.
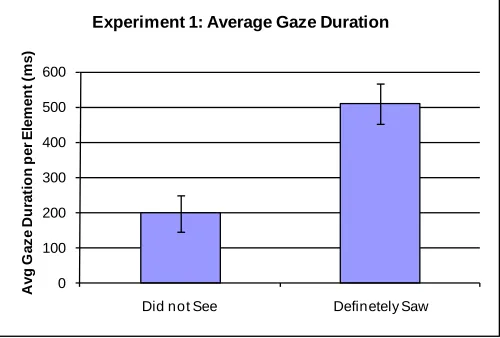
In Experiment 1, participants who responded that they did not see an element spent a total of about 200 ms fixating on that element, compared to 510 ms for those responding that they definitely saw an element (see Figure 7). This difference was statistically significant, t(38), = 4.49, p < 0.001.
0 100 200 300 400 500 600
Did not See Definetely Saw
A v g G a z e D u ra ti o n p e r E le m e n t (m s )
Experiment 1: Average Gaze Duration
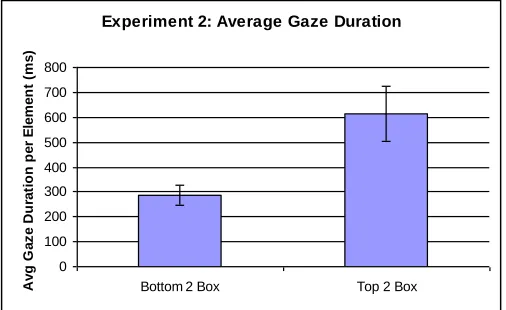
In Experiment 2, participants who responded that they spent little or no time looking at a particular element (bottom 2 box) had an average gaze duration of about 290 ms, compared to a gaze duration of about 615 ms for those participants who spent a significant amount of time looking at an element (top 2 box) (see Figure 8). This difference was also statistically
significant, t(38), = 4.65, p < 0.001.
Experiment 2: Average Gaze Duration
0 100 200 300 400 500 600 700 800
Bottom 2 Box Top 2 Box
A
v
g
G
a
z
e
D
u
ra
ti
o
n
p
e
r
E
le
m
e
n
t
(m
s
)
Figure 8. Average gaze duration by response type for Experiment 2 (error bars represent the 95% confidence interval)
Results of the gaze duration analysis were consistent with fixation counts. Participants who responded that they spent a significant amount of time looking at an element (top 2 box) had an average gaze duration more than twice that of those that responded having spent little or no time looking at an element.
Although this was not surprising, it was an affirmation that people’s recollections of the elements have some basis in eye movements, as measured by both fixation count and gaze duration, and weren’t completely mistaken.
Overall, we felt confident that there was a minimum level of reliability of self-reported
awareness measures. However, having a minimum level of confidence was not enough to justify the use of self-reported awareness questions during a usability evaluation. Therefore, we decided to take a more in-depth look at the different types of responses made by participants.
Response Outcomes
A more rigorous examination of the reliability of self-reported awareness was made by categorizing each response relative to gaze duration. The following were the four types of outcomes in this analysis (see Table 2):
A false alarm occurred when the participant reported noticing an element, yet had a
gaze duration = 0 ms. In other words, the participant said s/he definitely saw it (Experiment 1) or spent a long time looking at it (top 2 box response in Experiment 2), yet spent absolutely no time fixating on any part of the element.
A hit happened when the participant responded that they noticed the element
(Experiment 1) or spent a significant time looking at the element (Experiment 2), and had a gaze duration > 250 ms.
A correct rejection occurred when the participant responded not having seen the
element (Experiment 1) or spent no time looking at an element (Experiment 2), and had a gaze duration < 250 ms.
False alarms and misses could be collectively thought of as the overall error rate, because participants either remembered an element they didn’t see (false alarm) or didn’t remember an element they did fixate on (miss). Conversely, a success rate was based on the combination of hits and correct rejections.
It should be noted here that there is varying research regarding appropriate parameters of gaze duration to measure attention. The “eye-mind hypothesis” (Just & Carpenter, 1980) suggested that people process words and other information instantaneously upon seeing them (a 0 ms duration), while other research has used or suggested up to 250 ms for text (Guan et al., 2006; Johansen & Hansen, 2006; Rayner & Pollatsek, 1989) and 100 ms for pictures, graphs, or numerical data (Guan et al., 2006). In the categorization scheme above, the criteria used to define each outcome were somewhat arbitrary, but with these researched parameters as guidance. For this study, we adopted a liberal definition of what we considered a success (250 ms cutoff), and a conservative definition of what we considered an error (up to 500 ms for a miss). Essentially, we wanted to give the participants the benefit of the doubt wherever possible.
Table 2. Categorization of Error and Success Types for Experiments 1 and 2
Responses Errors Success
Definitely saw (Expt. 1) or top
2 box (Expt. 2) False alarm (gaze duration = 0ms) Hit (gaze duration > 250 ms) Definitely did not see (Expt. 1)
or bottom 2 box (Expt. 2) Miss (gaze duration > 500 ms) Correct rejection (gaze duration < 250 ms)
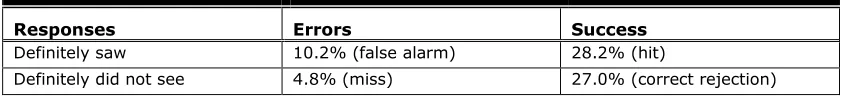
For Experiment 1, there was an overall error rate of 15% (see Table 3). There was roughly twice the number of false alarms (10.2%) as misses (4.8%). The success rate in Experiment 1, approximately split between correct rejections and hits, was 55.2%.
Table 3. Response Outcomes for Experiment 1
Responses Errors Success
Definitely saw 10.2% (false alarm) 28.2% (hit)
Definitely did not see 4.8% (miss) 27.0% (correct rejection)
The overall error rate in Experiment 2 was 17.4% (see Table 4). Similar to Experiment 1, participants made about half as many false alarms (4.8%) as misses (12.6%). The overall success rate was 33.8%, with roughly more than twice as many correct rejections (22.1%) as hits (11.7%).
Table 4. Response Outcomes for Experiment 2
Responses Errors Success
Top 2 box 4.8% (false alarm) 11.7% (hit)
Bottom 2 box 12.6% (miss) 22.1% (correct rejection)
when in fact they did 4.8% (Experiment 1) or 12.6% (Experiment 2) of the time. Taken together, there was an overall error rate of 15% (Experiment 1) to 17% (Experiment 2). Even though words and images may be easily encoded into memory in less than 500 ms, it was possible that participants fixated with little or no attention. To be even more conservative in how we classified errors, we adjusted the threshold for misses up to 1,000 ms. For Experiment 1, the miss rate dropped from 4.8% down to 1.1%. For Experiment 2, the miss rate dropped from 12.6% down to 5.8%. When adopting this highly conservative approach to classifying errors, the overall error rate was 11.3% in Experiment 1 and 10.6% in Experiment 2.
A substantial decrease in the miss rate was not surprising because the greater the fixation time, the less likely a participant reported definitely not noticing an element (Experiment 1) or spending no time looking at an element (Experiment 2). Essentially, the longer you spend looking at something, the more likely you are to notice it. Of course, it was still possible that participants looked at an element for 500 ms or even a full second and did not fully process the most basic characteristics.
Element Types
Is it possible that participants can be trusted with their self-reported awareness for just certain types of elements? To answer this question we decided to look at the following three specific types of elements:
Functional elements: features that are intended to be interacted with such as a search box or drop-down menu.
Navigation elements: primary navigation areas that are on a website such as tabs or left-side navigation links.
Image elements: ads or images associated with content.
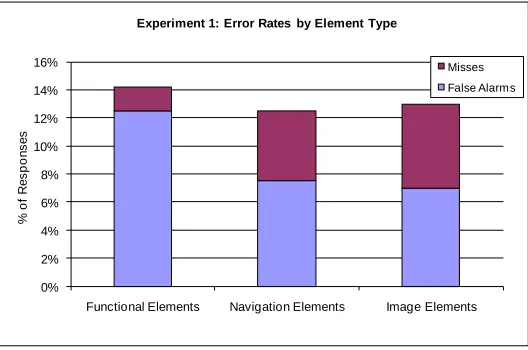
Experiment 1 showed a roughly equal error rate (false alarms + misses) for each element type (12% to 14% overall error) (see Figure 9). One interesting point was that functional elements tended to have a much greater proportion of false alarms compared to misses.
0% 2% 4% 6% 8% 10% 12% 14% 16%
Functional Elements Navigation Elements Image Elements
%
o
f
R
e
s
p
o
n
s
e
s
Experiment 1: Error Rates by Element Type
Misses
False Alarms
Figure 9. Overall error rates by element type for Experiment 1
0% 2% 4% 6% 8% 10% 12%
Functional Elements Navigation Elements Image Elements
%
o
f
R
e
s
p
o
n
s
e
s
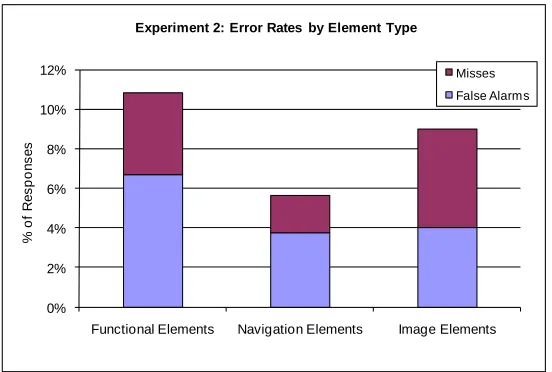
Experiment 2: Error Rates by Element Type
Misses
False Alarms
Figure 10. Overall error rates by element type for Experiment 2
Memory Test
A memory test was also used to test the reliability of self-reported awareness. By asking participants if they saw an element that did not exist, we were able to accurately determine the reliability of their responses. We treated the memory test as a separate analysis from the other elements. Taking the responses to the seven new elements used across both the ET and NET groups, we simply derived the percentage of the time participants claimed that they definitely saw it (Experiment 1) or spent a long time looking at it (top 2 box for Experiment 2).
The results of the memory test are shown in Table 5. Experiment 1 resulted in 27% of the responses saying that they definitely saw an element that did not exist in the study slide. Experiment 2 produced a lower false alarm rate; 9% of the responses said that they spent a significant amount of time looking at an element (top 2 box response) that did not exist.
Table 5. Response for Memory Test (ET and NET Groups Combined)
Response Percent
Definitely saw (Experiment 1) 26.8% Top 2 box (Experiment 2) 8.9%
Discussion
scenario, the participant would also have some motivation for not saying they saw something that they actually did. This could conceivably happen if the participant was embarrassed in some way. Because both of these conditions are very unlikely to occur together within a single scenario, we feel that analyzing misses as part of an overall error rate is misleading. Therefore, we believe examining false alarms, and not misses, is more realistic and useful to the
practitioner.
When considering only false alarms the picture is much clearer. In Experiment 1, there was a false alarm rate of 10%, and in Experiment 2 there was a false alarm rate of 5%. In other words, using either awareness question, the practitioner will not draw the incorrect conclusion more than 10% of the time. In Experiment 1 the success rate was 55% and 29% in Experiment 2. Therefore, the practitioner can make a tradeoff. If a practitioner wants to be very
conservative and minimize false alarms, they should consider asking an awareness question based on a more continuous scale, similar to Experiment 2. The downside is that they will be less likely to be able to confirm participants who actually said they saw it or did not see it. If the practitioner is willing to accept a higher false alarm rate using a more discrete awareness scale, they will better be able to confirm that participants noticed or did not notice an element. The false alarm rate for navigation and image elements was lower in both experiments than functional elements. In Experiment 1 the false alarm rates were about 7% for both the navigation and image elements. In Experiment 2 the false alarm rates were about 4% for the same elements. This is very encouraging, suggesting that there are certain elements that produce highly reliable results, regardless of how the question is structured.
The memory test focused only on false alarms. It was interesting to see that the false alarms were considerably higher in Experiment 1 (27%) compared to Experiment 2 (9%). This suggests that a more continuous scale may tease apart those participants that are much more confident, and those participants that might be a little less confident in their awareness for a particular object. Perhaps the discrete nature of Experiment 1 is pulling those participants that think they saw the object, but may not be sure, into the category of definitely saw it.
Limitations and Next Steps
There were a few limitations to this study. First, the dependent measures of fixation counts and gaze duration were not ideally suited for confirming lack of awareness. It was quite possible that an individual fixated on an element, yet was not attending or processing the information. Therefore, there was a certain level of noise represented in miss errors. Second, it was possible that usability participants exhibited different eye movement patterns and awareness levels when performing tasks, as compared to general orientation. While general orientation was quite common, particularly for new visitors to a website, it only represented one type of activity on a website. Third, it was possible that participants may have been familiar with some of the websites used in the study. When asked about their awareness, they may have been responding from long term memory. This could have resulted in false alarm errors. Basically, they said they saw it, because they remembered it from some past experience, yet had no fixations on it. There are several directions for future research. To further validate the findings in this paper, we suggest studying the impact of task-driven behavior on the reliability of self-reported awareness measures. Also, we would like to expand the type of elements. For example, it is possible that self-reported awareness of images of faces may be more reliable. Finally, it would be helpful to develop other types of measures of awareness. While we only tested two
measures, it is quite possible that other measures may produce more reliable results.
Conclusion
The manner in which the usability practitioner asks a participant about whether or not they noticed an object will have an impact on what is reported back to them. If a practitioner wants to identify as many participants as possible who saw an object, with less regard for accuracy, they should use an awareness question that is more discrete in nature. If a practitioner wants to be as confident as possible in those participants that report seeing an object, that actually did, they should use an awareness question that is more continuous in nature.
We do not suggest that one simple self-report awareness question can be a substitute for the reliability and versatility of an eye tracking system. There are many other research questions about awareness that can only be effectively answered using an eye tracking system. Asking a participant about awareness certainly may be useful during the course of a usability evaluation, but it is only the start in regards to all the questions a practitioner might have about how users look at a design.
Practitioner’s Take Away
The following were the main findings of this study:
Usability practitioners should feel confident in collecting self-reported awareness measures from participants.
If a practitioner wants to minimize the chance of making an incorrect conclusion, they should use a continuous (5- or 7-point) scale for self-reported awareness (similar to Experiment 2).
If a practitioner wants to maximize the likelihood of confirming that a participant did or did not see an element, they should use a discrete set of questions for self reported awareness (similar to Experiment 1).
Participants are more reliable in their self-reported awareness for navigation and image elements, than functional elements, regardless of question structure.
Acknowledgements
We would like to thank Mark Catalano and Maya Jackson for their help in data collection, and Tom Tullis for review of the manuscript.
References
Brooke, J. (1996). SUS: a “quick and dirty” usability scale. In P.W. Jordan, B. Thomas, B.A. Weerdmeester & A.L. McClelland (Eds.) Usability Evaluation in Industry (pp. 189-194). London: Taylor and Francis.
Guan, Z., Lee, S., Cuddihy, E., & Ramey, J. (2006, April). The Validity of the Stimulated Retrospective Think-Aloud Method as Measured by Eye Tracking. In R. Grinter, T. Rodden, P. Aoki, E. Cutrell, R. Jeffries, and G. Olson, (Eds.) Proceedings of the SIGCHI Conference
on Human Factors in Computing Systems, 2006 (pp.1253-1262) New York, New York, USA.
ACM Press.
Johansen, S., & Hansen, J.P. (2006, April). Do we need eye trackers to tell where people look?
In CHI ’06 Extended Abstracts on Human Factors in Computing Systems (pp.923 - 928)
New York, New York, USA. ACM Press.
Just, M.A., & Carpenter, P.A. (1980). A theory of reading: From eye fixations to comprehension,
Psychological Review, 87(4), 329-354.
Norgaard, M., & Hornbaek, K. (2006, June). What do usability evaluators do in practice?: an explorative study of think-aloud testing. In Proceedings of the 6th Conference on Designing
Interactive Systems (pp.209-218) New York, New York, USA. ACM Press.
Rayner, K., & Pollatsek, A. (1989). The Psychology of Reading. USA: Prentice-Hall. Tedesco, D., & Tullis, T. (2006, June). A Comparison of Methods for Eliciting Post-Task
Subjective Ratings in Usability Testing. In Proceedings of the Usability Professionals
Tullis, T., & Stetson, J. (2004, June). A Comparison of Questionnaires for Assessing Website Usability. In Proceedings of the Usability Professionals Association (UPA), USA.
Wilson, T. (2004). Strangers to Ourselves: Discovering the Adaptive Unconscious. USA: Belknap Press.
About the Authors
Bill Albert
Bill Albert is Director of the Design and Usability Center at Bentley University. His research interests include user experience metrics, eye tracking, and the usability of health care technology. He is co-author of two books on quantitative usability methods. He holds a Ph.D. from Boston University in Geography (Spatial Cognition).