International Journal of Innovative and Emerging Research in Engineering Volume 3, Issue 3, 2016
25 Available online at www.ijiere.com
International Journal of Innovative and Emerging
Research in Engineering
e-ISSN: 2394 - 3343 p-ISSN: 2394 - 5494
Power Factor Correction in Single Phase AC-DC Converter
Dhaval Vijaykumar Jariwala
aa P.G. Student, Department of Electrical Engineering, SCET college ,Surat , India
ABSTRACT:
Switched-mode power supplies employ either variable switch duty cycle or variable switching frequency (occasionally both) associated with feedback circuitry to provide the required output voltage and output current. Today it is possible to design variety of pfc circuit with different modes of operation. There exist two mode of operation discontinuous and continuous. Here didode bridge rectifier act as non linear load and because of non linear load there is distortion in input current. Buck-boost converter in discontinuous inductor current mode is studied and simulated. The peak current control technique for continuous conduction mode is studied and simulated in MATLAB beacause it allows low THD input current and unity power factor. The MATlab/Simulink results of peak current control technique comply with IEEE 519-1992 standard.
Keywords: Power Factor, harmonics, MATLAB, IEEE ,THD.
I. INTRODUCTION
The equipment connected to an electricity distribution network usually wants some kind of power conditioning, typically rectification, which yields a non-sinusoidal line current owing to the nonlinear input characteristic. The nonlinear characteristics of loads such as tv, personal computers, faxes have made harmonic distortion in distribution systems.This outcomes in a poor power factor at input ac mains. The lower the power factor, the greater the apparent power drawn from the distribution network [1]. This means that the supply company must set up more generation capacity, larger size transmission lines, transformers and other distribution system devices, which otherwise would not be needed.
For sinusoidal voltage and non-sinusoidal current
PF = Vrms I1,rms cos φ
Vrms Irms =
I1,rms cos φ
Irms =Kd cos φ [1] Kd =distortion factor cos φ=displacement factor
II. SINGLE PHASE RECTIFIER WITHOUT PFC
The diode bridge rectifier, shown again in Figure 1, has non-sinusoidal input current. This is because most loads require a supply voltage with less ripple, which is gained by using a correspondingly bulky capacitance the output capacitor. Consequently, the conduction intervals of the rectifier diodes are small and the input current consists of thin pulses with harmonic content.
Figure 1. Single Phase Diode Bridge Rectifier
26 (a)
(b)
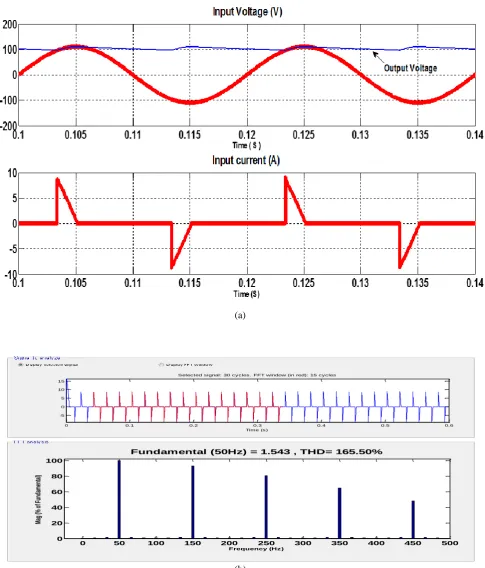
Figure 2 Diode bridge rectifier (a) Input voltage, output voltage (upper plot) and Input current (lower plot). The Input current has THD=165.50% , Kd=0.5171, cosφ =0.9515 and PF =0.4920 (b) Line current harmonics
Output voltage is 110 V and Total Harmonic Distortion in input current is 165.50% as shown in Figure 2. Displacement Factor is 0.9515 and total supply power factor is 0.4920 which is very poor and utility company may penalize customer. We can get unity power factor by employing active power factor correction. Here we use DC-DC Converter for active power factor correction. There are two mode discontinuous inductor current mode and continuous inductor current mode. In discontinuous inductor current mode inductor current is zero in beginning and end of each switching cycle. In continuous inductor current mode inductor current does not reach to zero in each switching cycle.
0 0.1 0.2 0.3 0.4 0.5 0.6
-5 0 5 10 15
Selected signal: 30 cycles. FFT window (in red): 15 cycles
Time (s)
0 50 100 150 200 250 300 350 400 450 500
0 20 40 60 80 100
Frequency (Hz )
Fundamental (50Hz) = 1.543 , THD= 165.50%
M
ag
(%
o
f F
un
da
m
en
ta
International Journal of Innovative and Emerging Research in Engineering Volume 3, Issue 3, 2016
27
III. DISCONTINUOUS INDUCTOR CURRENT MODE
In Discontinuous inductor current mode, the inductor is no longer a state variable since its state in a particular switching cycle is independent on the value in the preceding switching cycle [2]. The peak of the inductor current is follow the input voltage automatically. This property of DCM input circuit can be called “self power factor correction” because not any control loop is required from its mains side and output side [2]. In steady state operation, the output voltage is nearly constant and duty ratio is also constant [3]. Here buck-boost converter is used because its input voltage input current characteristics are linear. Here input current consist of triangle pulse and hence only used for load less than 50 W.
Figure 3 MATLABSimulation model of DICM buck-boost Converter
(a)
powergui Discrete, Ts = 5e-007 s
Voltage1 v +
-Voltage v +
-Scope 1
Scope
R
Pulse Generator 1
Mosfet
g m
D S
L
Diode4
Diode3 Diode2
Diode1 Diode
Current i +
28 (b)
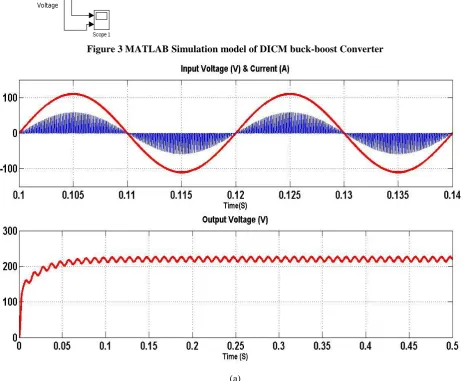
Figure 4 DICM buck- boost PFC (a) Input Voltage & Current and Output Voltage. The Input current has THD=119.08 % , Kd=0.6430, cosφ =0.9999 and PF =0.6429 (b) Line current harmonics
Figure 3 show the matlab Simulink model of buck-boost converter in discontinuous inductor current mode. Here mosfet is used as switching device. Switching frequency is 5 KHz and duty cycle is 0.5. Inductor value is 2 mH .Total harmonic distortion in input current is 119.08% which is less than without PFC and power factor is 0.6429. From figure 3(a) we observed that average input current is follow input voltage but input current is triangle pulse whose peak follow input voltage. To get unity power factor converter must operate in continuous inductor current mode.
IV. CONTINUOUS INDUCTOR CURRENT MODE
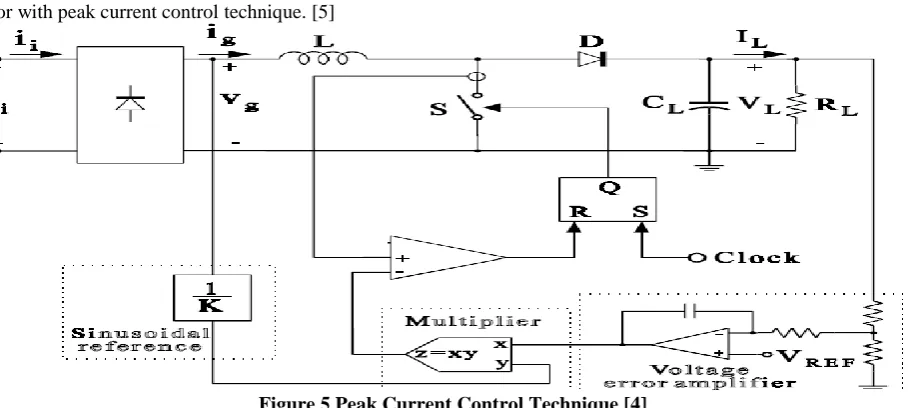
A diode rectifier effects the ac/dc conversion, while the controller operates the switch in such a way to properly shape the input current according to its reference current. The output capacitor absorbs the input power ripple, allowing a small ripple of the output voltage [4]. The boost topology is very simple and allows low-distorted input currents and almost unity power factor with peak current control technique. [5]
Figure 5 Peak Current Control Technique [4]
International Journal of Innovative and Emerging Research in Engineering Volume 3, Issue 3, 2016
29 replica of the rectified input voltage times the output of the voltage error amplifier, which sets the current reference amplitude [4]. Thus, reference is naturally synchronized and always proportional to the input voltage, which is the condition to obtain unity power factor. [4]
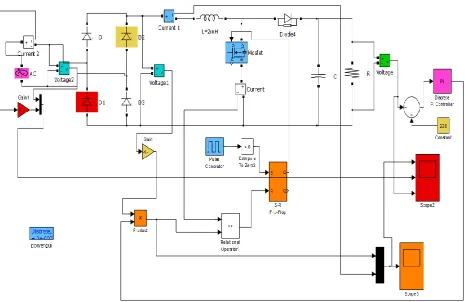
Figure 6 MATLAB simulation model of Peak Current Control Technique
(a)
0.1 0.102 0.104 0.106 0.108 0.11 0.112 0.114 0.116 0.118 0.12
0 5 10
Time(S) Inductor Current(A)
0.1 0.11 0.12 0.13 0.14 0.15 0.16
-100 0 100
Time(S)
Input Voltage(V) & Current(A)
0 0.05 0.1 0.15 0.2 0.25 0.3 0.35 0.4
0 100 200 300
30 (b)
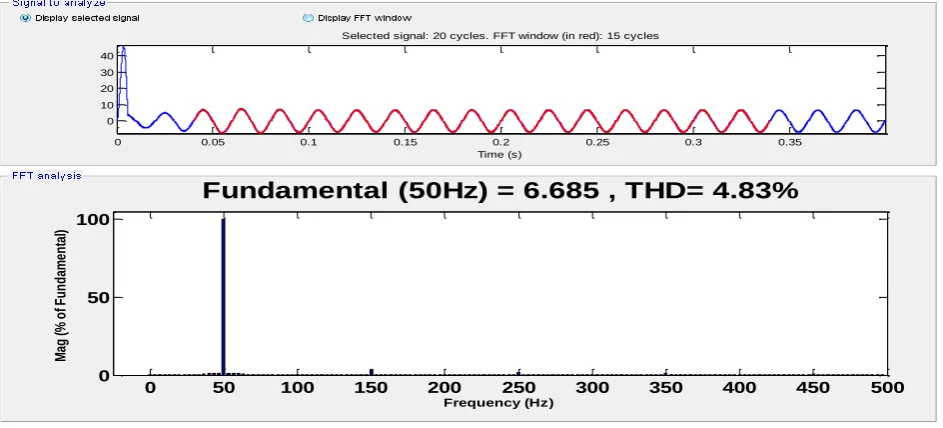
Figure 7 Peak current controlled boost PFC Vin=110 V Peak(a) Inductor Current, Input Voltage & Current and Output Voltage. The Input current has THD=4.83 %, Kd=0.9988, cosφ =0.9998 and PF =0.9986 (b) Line current harmonics
Figure 6 show the MATLAB Simulink model of peak Current Control in continuous inductor current mode. Here mosfet is used as switching device. Switching frequency is 50 KHz and duty cycle is 0.5. Inductor value is 2 mH. Output voltage is 220V. Total harmonic distortion in input current is 4.83% which is less than without PFC and power factor is 0.9986 From figure 7(a) we observed that input current and input voltage are in phase and same fashion. With peak current control technique we get unity power factor.
V. CONCLUSION
To comply with different standard the harmonic current needs to be reduced by some technique. Development of such a technique is known as power factor correction (PFC). Power factor correction counter balances the unwanted effects caused by the non-linear loads which account for the low power factor of the system. In this paper an active power factor correction peak current control technique is proposed. Active power factor correction (APFC) circuit on mains, which improves power factor from 0.4920 to 0.9986.
ACKNOWLEDGMENT
This research is the result of many endless hours of hard work. It would not have been possible to complete without the help and supervision of many people. With a sense of gratitude and respect, I would like to extend my heartiest thanks to all those who provided help and guidance. I would like to articulate my profound gratitude and indebtedness to my guide Prof. Rajesh Prasad who has always been a source of constant motivation and guiding factor throughout the course of the project, in and out as well.
REFERENCES
[1] IEEE 519 Recommended Practices and Requirements for Harmonic Control in Electrical Power Systems.” IEEE Industry Applications Society/ Power Engineering Society. 1993.
[2] Wei Huai, “Comparison of Basic Converter Topologies for Power Factor Correction.” Proc. of IEEE Applied Power Electronics Conference, APEC’98. pp. 348-353, 1998.
[3] Peter Kornetzky, Huai Wei, Guangyong Zhu and IssaBatarseh’ “A single-Switch Ac/Dc Converter with Power Factor Correction,” Electronics Letters, Dec. 1997, vol. 33, no. 25, pp. 2084-2085.
[4] Rossetto, L, “Control techniques for power factor correction converters.” University of Padova , Via Gradenigo 6/a, 35131 Padova – ITALY. pp. 1-9, 1994
[5] Yi-Jing Ke; Yu-fei Zhou; Jun-ning Chen, "Control Bifurcation in PFC Boost Converter under Peak Current-Mode Control," in Power Electronics and Motion Control Conference, 2006. IPEMC 2006. IEEE 5th International, vol.2, no., pp.1-5, 14-16 Aug. 2006
0 0.05 0.1 0.15 0.2 0.25 0.3 0.35
0 10 20 30 40
Selected signal: 20 cycles. FFT window (in red): 15 cycles
Time (s)
0 50 100 150 200 250 300 350 400 450 500
0 50 100
Frequency (Hz)