Optimization of cascade hydropower system operation by
genetic algorithm to maximize clean energy output
Aida Tayebiyan1*, Thamer Ahmad Mohammad2
1PhD, Environmental Health Engineering Research Center, Kerman University of Medical Sciences, Kerman, Iran 2Professor, Faculty of Engineering, Department of Civil Engineering, Universiti Putra Malaysia, 43300 Serdang, Malaysia
Abstract
Background: Several reservoir systems have been constructed for hydropower generation around the
world. Hydropower offers an economical source of electricity with reduce carbon emissions. Therefore, it is such a clean and renewable source of energy. Reservoirs that generate hydropower are typically operated with the goal of maximizing energy revenue. Yet, reservoir systems are inefficiently operated and manage according to policies determined at the construction time. It is worth noting that with little enhancement in operation of reservoir system, there could be an increase in efficiency of the scheme for many consumers.
Methods: This research develops simulation-optimization models that reflect discrete hedging policy
(DHP) to manage and operate hydropower reservoir system and analyse it in both single and multi-reservoir system. Accordingly, three operational models (2 single multi-reservoir systems and 1 multi-multi-reservoir system) were constructed and optimized by genetic algorithm (GA). Maximizing the total power generation in horizontal time is chosen as an objective function in order to improve the functional efficiency in hydropower production with consideration to operational and physical limitations. The constructed models, which is a cascade hydropower reservoirs system have been tested and evaluated in the Cameron Highland and Batang Padang in Malaysia.
Results: According to the given results, usage of DHP for hydropower reservoir system operation could
increase the power generation output to nearly 13% in the studied reservoir system compared to present operating policy (TNB operation). This substantial increase in power production will enhance economic development. Moreover, the given results of single and multi-reservoir systems affirmed that hedging policy could manage the single system much better than operation of the multi-reservoir system.
Conclusion: It can be summarized that DHP is an efficient and feasible policy, which could be used for
the operation of existing or new hydropower reservoir system.
Keywords: Optimization, Hedging policy, Reservoir operating rule, Genetic algorithm, Hydropower
reservoir system, Clean energy.
Citation: Tayebiyan A, Mohammad TA. Optimization of cascade hydropower system operation by genetic
algorithm to maximize clean energy output. Environmental Health Engineering and Management Journal 2016; 3(2): 99–106. doi: 10.15171/EHEM.2016.07.
*Correspondence to:
Aida Tayebiyan
Email: [email protected]
Article History:
Received: 3 May 2016 Accepted: 5 June 2016
ePublished: 18 June 2016
Introduction
The unavoidable growth of worldwide energy consump-tion and the adverse environmental impacts of burning fossil fuels pave way for extensive prospects to exploit renewable energies such as hydropower (1). Meanwhile, several reservoirs have been constructed for the genera-tion of hydropower in the world as a result of the con-straint on fuel usage, the pollution produced by fossil fuel and the benefits of using clean and renewable hydro energy. So, hydropower being a clean energy source will play an important role in the future. From economic point of view, reservoirs and power plants operation should be examined over a representative hydrologic period when designing and operating hydroelectric system in order to yield its maximum beneficiation in industry (2). But,
the operation of reservoir system is complicated because of the uncertainties of inflow and increasing energy de-mand due to development and population growth. For the above-mentioned reasons, different operational policies have been used and tested to improve the reservoir system operation such as the New York City rule (NYC rule) (3), the space rule (4), the pack rule (5), standard operation policy (6), and hedging policy (7). The operational poli-cies usually focus on the time and amount of water that would be released in horizontal time steps.
Meanwhile, hedging policies have gained substantial at-tention by researchers as a result of increase in water de-mand, uncertainty in water sources and occurrence of more droughts compared to the past. Hedging policies are generally applied to conserve some amount of water in the
© 2016 The Author(s). Published by Kerman University of Medical Sciences. This is an open-access article distributed under the terms of the Creative Commons Attribution License (http://creativecommons.org/licenses/by/4.0), which permits unrestricted use, distribution, and reproduction in any medium, provided the original work is properly cited.
Environmental Health Engineering and Management Journal HE
M J
http://ehemj.com
Original Article
Open AccessEnvironmental Health Engineering and Management Journal 2016, 3(2), 99–106 100
dry periods by reducing the water supply in some period in order to ease its intense deficiency. The main benefits of using hedging rules are to distribute the predictable wa-ter deficiency uniformly to reduce intense shortage in the future (8,9). Therefore, hedging policy are mostly used for the operation of reservoir system with the purpose of irri-gation, urban and industrial water, and drinking water to prevent the severe shortage in drought periods and seldom used for operation of hydropower systems. Since the out-put of hydropower production depends on water release and water head, the concept of hedging and rationing can be used in operation of hydropower reservoir in order to preserve the water storage and elevate the water level in a reservoir. It means that the output of power generation not only depend on water release but also on water head which is an important key factor, hence hedging policy cover both factors by keeping the water in the reservoir. In other words, when available water in the reservoir increases, the available head increases too and by smaller discharge the required power can be produced. In addition, it seems that the application of hedging policy for reservoir operation has been mostly presented in terms of optimal hedging. Consequently, the optimization-simulation technique has been used to develop the various types of hedging rules to find the decision variables in each form of hedging and specify optimum hedging policies such as (9-12).
Accordingly, the capability of hedging policy in operation of hydropower reservoir system in both single and multi-reservoir systems is investigated in this research. In order to survey both cases, the Cameron Highland and Batang Padang in Malaysia, which comprises of two cascade reservoirs system (Ringlet and Jor reservoir system) was selected as study area. At first, each of the reservoir sys-tem was constructed separately and then the two cascade reservoirs system was constructed in Matlab. Each model comprises of physical and operational constraints such as hydroplant discharge limits, water balance equation, reservoir storage volume, and hydro plant power limits based on the characteristics of specific system. After-wards, the genetic algorithm (GA) is linked to each of the constructed models in order to maximize the total power generation output in horizontal period. The given results of optimal hedging policy in both single and cascade hy-dropower reservoir system are evaluated and compared.
Methods
Water release based on discrete hedging policies
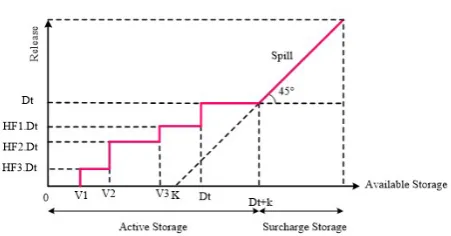
In the present research, hedging policy is used as an op-erational policy. One of the prominent forms of hedging policy is called discrete hedging policies (DHPs) since water rationing applies in discrete steps (13). The overall scheme of DHP is presented in Figure 1. For each time step in this policy, if available storage (WAt) is greater than Dt, target demand can be fulfilled without any rationing. If WAt is greater than V3 but less than Dt, then the stage-I of rationing will be occurring for the coming time step and only the fraction HF1 of target demand will be provided. If WAt is greater than V2 but less than V3, then the stage-II
Figure 1.Overall scheme of discrete hedging policy (DHP).
of rationing will be initiated. In this case, the demand will be decreased to only HF2 times of target demand. If WAt is greater than V1 but less than V2, then the stage-III of rationing will be occurring and the fraction HF3 of target demand will be discharged (14). In this water release pol-icy, it is assumed that the minimum trigger-volume will always be sustained in a reservoir. The trigger-volumes are determined according to the hydrology of inflows and amount of demand reduction due to water savings. The formulations of water release based on DHP are as follows:
Rt=Dt SPt=WAt- Dt-K WAt≥ Dt+K (1)
Rt=Dt SPt=0 Dt ≤ WAt<Dt+K (2)
Rt=HF1*Dt SPt=0 V3≤WAt<Dt (3)
Rt=HF2*Dt SPt=0 V2≤WAt< V3 (4)
Rt=HF3*Dt SPt=0 V1≤WAt< V2 (5)
Rt=0 SPt=0 WAt<V1 (6)
Where HF1, HF2, and HF3 represent the fraction of target demand at stage-I, stage-II, and stage-III respectively. V1, V2, and V3 represent hedging trigger-volumes at stage-I, stage-II, and stage-III respectively. Rt denotes Release at time period t, Dt denotes Target demand at time period t, SPt represents Spill at time period t, WAt represents Water available (available storage) at time period t, and K is the active storage. After determination of operational policy, physical and operational constraints such as hydro plant discharge limits, water balance equation, reservoir storage volume, and hydro plant power limits should be considered for the construction of models (15). Objective function and constraints The principal scope of this research is to discover how the hydropower reservoirs system could produce more power generation as a clean energy. Therefore, maximizing the total power generation throughout the horizontal time (2003-2012) was taken as an objective when ever differ-ent physical and operational limits are considered. Hence, the objective function can be affirmed as a nonlinear opti-mization problem, which is accompany with constrained (16). demand at time period t, SPt represents Spill at time period t, WAt represents Water available (available storage) at time period t, and K is the active storage. Figure1. Overall scheme of DHP (DHP) After determination of operational policy, physical and operational constraints such as hydro plant discharge limits, water balance equation, reservoir storage volume, and hydro plant power limits should be considered for the construction of models (15). Objective function and constraints The principal scope of this research is to discover how the hydropower reservoirs system could produce more power generation as a clean energy. Therefore, maximizing the total power generation throughout the horizontal time (2003-2012) was taken as an objective when ever different physical and operational limits are considered. Hence, the objective function can be affirmed as a nonlinear optimization problem, which is accompany with constrained (16). Max Gt = ∑ .Tt=1η0γ rtHt t (7)
Environmental Health Engineering and Management Journal 2016, 3(2), 99–106 101 m3), r
t: the discharge in time interval (m3/s), Ht: mean net head in time interval (in a daily scale), and t represents the length of time for release (hours).
It is worth noting that Rt, in other formula can be specified by multiplying rt and t.
The earlier mentioned objective function should be opti-mum while the following limits are provided (17).
Hydro plant discharge constraints
After specifying the release in time interval, the quantity of releases (Rt) must be checked to be in a permissible lim-its.
Rmin≤ Rt ≤ Rmax (8) Rmin shows the minimum allowable release and maximum allowable release (Rmax) is determined based on full capac-ity of turbines and tunnel capaccapac-ity, which divert the water from the source into a reservoirs system.
Water balance equation
After specifying release, storage at the beginning of the next time could be determined by using water balance equation (18).
St = St-1 + It - Et - Rt - SPt (9) Where, St: storage at time t, St-1: storage at time t-1, It: in-flow at time t, Et: evaporation at time t, Rt: release at time t, SPt: spill at time t.
Reservoir storage capacity
The reservoir storage capacity or water available in time interval must be located in permissible limits.
Smin≤ St ≤ Smax (10) Where, Smin: reservoir storage at minimum water level, and Smax: reservoir storage at maximum operating level.
Hydro plants power constraints
The power generation in time interval must be located in acceptable limits (19).
Gmin≤ Gt≤ Gmax (11) Where, Gmin: minimum energy generation (KWh), and Gmax: maximum power generation (KWh). The above-mentioned parameters are specified according to turbines capacity.
After constructing the reservoir system operation, the op-timization technique is linked to each of the constructed model in order to determine the optimized decision vari-ables in each operation system. In this research, GA is applied to optimize the problems. The procedure of this algorithm will be explained in the next section.
Optimization technique; genetic algorithm
Many optimization techniques have been successfully performed in reservoir operation studies. Meanwhile, GA is extensively used and reported by researchers as a pow-erful technique for optimization of the water resources (16). GA is inspired by the mechanisms of natural selec-tion and genetic of populaselec-tions.GA is a stochastic search method and use randomized operators such as selection, crossover, and mutation (20). The initial process of this
algorithm is creating the first population; which comprise of individuals. An individual represents a candidate for optimum solution that is called a chromosome. Chromo-some is made with a certain length string which is coded subsequently to be represented numerically. Afterwards, the fitness value is appointed to every population of chromosomes.
Fitness value is a parameter used in evaluating and decid-ing if the chromosomes can survive in a subsequent popu-lation or not. Selecting the best chromosome among the population, which can be transmitted to the subsequent generation, is determined by genetic operators such as se-lection, crossover, and mutation. According to the fitness value, the best candidates are selected as parents. There-fore, the next population carry the best genetic character-istics. In an overall, the cyclic of GAs consist of 5 major steps namely fitness evaluation, selection, cross over, mu-tation, and creation of a new population. For more details refer to (7,21-23).
In this research, GA is developed to optimize both single and cascade hydropower reservoir system namely Cam-eron Highland and Batang Padang Hydro Scheme (BPHS) in Malaysia. The objective of optimization is to specify the DHP in order to maximize the total power generation in time horizon (2003-2012).
Study area; Cameron Highland and Batang Padang hydropower scheme
The Sultan Abu Bakar dam was constructed on the Ber-tam River in the Cameron Highlands, Malaysia. The lake, which was created as a consequence of the dam construc-tion is called Ringlet reservoir. It forms an integral part of the Cameron Highlands Hydroelectric Scheme (CHHS) of the National Electricity Board. The dam preserves the waters of Bertam and Telom Rivers and their tributaries and transmits through the Telom tunnel into the Bertam catchment. From Ringlet reservoir, the water discharges through the Bertam tunnel and divert towards the Sultan Yusuf Power Station (SYPS), which has a total installed ca-pacity of 100 MW.
Tayebiyan and Mohammad
Results and Discussion
This section presents a survey of DHP’s performance in operation of single and multi-reservoir hydropower sys-tem. Both single and multi-reservoir hydropower system operation were constructed in MATLAB simulation. In this research, Cameron Highland and BPHS is selected as a case study. A flowchart of multi-reservoir hydropower system model which can be divided into two systems is illustrated in details in Figure 4.The first system include Ringlet reservoir and SYPS (left side of Figure 4) and the
Figure 2. Study area, location, and schematic diagram of
Cameron Highland and BPHS.
Table 1. Description of Cameron Highland and Batang Padang
Hydropower Scheme
Ringlet reservoir Jor reservoir
Gross storage 6.7 Mm3 3.8 Mm3
Usable storage 4.7 Mm3
Catchment area 183.4 km2 275 km2
Reservoir surface area 0.5 Km2 at EL. 1071.1 m 0.3 km2
Normal operating level EL. 1068.3 m 493 m Min operating level EL. 1065.2 m 486.1 m Max operating level EL. 1070.8 m 497 m
SYPS SIPS
Number of turbine 4 3 Type of turbine Pelton Pelton Turbines capacity 25 MW 50 MW Installed capacity 100 MW 150 MW Rated head 573 m
Abbreviations: SYPS, Sultan Yusuf Power Station; SIPS, Sultan Idris II Power Station.
101°25'0"E 101°25'0"E
101°24'0"E 101°24'0"E
101°23'0"E 101°23'0"E
101°22'0"E 101°22'0"E
101°21'0"E 101°21'0"E
101°20'0"E 101°20'0"E
101°19'0"E 101°19'0"E
101°18'0"E 101°18'0"E
4°29'0"N 4°29'0"N
4°28'0"N 4°28'0"N
4°27'0"N 4°27'0"N
4°26'0"N 4°26'0"N
4°25'0"N 4°25'0"N
4°24'0"N 4°24'0"N
4°23'0"N 4°23'0"N
4°22'0"N 4°22'0"N
4°21'0"N 4°21'0"N
4°20'0"N 4°20'0"N
101°30'0"E 101°20'0"E 101°10'0"E
4°40'0"N 4°40'0"N
4°30'0"N 4°30'0"N
4°20'0"N 4°20'0"N
4°10'0"N 4°10'0"N
Legend Reservoir River
Camero Highlands West Malaysia
Figure 3. (a) Monthly mean inflow coming to Ringlet reservoir,
(b) Monthly mean inflow and side stream flow coming into Jor
reservoir.
5 6 7 8 9 10 11
Jan Feb Mar Apr May Jun Jul Aug Sep Oct Nov Dec
Stream
fl
ow(
m
3/s)
(a) Monthly mean inflow coming to Ringlet reservoir
0 5 10 15 20 25
Jan Feb Mar Apr May Jun Jul Aug Sep Oct Nov Dec
Stre
am
Fl
ow
(m
3/s
ec)
(b) Monthly mean inflow and side stream flow coming to Jor resevoir
Jor Side stream
second system comprises of Jor reservoir and SIPS (right side of Figure 4). Three models were separately construct-ed in MATLAB simulation basconstruct-ed on the characteristics of specific system including;
Model I: Ringlet reservoir and SYPS Model II: Jor reservoir and SIPS
Model III: Combine system of Ringlet reservoir, SYPS, Jor reservoir, SIPS.
Thereafter, real coded GA is linked to the constructed model as an optimization technique to discover the op-timal solution of problems. The output of opop-timal power generation by using historical data (2003-2012) in both single (Model I and Model II) and multi-reservoir system model (Model III) are presented and discussed in this sec-tion. The values of constant parameters in construction of proposed models are as follows;
For Ringlet reservoir (m=1):Snpl1 =6,700,000 m3, Eff = 0.85, h1,0=485.8 m, Pmax =100 MW, tmax = 3652, and for Jor reservoir (m=2): Snpl2 =2,818,068 m3, Eff = 0.85, h
2,0 =76.2 m , Pmax =150 MW, tmax= 3652.
Model I & Model II: Analysis of result of optimized hedging policy model for operation of Ringlet and Jor reservoir system respectively
Environmental Health Engineering and Management Journal 2016, 3(2), 99–106 103 plant discharge limits, water balance equation, reservoir
storage volumes, hydro plant power limits, and release constraints based on DHP.
Model II: The BPHS comprises Jor reservoir and SIPS. A flowchart of Jor reservoir system operation which was constructed based on the specific characteristics and con-straints of Jor reservoir system is presented in the right side of Figure 4. BPHS system has an additional side stream, which supply more water to the Menglang tunnel (Figure 2). Although these side streams do not have any effect on Jor reservoir operation, they help in the genera-tion of addigenera-tional power in SIPS. In other words, the total power generation (Ptotal) is summation of power from Jor reservoir (Pm,t) and that from side stream (Pside stream). After construction of Ringlet and Jor reservoir system op-eration, the models were subsequently linked to the GA in order to find the optimal decision variables of system based on the DHP. Meanwhile, maximization of total power generation as a clean energy is chosen as an objec-tive function.
In this research, DHP was formulated as a release policy. In this policy, water rationing applies in discrete steps. The numbers of discrete steps are assumed to be three and the initial and end point of each step is the amount of avail-able water. For example, the initial point of the first step is V1 and its second point is V2. This policy has six decision variables, which are divided into two groups, (V1, V2, and V3) and (HF1, HF2, and HF3). V1, V2, and V3 are de-termined as a coefficient of active storage and HF1, HF2, HF3 are defined as a coefficient of target demand (D). Re-sults of optimal decision variables for discrete hedging in simulation period (2003-2012) at Ringlet and Jor reservoir system is presented in Table 2 respectively.
It is worth noting that one of the key factors in the con-struction of DHP model is the determination of target de-mand. No seasonal or annual demand pattern is used for hydropower reservoir system and the water demand is not constant and depends on the water head or water avail-ability. Generally, the output of power generation (G) is determined in terms of water head (H) and water release Start
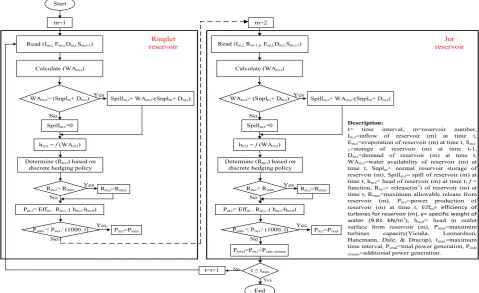
Read (Im,t,Rm-1,t, Em,t,Dm,t,Sm,t-1)
Ptotal=Pm,t+Pside stream m=2 m=1
Read (Im,t,Em,t,Dm,t,Sm,t-1)
Calculate (WAm,t)
WAm,t> (Snplm+ Dm,t) Yes
No
Spillm,t= WAm,t-(Snplm+ Dm,t)
Spillm,t=0
Determine (Rm,t) based on discrete hedging policy
Rm,t> Rmax Yes No
Rm,t=Rmax
Pm,t=Pmax Yes Pmax< Pm,t/ (1000. t)
No
Pm,t= Effm.. Rm,t.( hm,t-hm,0) hm,t=f(WAm,t)
Calculate (WAm,t)
WAm,t> (Snplm+ Dm,t) Yes
No
Spillm,t= WAm,t-(Snplm+ Dm,t)
Spillm,t=0
Determine (Rm,t) based on discrete hedging policy
Rm,t> Rmax Yes No
Rm,t=Rmax
Pm,t=Pmax Yes Pmax< Pm,t/ (1000. t)
No
Pm,t= Effm.. Rm,t.( hm,t-hm,0) hm,t=f(WAm,t)
t ≤ tmax
Yes No
t=t+1
End
Description:
t= time interval, m=reservoir number, Im,t=inflow of reservoir (m) at time t, Em,t=evaporation of reservoir (m) at time t, S m,t-1=storage of reservoir (m) at time t-1, Dm,t=demand of reservoir (m) at time t, WAm,t=water availability of reservoir (m) at time t, Snplm= normal reservoir storage of reservoir (m), Spillm,t= spill of reservoir (m) at time t, hm,t= head of reservoir (m) at time t,f= function, Rm,t= release(m3) of reservoir (m) at time t, Rmax=maximum allowable release from reservoir (m), Pm,t=power production of reservoir (m) at time t, Effm= efficiency of turbines for reservoir (m), γ= specific weight of water (9.81 kN/m3), h
m,0= head in outlet surface from reservoir (m), Pmax=maximum turbines capacity(Vicuña, Leonardson, Hanemann, Dale, & Dracup), tmax=maximum time interval, Ptotal=total power generation, Pside stream=additional power generation.
Ringlet
reservoir reservoirJor
Figure 4. Flowchart of multi-reservoir hydropower system operation.
Table 2. Results of optimal decision variables in single Ringlet and single Jor reservoir system
Point Point Optimal Parameter() Storage (m3) HF
Model I Ringlet reservoir
V1 a*K 0.213 4476394 0.531
V2 b*K 0.275 4652413 0.975
V3 c*K 0.430 5089372 0.981
Model II Jor reservoir
V1 a*K 0.235 1613972 0.520
V2 b*K 0.694 2449194 0.870
V3 c*K 0.700 2456400 0.951
DRinglet: target demand (700 000 m3), K
Ringlet: active storage (2 158 200 m3), a,b, and c: coefficient of active storage, DJor: target demand (1 Mm3); KJor:
(R). In an overall, the formula can be summarized as G=f (R, H). So, in order to determine the mean target demand (water release), the mean output of power generation and mean water head was specified based on recorded data (2003-2012) in each reservoir system. Based on the re-sults, the amount of target demand in simulation period was found 700 000 m3 for Ringlet reservoir and 1 Mm3 for Jor reservoir.
The mean and total output of power generation during the simulation period (2003-2012) by using optimal DHP compared with output of current policy (TNB) is present-ed in Table 3. According to the given results, mean output of power generation by using DHP could increase to about 13% of Ringlet reservoir and 5% of Jor reservoir system output respectively. In addition, by analysing the output of total power generation during the simulated period, it can be summarized that the given output is almost 13% higher than the total output of TNB in both reservoir system and this has great economical effect in the power sector and help the societies to use more clean energy.
Model I: Mean monthly power generation at Ringlet res-ervoir by using optimal operating policies and TNB is
compared and illustrated in Figure 5. The differences in power output between highest and lowest months are 10 (70-80 MW), while a value of approximately 31 (53-84 MW) was obtained for TNB operation, which is 3 times higher, hence by applying hedging policies, it can be con-cluded that the stability of the system will increase. Model II: Moreover, the comparison between mean monthly power generation at Jor reservoir by using optimal oper-ating policies and TNB is presented in Figure 5. The dif-ference in power production between highest and lowest months is almost 26 (100-126 MW), while this difference is 49 (87-136 MW) for TNB operation. In accordance to the obtained result, it can be summarized that the opera-tion of the reservoir by using hedging policies increases the stability of the system. Hedging policies are generally applied to distribute the water supply throughout the year in order to reduce the intense deficiency in dry periods. The highest and lowest monthly value of power genera-tion using TNB operagenera-tion occurred in Sep and Apr. While by employing hedging policies, the highest and lowest hydropower was generated in Nov and Feb respectively. This explanation verifies that by using hedging policies,
Table 3. Comparison of system’s mean and total power generation from 2003 to 2013 by using optimal DHP and current policy (TNB) at
Ringlet and Jor reservoir system respectively
Release policy Mean power generation (KWh) Total tower generation (GWh)
Model I Ringlet reservoir DHPTNB 897321792959 3277.912895.89
Model II Jor reservoir DHP 1325987 4843.829
TNB 1267158 4242.446
Abbreviations: DHP: discrete hedging policy, TNB: Tenga Nasional Berhad.
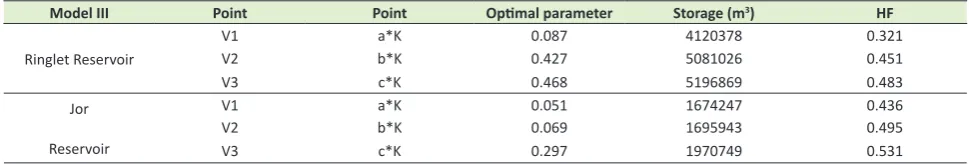
Table 4. Results of optimized decision variables of cascade hydropower reservoir system operation (Model III)
Model III Point Point Optimal parameter Storage (m3) HF
Ringlet Reservoir
V1 a*K 0.087 4120378 0.321
V2 b*K 0.427 5081026 0.451
V3 c*K 0.468 5196869 0.483
Jor
Reservoir
V1 a*K 0.051 1674247 0.436
V2 b*K 0.069 1695943 0.495
V3 c*K 0.297 1970749 0.531
Figure 5. Compare monthly mean power generation by using DHP and TNB policy at Ringlet and Jor reservoir.
40 50 60 70 80 90 100 110 120 130 140
Jan Feb Mar Apr May Jun Jul Aug Sep Oct Nov Dec
Mo
nth
ly
me
an
p
owe
r gen
era
tio
n
(MW
)
Month
DHP-Jor DHP-Ringlet TNB-Jor TNB-Ringlet
26MW 49MW
10MW
Environmental Health Engineering and Management Journal 2016, 3(2), 99–106 105 the water-supply spread across the simulation period (24).
Model III: Analysis of result of optimized hedging policy models for operation of integrated Ringlet and Jor reservoirs system
In order to demonstrate the applicability and performance of constructed release policies in hydropower system op-eration, two problems are considered: single reservoir and multi- reservoir system. The objective of both problems is to maximize the total power generation in the simula-tion period. Meanwhile, the integrated modelling is con-structed based on the characteristics of each reservoir sys-tem. These models comprise of several constraints such as hydro plant discharge limits, water balance equation, reservoir storage volumes, and hydro plant power limits. Another constraint known as the release-policy constraint is determined based on the DHP. Afterwards, the inte-grated model is linked to the RCGA to find the optimal solution for the decision variables of each reservoir by applying various types of hedging policies. The obtained results of cascade hydropower reservoir optimization are presented in Table 4. Based on the specific characteristics of each reservoir, the decision variables of each policy are optimized.
In order to compare the capability of constructed release policies for operation of the hydropower system in both single and multi-reservoir, two parameters are considered. These parameters are numbers of spill days and system’s total power generation. The number of non-power release days in simulation time (2003-2012) in both single and multi-reservoir system operation is compared and pre-sented in Table 5. Non-power release is the spilling water, which are not use for hydropower generation. The results affirm that in the case of single Ringlet system, DHP is capable of controlling the water supply in the reservoir in order to be utilized completely for hydropower generation without any non-power release. However in the cascade system, 1519 days of 3652 non-power days release could occur in Ringlet reservoir, which is not acceptable. The performance of Jor reservoir is much better in comparison with Ringlet reservoir performance in the multi-reservoir system. Since, both cases will not be faced the non-power release.
In addition, system’s total power generation by applying all types of hedging policies in the both single and multi-reservoir system is presented in Table 5. The results indi-cate that the amount of total power generations at the sin-gle Rinsin-glet system is less than the power output at Rinsin-glet reservoir in the cascade system. However single Ringlet system perfectly manages the water supply and the spilling water is zero, while the spilling water occurred at Ringlet reservoir in the cascade system. This inconsistency can be
explained by the objective function used in the optimiza-tion process. The objective of both single and multi-res-ervoir systems is to maximize the total power generation in the simulation period. As a result, the multi-reservoir system tries to retain the water in the higher level at first reservoir (Ringlet). At a first glance, it seems there was an increase in power generation, but the system always faces danger of spilling water. In other words, the system’s safety sacrifices for producing more power generation, is not acceptable. The obtained results of Jor reservoir reveal that the total power generation in cascade system is less than that of the single Jor system (4737.24). Because in cascade hydropower system, Jor reservoir is considered as the second reservoir. As a result, it will be affected by the operation of the first reservoir system (Ringlet). Because Ringlet reservoir lost some of its water due to spilling that diverts it from the system. So, the output of Jor reservoir in cascade system is less than the output of Jor reservoir in single system. In summary, it can be concluded that the use of optimized operating policies would manage the system more efficiently in the single reservoir than in the multi-reservoir.
Conclusion
This research investigated the applicability of DHP for op-eration of hydropower reservoir system in both single and multi-reservoir system. Meanwhile, three models are built in Matlab and subsequently connected to GA (GA). A GA has been developed for derivation of optimal hedging policy in both cases of single and multi-reservoir hydro-power reservoir system. The objectives of these models are set to maximize the total power generation in horizon-tal period.The constructed models have been tested and evaluated in the Cameron Highland and Batang Padang in Malaysia, which comprise of two integrated reservoirs system (Ringlet and Jor). In accordance to the optimiza-tion results, the applicaoptimiza-tion of DHP as an operaoptimiza-tional pol-icy could improve the stability of the system and increase the power generation output up to 13% compared to the current policy. So, the application of this policy for exist-ing reservoir and new hydropower system for producexist-ing more clean energy is highly recommended. The results of optimization in single and multi-reservoir system demon-strate that the use of the optimized DHP would manage the system more efficiently in the single reservoir than in the multi-reservoir.
Acknowledgements
This study is part of the doctoral research which was done in Universiti Putra Malaysia (UPM).
Table 5. Comparison the number of non-power release days and total power generation (GWh) in single and multi-reservoir systems
Ringlet hydropower system Jor hydropower system
Single-reservoir Multi-reservoir Single-reservoir Multi-reservoir
Number of non-power release (days) 0 1519 0 0
Ethical issues
It is certified that all data collected during the study are presented in this manuscript and no data from the study has been or will be published separately.
Competing interests
The authors declare that they have no competing interests.
Authors’ contributions
All authors participated in the design of the study, per-formed the literature search and wrote the manuscript, data acquisition, analysis, and interpretation. All authors critically reviewed, refined, and approved the manuscript.
References
1. Bostan I, Gheorghe AV, Dulgheru V, Sobor I, Bostan V, Sochirean A. Kinetical Energy of River Running Water. In: Resilient Energy Systems: Renewables: Wind, Solar, Hydro. Dordrecht, Netherlands: Springer; 2013. p. 165-360. 2. Afzali R, Mousavi SJ, Ghaheri A. Reliability-based
simulation-optimization model for multireservoir hydropower systems operations: Khersan experience. Journal of Water Resources Planning and Management 2008; 134(1): 24-33.
3. Clark EJ. Impounding reservoirs. J Am Water Works Assoc 1956; 48(4): 349-54.
4. Bower BT, Hufschmidt MM, Reedy WW. Operating procedures: their role in the design of water-resource systems by simulation analyses. In: Maass A, Hufschmidt MM, Dorfman R, Thomas HA Jr, Marglin SA, Fair GM, eds. Design of water resource systems. Cambridge: Harvard University Press; 1962. p. 443-58.
5. Maass A, Hufschmidt MM, Dorfman R, Thomas HA, Marglin SA, Fair GM, et al. Design of Water-Resource systems. Cambridge: Harvard University Press; 1962. 6. Rittima A. Hedging policy for reservoir system operation: a
case study of Mun Bon and Lam Chae reservoirs. Kasetsart J (Nat Sci) 2009; 43(4): 833-42.
7. Chiamsathit C, Adeloye A, Soundharajan B. Genetic algorithms optimization of hedging rules for operation of the multi-purpose Ubonratana Reservoir in Thailand. Evolving Water Resources Systems: Understanding, Predicting and Managing Water–Society Interactions Proceedings of ICWRS2014; Bologna, Italy; June 2014. 8. You JY, Cai X. Hedging rule for reservoir operations: 1. A
theoretical analysis. Water Resources Research 2008; 44(1): W01415.
9. Garousi-Nejad I, Haddad OB, Aboutalebi M. Discussion of “investigating parameters of two-point hedging policy for operating a storage reservoir” by Sharad K. Jain (2014). ISH Journal of Hydraulic Engineering 2015; 21(3): 312-4. 10. Taghian M, Rosbjerg D, Haghighi A, Madsen H.
Optimization of conventional rule curves coupled with hedging rules for reservoir operation. Journal of Water
Resources Planning and Management 2014; 140(5): 693-8. 11. Guo X, Hu T, Wu C, Zhang T, Lv Y. Multi-objective
optimization of the proposed multi-reservoir operating policy using improved NSPSO. Water Resources Management 2013; 27(7): 2137-53.
12. Jain SK. Investigating parameters of two-point hedging policy for operating a storage reservoir. ISH Journal of Hydraulic Engineering 2013; 20(2): 133-41.
13. Srivastava D, Awchi TA. Storage-yield evaluation and operation of Mula Reservoir, India. Journal of Water Resources Planning and Management 2009; 135(6): 414-25. 14. Dariane AB, Karami F. Deriving hedging rules of multi-reservoir system by online evolving neural networks. Water Resources Management 2014; 28(11): 3651-65.
15. Adeloye A, Soundharajan BS, Ojha C, Remesan R. Effect of hedging-integrated Rule Curves on the Performance of the Pong reservoir (India) during scenario-neutral climate change perturbations. Water Resources Management 2016; 30(2): 445-70.
16. Tayebiyan A, Ali TA, Ghazali AH, Malek M. Optimization of exclusive release policies for hydropower reservoir operation by using genetic algorithm. Water Resources Management 2016: 30(3): 1203-16.
17. Zhang R, Zhou J, Zhang H, Liao X, Wang X. Optimal operation of large-scale cascaded hydropower systems in the upper reaches of the Yangtze River, China. Journal of Water Resources Planning and Management 2012; 140(4): 480-95.
18. Peng Y, Chu J, Peng A, Zhou H. Optimization operation model coupled with improving water-transfer rules and hedging rules for inter-basin water transfer-supply systems. Water Resources Management 2015; 29(10): 3787-806. 19. Zhao T, Cai X, Yang D. Effect of streamflow forecast
uncertainty on real-time reservoir operation. Adv Water Resour 2011; 34(4): 495-504.
20. Tospornsampan J, Kita I, Ishii M, Kitamura Y. Optimization of a multiple reservoir system operation using a combination of genetic algorithm and discrete differential dynamic programming: a case study in Mae Klong system, Thailand. Paddy and Water Environment 2005; 3(1): 29-38.
21. Hossain MS, El-Shafie A. Intelligent systems in optimizing reservoir operation policy: a review. Water Resources Management 2013; 27(9): 3387-407.
22. Fallah-Mehdipour E, Haddad OB, Mariño M. Real-time operation of reservoir system by genetic programming. Water Resources Management 2012; 26(14): 4091-103. 23. Neboh N, Adeyemo J, Enitan A, Olugbara O. A Review
on Applications of Evolutionary Algorithms to Reservoir Operation for Hydropower Production. International Journal of Environmental, Chemical, Ecological, Geological and Geophysical Engineering 2015; 9(9): 1115-21. 24. Neelakantan T, Sasireka K. Hydropower reservoir operation