Remote sensing and assessment of coral reef
coverage at Archipiélago Espíritu Santo National
Park, BCS
Ramos García Jacquelin Guadalupe
1, Petatan Ramírez David
2, Reyes
Boni-lla Hector
3, Luna Soria Hugo
4and Gonzáles López Irma
51Universidad Autónoma de Querétaro, Qro, México.
2Universidad Autónoma de Baja California Sur. Departamento de Biología Marina. La Paz, B.C.S., México.
3Universidad Autónoma de Baja California Sur. Departamento de Biología Marina. La Paz, B.C.S., México.
4Universidad Autónoma de Querétaro, Qro, México. 5Comisión Nacional de Áreas Naturales Protegidas.
[email protected], [email protected], [email protected], [email protected], [email protected]
Abstract.
The analysis of satellite images provides an alternative and complementary method for a better understanding of coral reef ecosystems profitably, with large-scale and near-real-time data. The present study focuses on the presence of coral reef at the Archipelago Espiritu Santo National Park, using high-resolution multispectral images (10 m2) from the Sentinel-2B satellite of the European Space Agency ESA. A Random Forest algo-rithm was applied to the reflectance bands to estimate bathymetry and classify the seabed in order to assess the coral reef coverage on the island. The results shown are suitable for bathymetry with a variance explained by R2 = 0.895, on the other hand, the classification of bottom type indicates a submerged area of 161.23 ha of coral reef coverage. Reef map-ping, beyond identifying its distribution, has the potential to quantify other parameters that may be important when monitoring these ecosystems.
Volume 13, 2019, Pages 56–61
Proceedings of the 1st International Con-ference on Geospatial Information Sciences
O. S. Siordia, J.L. Silv´an C´ardenas, A. Molina-Villegas, G. Hernandez, P. Lopez-Ramirez, R. Tapia-McClung,
K. Gonz´alez Zuccolotto and M. Chirinos Colunga (eds.), iGISc 2019 (Kalpa Publications in Computing, vol.
[3]. They are refuge, food and breeding areas for many species, some of theses of commercial interest and their aesthetic value promotes tourism generating significant economic gains [2]. Yet, these eco-systems are facing deterioration worldwide; by 2011, 19% of the reefs had already been lost and 75% were threatened [4]. The effects of natural disasters in combination with the ravages of anthropogenic influence are the main causes of decline and deterioration at regional and global scales.
Understanding the current status of coral reefs through effective monitoring is crucial for the better management of these ecosystems [5]. In this sense, the analysis of satellite images derived from remote sensors is essential for ecological studies of shallow habitats. This approach provides an alternative complementary and a cost effective method for a better understanding of reef ecosystems with large-scale and near-real-time data [6].
Reef mapping was dominated by multispectral instruments of high spatial resolution and moderate resolution such as Landsat 8 satellite [6,7]. The Sentinel-2 Satellite with its instruments A and B is the most recent contribution of the European Space Agency (ESA) in collaboration with the Copernicus program, it has an MSI Instrument (Multi Spectral Imager) and high resolution pixels (10 m) which offers a great opportunity for monitoring reef ecosystems [6].
The main objective of this study is to generate a supervised classification of the sea bottom type in order to assess the area of coral reef coverage, using geospatial information from the Sentinel-2B sat-ellite
2. Methods
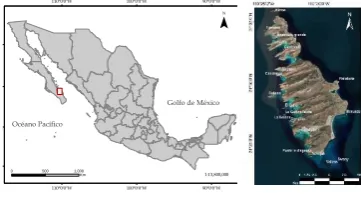
Archipiélago Espíritu Santo National Park (PNZMAES) is located in front of La Paz Bay, in South Baja California within the Gulf of California, with an area of 47,749 ha (CONANP, 2007) (Figure 1). It was d declared as Proteced Natural Area on May 10, 2007. The heterogeneity of habitats, such as mangrove ecosystems, coral reefs and rocky reefs create refuge and breeding areas with high ecological integrity. Its scenic beauty and climates make this area suitable for ecotourism, although vulnerable to human impact (CONANP, 2007). There are also other disturbances that can alter the natural character-istics and deterioration so theses ecosystems such as hurricanes and the presence of El Niño–Southern Oscillation modifying productivity and causing bleaching effects on coral coverage (Iglesias Prieto et al., 2003; CONANP, 2007).
90°0'0"W 90°0'0"W 100°0'0"W 100°0'0"W 110°0'0"W 110°0'0"W 30 °0'0" N 30 °0'0" N 25 °0'0" N 25 °0'0" N 20 °0'0" N 20 °0'0" N 15 °0'0" N 15 °0'0" N
¯
0 500 1,000
Km 1:13,800,000
Océano Pacífico
Golfo de México
Figure 1: Location of the study area (left) and loca-tion of the visited sites in the study area (right).
Satellital data was acquired from Sentinel-2B (https://scihub.copernicus.eu/dhus/#/home), sensed on April 2, 2018. A search was made for the selection of this image among sensed images that exposed a lower degree of cloudiness and close to the date when in situ data was taken.
Seven visits to Espiritu Santo Island were made during May 2018, covering a total of 20 sites. For the bathymetric data collection, the depth was constantly registered and georeferenced from the boat using a Garmin echoMAP 52dv echo sounder. The data necessary for bottom type classification was collected by 5 monitors through autonomous diving perpendicular to the coast line in transects of vari-able size depending on each site visited. The monitors were equipped with a Garmin Trex 10 GPS and every 10 meters the type of substrate on which they were found was registered and georeferenced, taking into account the following categories: algae, sand, gravel (dead coral pieces), coral and rock.
Atmospheric correction was performed to all bands automatically by using the DOS atmospheric correction method [10]. However, not all bands were required in our analysis, only 1,2,3,4 and 11 (deep blue, blue, green, red and SWIR) bands were considered.
To generate a modified normalized difference water index (MNDWI) [11] the following expression was applied to our bands
𝑀𝑁𝐷𝑊𝐼 =𝐺𝑟𝑒𝑒𝑛−𝑆𝑊𝐼𝑅
𝐺𝑟𝑒𝑒𝑛+𝑆𝑊𝐼𝑅 (1)
This index allows us to detect water bodies by combining these bands (1). Subsequently, a mask was created by applying a null value to the pixels corresponding to land surface and this mask was applied to bands 1, 2, 3 and 4.
To develop the bathymetric model of our study area, the reflectance values of the satellite bands (1-4) were extracted for each of the georeferenced bathymetric points. With these values, an array of 17,255 records consisting of 5 columns was created, the first column corresponds to the depth value recorded by the echo sounder and the remaining four columns correspond to the reflectance value of each band for each bathymetric point. This database was imported to Rstudio to generate the bathymet-ric model by supervised classification to our satellite bands (1-4) using the Random Forest algorithm trained with 90% of the data and using 300 trees.
To perform the water column correction, the reflectance values of substrate categories of each band were extracted and the sand values were filtered. The Sagawa methodology (2010), which is a modifi-cation of Lyzenga´s (1981) model, was applied to find the attenuation coefficient, necessary for water column correction to our bands [12, 13].
The reflectance values of each of our four corrected bands were extracted for the 1, 331 points re-ported from the substrate categories in the 20 visited sites and a data matrix was created. The Random Forest machine learning model was applied using 300 trees to develop supervised classification for bottom type. Once our classification model for bottom type was obtained, we calculated the area of coverage for each of the categories that make up the substrate present in Espiritu Santo Island.
3. Results
3.1 Atmospheric correction and mask generation
The spectral radiance of the atmospheric effects was corrected to recover the surface reflectance values and this correction allowed to eliminate noise due to cloudiness or other atmospheric conditions in bands 1, 2, 3, 4 and 11. The modified normalized difference water index (MNDWI) generated was used to construct a mask, which was applied to our visible bands and limit our analysis only to the seabed, discarding land surface.
Remote sensing and assessment of coral reef coverage at ... Ramos-Garcia, J. G. et al
of platform before 23m depth (Figure 2).
3.3 Reef coverage by supervised classification.
A total of 1,331 substrate points were reported in the 20 sites visited in study area. The greatest amount corresponds to La Dispensa, Las Navajas and Corralito, places where coral communities’ dispersion was greater, or their abundance. By contrast, El Pailebote, El Mesteño and the Gallo and Gallina islets had the least amount of points because the depth drops rapidly and this prevents the coral presence due to an exponential decrease in light incidence.
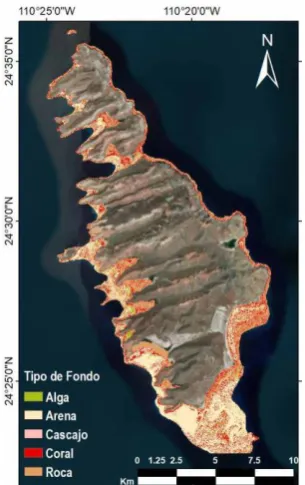
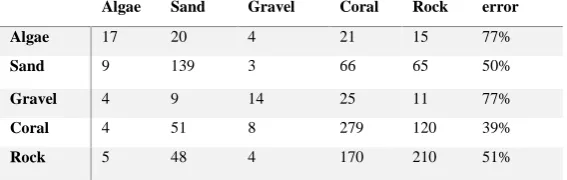
The sea bottom type model generated by supervised classification had an average error of 50.11%, coral surface was the best characterized with an error of 39%, while the classification of algae coverage has the highest error with 77 % (Table 1). The image obtained from the bottom type classification shows that the sand, rock and coral coverage are well represented substrates in the island (Figure 3).
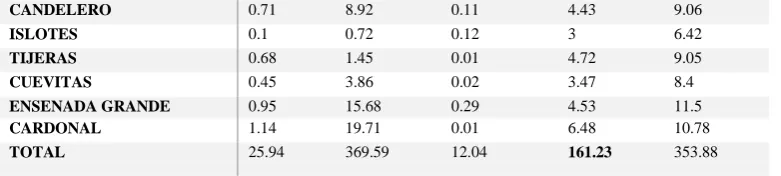
The pixel quantification allowed us to estimate the area corresponding to the coverage by type of substrate for each site, gravel and algae were the least dominant type of substrate (Figure 3) covering 12.04 and 25.94 hectares respectively (Table 2). Finally, based on the data generated, the estimate area
Figure 3: Satellite derived bathymetry for the PNZMAES.
Figure 2: Supervised classification of bottom type for the PNZMAES.
for the coral coverage throughout the PNZMAES is 161.23 hectares (Table II). San Gabriel Bay has the largest estimated area of coral cover with 29.9 hectares, which we can corroborate with the literature that describes this site as one of the few that counts as a true reef structure within the Gulf of California [14].
4. Conclusion
We conclude that satellite Sentinel-2 has the appropriate resolution to generate useful information rel-evant to management on coral reefs and offers advantages in terms of coverage and profitability. The bathymetric model has an adequate accuracy with explanatory variable of approximately 90% compared to the performance of similar analysis of satellites such as Landsat 8 [15]. We notice that for our bottom type classification, accuracy scarcely exceeds the 60% in our category of interest (coral coverage), which we can consider as acceptable since a high precision ranges between 80% and 100% accuracy [15]. In order to improve the accuracy of the results and avoid overestimating coral coverage in sites that have not been visited to verify, it is necessary to make a greater field effort to complement the analysis. This study was limited to coral coverage assessment; however further analysis can be per-formed to detect bleaching or other indicators necessary in monitoring programs.
SITE ALGAE SAND GRAVEL CORAL ROCK
NAVAJAS 0.14 21.36 0.1 4.18 2.05
MESTEÑO 0.3 2.42 0.25 2.66 5.79
PUNTA DISPENSA 0.08 7.6 0.02 3.69 6.52
LA GALLINA 0.12 1.39 0.02 1.2 2.4
CORRALITO 0.19 2.24 0.02 2.29 2.46
BAHÍA SAN GABRIEL 2 113.6 7.22 29.96 72.48
BALLENA 1.11 10.73 0.2 6.65 10.96
BONANZA 1.77 12.54 0.16 25.35 65.18
PAILEBOTE 0.31 1.09 0.04 7.64 15.61
ENSENADA DEL GALLO 9.13 36.17 2.99 17.38 77.82
ROCA SWANNY 2.15 59.68 0.04 7.54 2.35
VALIZAS 3.66 39.24 0.21 17.28 17.58
EL GALLO 0.82 9.76 0.17 6.66 12.43
GALLINA ISLOTE 0.13 1.47 0.04 2.12 5.04
Algae Sand Gravel Coral Rock error
Algae 17 20 4 21 15 77%
Sand 9 139 3 66 65 50%
Gravel 4 9 14 25 11 77%
Coral 4 51 8 279 120 39%
Rock 5 48 4 170 210 51%
Table 1: Matrix confusion for supervised classification.
Remote sensing and assessment of coral reef coverage at ... Ramos-Garcia, J. G. et al
TOTAL 25.94 369.59 12.04 161.23 353.88
Table 2: Coverage value of bottom substrate in each visited site. Area in (Ha)
References
1. Veron, J. E. N., & Stafford-Smith, M. (2000). Corals of the World. Sea Frontiers (Vol. 30). Australian Insti-tute of Marine Science.2. Calderón-Aguilera, Luis E; Reyes-Bonilla, Héctor; Mozqueda-Torres, M. C., & Ca-rriquiry, J. D. (2014). Presupuesto de carbono en arrecifes coralinos de México., 39(September), 645–650. 3. Moberg, F., & Folke, C. (1999). Ecological goods and services of coral reef ecosystems, 29, 215–233. 4. Burke, L., Reytar, K., Spalding, M., & Perry, A. (2011). Reefs at Risk Revisited. Defenders (Vol. 74). 5. Hedley, J. D., Roelfsema, C. M., Chollett, I., Harborne, A. R., Heron, S. F., Weeks, S. J., Mumby, P. J. (2016).
Remote sensing of coral reefs for monitoring and management: A review. Remote Sensing, 8(2)
6. Hedley, J. D., Roelfsema, C., Brando, V., Giardino, C., Kutser, T., Phinn, S., … Koetz, B. (2018). Remote Sensing of Environment Coral reef applications of Sentinel-2 : Coverage , characteristics , bathymetry and benthic mapping with comparison to Landsat 8. Remote Sensing of Environment, 216(October 2017), 598– 614.
7. Smith, V. E., Rogers, R. H., & Reed, L. E. (1975). Automated Mapping and Inventory of Great Barrier Reef Zonation With Landsat Data. OCEAN 75 Conference.
8. CONANP (Comisión Nacional de Áreas Naturales Protegidas), 2007. Programa demanejo del Parque Nacio-nal exclusivamente la zona marina del Archipiélago de Espíritu Santo. Conanp-Semarnat, México, D.F. 226 p
9. Iglesias Prieto, Roberto; Reyes Bonilla, Héctor; Riosmena Rodríguez, RafaelEffects of 1997-1998 ENSO on coral reef communities in the Gulf of California Mexico Geofísica Internacional, vol. 42, núm. 3, july-sep-tember, 2003, pp. 467-471 Universidad Nacional Autónoma de México Distrito Federal, México.
10. Chavez Jr, P. S. (1988). An improved dark-object subtraction technique for atmospheric scattering correc-tion of multispectral data. Remote Sensing of Environment, 24(3), 459–479
11. Xu, H. (2006). Modification of Normalized Difference Water Index (NDWI) to Enhance Open Water Fea-tures in Remotely Sensed Imagery. International Journal of Remote Sensing, 27, 3025–3033.
12. Sagawa, T. et al. (2010). Using bottom surface reflectance to map coastal marine areas: A new application method for Lyzenga’ s model. International Journal of Remote Sensing.
13. Lyzenga, D. R. (1981). Remote sensing of bottom reflectance and water attenuation parameters in shallow water using aircraft and Landsat data. International Journal of Remote Sensing, 2(1), 71–82.
14. Reyes-Bonilla, H., & Lopéz-Perez, A. (2009). Corals and Coral-reef Communities in the Gulf of California. In Atlas of Coastal Ecosystems in the Western Gulf of California (p. 189).
15. Hedley, J., Roelfsema, C., Koetz, B., & Phinn, S. (2012). Remote Sensing of Environment Capability of the Sentinel 2 mission for tropical coral reef mapping and coral bleaching detection. Remote Sensing of Environ-ment, 120, 145–155.