A b s t r a c t. This paper presents a study of the effect of soil surface colouring, using natural colour made of walnut shale, on soil temperature increase. Bulk density, soil texture and volumetric moisture content were determined. Daily temperature was control-led every two hours at soil depths of 5, 10, 20 and 30 cm during five consecutive days by a laser thermometer. The results showed that colouring of the soil surface and its darkening leads to an increase in solar radiation absorption and subsequently soil surface tempe-rature, which, in return, results in 5°C rises in average of daily tem-perature and 15.78 W m-2in average of the soil heat flux at 5 cm depths, as well as an increase in soil heat storage, comparing to the index plots (uncoloured soil).
K e y w o r d s: soil surface, darkening soil temperature, germi-nation, plant growth
INTRODUCTION
The daily variation in soil temperature depends on the amount of solar radiation penetrating into the earth. Soil colour is influential on soil heat supply which causes daily variation in soil surface temperature and the considerable rise in soil’s input heat flux by its effect on the albedo and the daily changes of net radiation (Heusinkveldet al., 2004). Soil heat flux plays an important role in surface energy ba-lance at the land-atmosphere interface, and in meteorolo-gical modelling. On a well-watered and full-vegetation-covered surface, the soil heat flux is of the same order as the sensible heat flux.
In normal conditions, farmers try to alter soil heat balan-ce by drainage, mulching and adding organic fertilizers in order to prevent reflection of heat from soil, to preserve heat and to provide appropriate temperature for seed germination (Mayocchi and Bristow, 1995). Inadequate temperature de-lays germination, which results in retarded maturity and
re-duces the quality and quantity of the product. The number of days required for a seed to germinate is of importance to the farmer and differs according to the plant type and soil tempe-rature (Kaspar and Bland, 1992). In cold and moderated cli-mates, soil temperature constrains the potential to produce products and natural cover, due to limited chemical and bio-logical reactions. The performance of some small vegeta-bles and fruits can be extremely enhanced by heating the soil (Wondafrashet al., 2005; Zhanget al., 2007). The results of research on the influence of the form of soil surface with homogeneous particles on absorbing solar radiation heat (furrow irrigation) suggest that soil hills becomes 10°C warm-er than soil furrow because of its vastwarm-er surface area ab-sorbing radiated heat energy. The dark soil absorbed more energy and became warmer, while the bright soil reflected the energy and remained cold (Kustaset al., 2005).
The aim of this study was to determine the influence of soil surface colouring, using natural colour made of walnut shale, on soil temperature rise.
MATERIAL AND METHOD
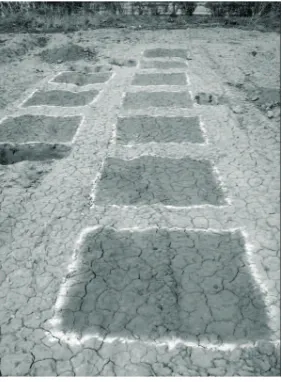
The experiments were carried out on four plots with di-mensions of 100×100 cm, with 40 cm distance from each other, in four replicates and in different geographical di-rections as shown in Fig. 1. This experiment was conducted at the College of Abureihan, University of Tehran, Pak-dasht, Iran in March 2009. Bulk density was determined using volumetric methods and mechanical analysis was performed by adopting hydrometry methods (McInnes, 2002). The volumetric moisture content was measured at 5, 10, 20 and 30 cm of soil depth by using the Time Domain Reflecto-metry (TDR, EA514-160, England) technique. The plots
New method for soil surface darkening for increasing soil temperature
B. Azadegan
1and J. Massah
2*
1Department of Irrigation and Draining Engineering,2Department of Agrotechnology, College of Abouraihan, University of Tehran, Tehran, Iran
Received May 12, 2010; accepted October 25, 2010
© 2011 Institute of Agrophysics, Polish Academy of Sciences *Corresponding author’s e-mail: [email protected]
A A
Agggrrroooppphhyhyysssiiicccsss
surfaces were completely sprayed with black colour which was obtained naturally from walnut shale (free of chemicals and pollutants), but the surface of the index plots remained uncoloured, so that the temperature change in the coloured plots could be compared. The intensity of soil darkness was determined by means of a colour analysis apparatus (Perkin Elmer, Lambda 25, USA). A profile of 30 cm depth was excavated around each plot in different geographical loca-tions in order to analyse the effect of the change in sunlight direction during the day. Soil temperature was measured by a laser thermometer (Testo, 830-T2, Germany). In order to examine the change in soil surface temperature and its effect on the variation of soil depth temperature, the soil tempe-rature measurements were taken every 2 h at depths of 5, 10, 20 and 30 cm during the days. Temperature measurements began at 6:00 till 24.00 and continued for 5 consecutive days. The results contributed to the study of the variation in daily temperature (average, minimum, maximum) and the soil heat flux calculated at any depth and time in each plot. The traditional sinusoidal analytical methods of Wang and Bras (1999) for estimating soil heat flux from a single-layer soil temperature time series measurement are described in the following sections. The one-dimensional heat diffusion equation for heat transport in the soil can be written as:
r 
¶ 
¶ s sc
T t
G z
= , (1a)
where:tis time,zis the depth below the surface,Tis the soil temperature,G(W m-2) is the soil heat flux,ñs(kg m-3) is the
soil density, andcs(J kg-1K-1) is the soil specific heat, while ñscs(J m-3K-1) represents the volumetric heat capacity.
Combining Eq. (1a) and the Fourier law for heat transport:
G kdT
dz
=- , (1b)
gives:
r 
¶ ¶ 
¶ ¶ s sc
T
t z k
T t
= æ
è
ç ö
ø
÷, (2)
where:k(W m-1K-1) is the thermal conductivity. Assuming the soil properties are uniform over the entire soil profile and the soil surface temperature varies sinusoidally (Carslaw and Jaeger, 1986), the analytical solution of Eq. (2) for cal-culating the soil temperature at any depth and time is:
T z t( , )=Tave+A( )exp(0 -z D/ )sin[ (w t-t0)-z D/ ],(3)
where:Tave(°C) is the average surface temperature over a
cy-cle,A(0) (°C) is the amplitude of the soil temperature flu-ctuations, and t0(s) is the phase shift. In Eq. 3,ù(s-1) and D(m) are the angular frequency and damping depth, respec-tively, defined as:
w p
t w
=2 ;D= 2D0, (4)
where:ô is the period of the temperature fluctuations and D0=k/(ñscs)(m2s-1) is the thermal diffusivity. Considering
Eq. (1b), and differentiating Eq. (3) with respect to z, the analytical solution for soil heat flux at any depth and time is:
G z t A k
D
z
D t t
z D
( , )= ( ) expæ- sin ( ) .
è
ç ö
ø
÷ éëê - - + ùûú
2 0
4
0
w p (5)
Applying Eq. (5) and setz= 0, the surface soil heat flux can be computed as:
[
]
G t
A k t t
D
( , )
( ) sin ( )
. 0
2 0
4
0 =
- +
é ë
ê w pùûú
(6)
Equation 5 indicates that soil heat flux also varies sinu-soidally with time and its mean equals zero, which implies that the total soil heat flux received from the sun during day-time is released from the deeper soil back to the atmosphere during the night. When applying this analytical solution for estimating soil heat flux, only one single-layer time series data of soil temperature is needed. The beauty of this analy-tical solution is that once the amplitude of the temperature fluctuations is determined from any depth of the soil tempe-rature measurement, the soil heat flux at any depth can be 6
4 7
5 9
3 8
2 10
1 1
readily calculated by Eq. (5). The average values were compa-red using Duncan’s multiple range test and the diagrams were prepared and conclusions were drawn after data analysis.
RESULTS AND DISCUSSION
According to the soil analysis results, soil texture is clay-loam with 30% clay, 35% silt and 35% sand. Bulk density is 1 250 to 1 400 (kg m-3) and the measured volume-tric soil moistureqvwas between 10 and 30%. The
volume-tric heat capacityñscsis 4.37 10-6(J.m-3K-1), the thermal
conductivitykis 4.37 10-3(W m-1K-1), the thermal diffu-sivityD0is 5.81 10-7(m2s-1) andtis time (5 days).
The level of soil darkness was evaluated by a colour analysis apparatus. The results are presented in Fig. 2. The coloured and uncoloured (index) plots, as well as trenches, are shown in Fig. 3.
Figure 4a illustrates daily variation in temperature with respect to time in coloured and index plots (at 0 to 5 cm depths). The soil temperature in coloured plots was 5 and 33°C at 6:00 and 14:00 h, respectively, while the tempera-tures of index plots were 3 and 25°C at the same time, which indicates 2 to 8°C temperature rise. As dark surface of soil ab-sorbs more solar radiation, the average difference of daily temperature was 5°C more than the index plots. The daily varia-tion of soil temperature depends on the amount of radiavaria-tion penetrating into the earth. The maximum solar radiation is at solar noon (12 h), while the maximum temperature at 5 cm depths occurs at about 14:00 h. But as the time approaches the sunset, the temperature difference is reduced.
Figure 4b shows the diagram of variations in daily tempe-rature in coloured and index plots (at 5 to 10 cm depths). At times of 6:00 and 16:00 h, the soil temperature in coloured plots was 5 and 27°C, respectively, but the temperature in the index plots was recorded as 3 and 21°C at the same time, which suggests a 2 to 6°C temperature rise. Here, the average difference of daily temperature is 4°C more than the same parameter values for the index plots. The maximum solar ra-diation is at solar noon (12 h), while the maximum tempe-rature at 10 cm depths occurs at about 16:00 h. Because a tem-perature gradient must develop before heat begins to flow to lower depths there is a time lag before the maximum tempe-rature occurs at the lower depths. In plots with coloured soil the temperature increase occurred later and to a lesser degree at 10 cm soil depths. However, the temperature difference would decrease at night. At this depth, volumetric soil mois-ture was 5% more than in the layer above. Soil water content is also a major determinant of soil heat loss through its in-fluence on thermal conductivity, heat capacity and heat diffusion (Wraith and Ferguson, 1994). Soil colour affects its water content, and is one of the main factors in soil heat storage (Tysonet al., 2007). Soil colour exerts its influence through its effect on albedo which, in turn, affects the net radiation (Wondafrashet al., 2005). Daily variation in net radiation causes the daily change in soil surface temperature (Mayocchi and Bristow, 1995). Whenever soil is exposed to solar radiation, a portion of the heat is absorbed by the sur-face layer and gradually transmitted to the layers below.
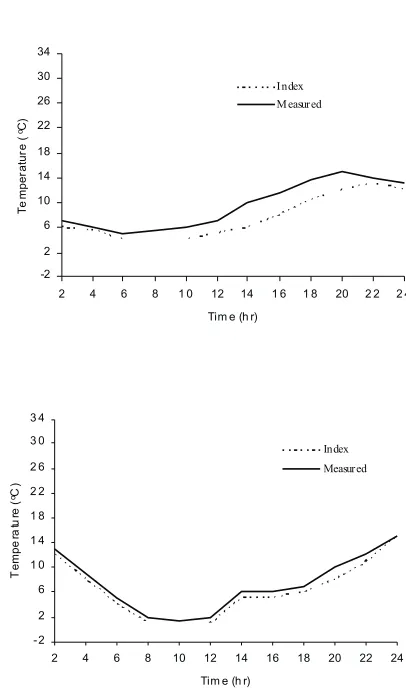
A diagram of the daily temperature variations in the co-loured and index plots (at 10 to 20 cm depths) is depicted in Fig. 5a. At 6:00 and 20:00 h, the soil temperature in the coloured plots was 5 and 15°C, respectively, while 5 and 12°C in the index plots, which shows 0 to 3°C increases in temperature. In this case, the average difference of daily temperature equals 1.5°C compared to the index plots. The maximum solar radiation is at solar noon (12 h), while the maximum temperature at 20 cm depth occurs at about 20:00 h. As a temperature gradient should develop before heat begins to flow to lower depths there is a time lag before the soil rea-ches its maximum temperature at the lower depths and hence the soil at 20 cm depth will be warmed less and later. This
Fig. 2. Colour darkness diagrams drawn by colour analysis apparatus.
temperature difference also becomes the least at night. Soil temperature varies with respect to time and soil depth. At this depth, volumetric soil moisture was 10% more than in the surface layer. The speed of heat transmission within the soil is a function of its water content. The temperature varia-tion among different soil layers exerts a major impact on wa-ter flow and transmission within the soil (Prunty and Bell, 2005; Stefanet al., 2005 ). The plants in moderate climate are also vulnerable to risk of cold weather, each year. Soil temperature indirectly affects the root growth and its meta-bolism. Low temperature in soil slows down the microbial activities, respiration and the decomposition of organic matter, which reduces the root water absorption.
Figure 5b shows the variations in daily temperature ver-sus time in coloured and index plots (at 20 to 30 cm depths). The soil temperature in the coloured plots was 5 and 15°C, at 6:00 and 24:00 h, respectively, yet the corresponding tempe-rature in the index plots was 4 and 15°C, which indicates 1°C rise in temperature in the coloured plots. In this case, the dif-ference in daily temperature is 0.5°C, compared to the index plots. The maximum solar radiation is at solar noon (12 h),
while the maximum temperature at 30 cm depths occurs at about 24:00 h, which is due to the time required for the maxi-mum long wave radiation to penetrate to this depth, but much lesser than previous layers in comparison to the co-loured plots. Therefore, the soil at 30 cm depth heats very late and to much lesser degree and this temperature difference becomes negligible at night. At this depth, volumetric soil moisture is 20% more than in the surface layer. The soil tem-perature influences the water content in the ground, accele-rating or delaying evaporation. The temperature of soil lay-ers, being the effect of the surface heat budget, varies on the annual and daily time scale. Temperature extremes in lower layers of the soil occur later than the extremes at the surface, according to the third Fourier’s law of thermal conduction. It was determined empirically that at the depths of 5, 10, 20 and 30 cm the delay amounts to 1, 2, 4 and to about 8 h, re-spectively. Values of the maximal temperatures diminish with the depth, while the minimal values are higher in deeper layers. This influences the daily amplitudes which reduce along with the depth of the layers (second Fourier’s law). (Hu and Fengs, 2003; Ochsneret al., 2006).
-2 2 6 10 14 18 22 26 30 34
2 4 6 8 10 12 14 16 18 20 22 24
Time (hr)
T
e
m
p
e
ra
tu
re
(
oC
)
I nd ex
Me asur ed
Fig. 4.Variation in plots daily temperature versus time for: a – 0-5, b – 5-10 cm depths.
Fig. 5. Diagram of the variation in plots soil daily temperature versus time at: a – 10 to 20, b – 20 to 30 cm depths.
a
-2 2 6 10 14 18 22 26 30 34
2 4 6 8 1 0 12 14 1 6 1 8 20 2 2 2 4
Tim e (h r)
T
e
m
p
e
ra
tu
re
(
oC
)
I n dex
M easur ed a
- 2 2 6 1 0 1 4 1 8 2 2 2 6 3 0 3 4
2 4 6 8 10 12 14 16 18 20 22 24
Tim e (h r)
T
e
m
p
e
ra
tu
re
(
oC
)
In dex
Measur ed b
-2 2 6 10 14 18 22 26 30 34
2 4 6 8 10 1 2 1 4 16 1 8 20 22 2 4
T ime (hr )
T
e
m
p
e
ra
tu
re
(
oC
)
I n dex
Table 1 presents the values of the soil bulk density (kg m-3), volumetric moisture content (%), average daily temperature Tave (°C), variation of average temperature ÄT (°C) and variation of average soil heat fluxÄG(W m-2) according to the depth in the coloured and index plots. The soil heat flux at different depths for each plot and average values were estimated using Eq. (5) and the traditional sinusoidal analy-tical methods of Wang and Bras (1999). The soil temperatu-re is a measutemperatu-re of the amount of heat absorbed by the ground, mainly from the solar radiation. The variations of average values of the soil heat flux from the surface to the depth at 5, 10, 20 and 30 cm in the coloured plots are 15.78, 7.87, 3.93 and 2.62 W m-2more than in the index plots, respectively. The darkness of the surface of coloured plots resulted in greater solar radiation absorption and, consequently, increa-sed in soil heat storage. The primary source of this energy is solar radiation and the rate of the energy exchange between the air and earth strongly depends on the amount of heat absorbed by the earth surface. The heat absorbed by the earth surface is partly transferred to the air and partly conducted into the deeper soil layers. The soil temperature, being of great significance for the growth and productivity of crops, is often analysed in agricultural studies.
CONCLUSIONS
1. The comparison of daily average temperatures in coloured plots and index plots shows that the average values of daily soil temperature were higher by 5, 4, 1.5 and 0.5°C at depths 0 - 5, 5 - 10, 10 - 20 and 20 - 30 cm, respectively, in the coloured plots than in the index plots, because dark surface of soil (coloured plots) absorbs more solar radiation.
2. The variations in the average soil heat flux from the surface to the depth of 5, 10, 20 and 30 cm in the coloured plots were higher by 15.78, 7.87, 3.93 and 2.62 W m-2than in the index plots, respectively. The darkness of the surface of the coloured plots resulted in greater solar radiation ab-sorption and, consequently, increased soil heat storage.
3. Therefore, the use of a natural colour to darken soil sur-face affects temperature rise and heat storage in soil. Soil heat flux plays an important role in surface energy balance at the land-atmosphere interface and in meteorological model-ling. This also facilitates those physical and chemical proces-ses that require heat energy for the optimum growth of plants.
REFERENCES
Carslaw H.S. and Jaeger J.C., 1986. Conduction of Heat in Solids. Oxford Univ. Press, Oxford, UK.
Heusinkveld B.G., Jacobs A.F.G., Holtslag A.A.M., and Berkowicz S.M., 2004.Surface energy balance closure in an arid region: Role of soil heat flux. Agric. For. Meteorol., 122, 21-37. Hu Q. and Feng S., 2003.A daily soil temperature dataset and soil
temperature climatology of the contiguous United States. J. Appl. Meteorol., 42, 1139-1156.
Kaspar T.C. and Bland W.L., 1992.Soil temperature and root growth. Soil Sci., 154, 290-299.
Kustas W.P., Li F., Prueger J.H., Neale C.M., and Jackson T.J., 2005. Utility of remote sensing based two-source energy balance model under low and high vegetation cover condi-tions. Hydrometeorol. J., 6, 878-891.
Mayocchi C.L. and Bristow K.L., 1995.Soil surface heat flux: Some general questions and comments on measurements. Agric. For. Meteorol., 75, 43-50.
McInnes K.J., 2002.Soil heat: Temperature. In: Methods of Soil Analysis. Part 4. Physical methods (Eds J.H. Dane and G.C. Topp). SSSA Press, Madison, WI, USA.
Ochsner T.E., Sauer T.J., and Horton R., 2006.Field tests of the soil heat flux plate method and some alternatives. Agron. J., 98, 1005-1014.
Prunty L. and Bell J., 2005.Soil temperature change over time during infiltration. Soil Sci. Soc. Am. J., 69, 766-775. Stefan J., Kollet I.C., Schüttemeyer D., Maxwell R.M., Moene
A.F., and Bayer P., 2009.The influence of rain sensible heat and subsurface energy transport on the energy balance at the land surface.Vadose Zone J., 8, 846-857.
Tyson E., Ochsner T.J., Sauer T.E., and Horton R., 2007.Soil heat storage measurements in energy balance studies. Agron. J., 99, 311-319.
Wang J. and Bras R.L., 1999.Ground heat flux estimated from surface soil temperature. J. Hydrol., 216, 214-226. Wondafrash T.T., Mariscal S.I., and Serrano R.E., 2005.
Relationship between soil color and temperature in the surface horizon of mediterranean soils. Soil Sci., 170(7), 495-503.
Wraith J.M. and Ferguson A.H., 1994.Soil temperature limita-tion to water use by field grown winter wheat. Agron. J., 86, 974-979.
Zhang H.F., Ge X.S., Ye H., and Jiao D.S., 2007. Heat con-duction and heat storage characteristics of soils. Appl. Thermal Eng., 27, 369-373.
Depth (cm) qv(%) rb(kg m-3)
Tave(°C)
Index plots Coloured plots DT(°C) DG(W m-2)
0-5 10 1 400 8.60 13.60 5.0 15.78
5-10 15 1 350 7.60 11.60 4.0 7.87
10-20 20 1 300 7.40 8.90 1.5 3.93
20-30 30 1 250 6.10 6.60 0.5 2.62