A b s t r a c t. In this paper, an accurate image processing algorithm for determination of volume and surface area of orange is developed. The proposed machine vision system consists of two CCD cameras, an appropriate lighting system and a personal com-puter. The cameras are placed at right angle to each other in order to give two perpendicular views of the image of the orange. Initially, the algorithm segments the background and divides the image into a number of frustums of right elliptical cone. The volume and sur-face area of each frustum are then computed by the segmentation method. The total volume and surface area of the orange is approxi-mated as the sum of all elementary frustums. The difference bet-ween the computed volumes and surface areas obtained by the ima-ge processing method and measured by water displacement and tape method, respectively, are not statistically significant at the 5% level. The Bland-Altman results show that the orange size has no effect on the accuracy of estimated volume and surface area found by the image processing technique. The regression formula, M=0.68VIP+44.6, between the computed volume and the measured mass of oranges is found to be highly correlated with R2=0.93.
K e y w o r d s: orange, volume, surface area, mass, image processing, segmentation method
INTRODUCTION
Physical attributes of fresh produce, such as density, mass, surface area and volume, have often been used to calculate water loss, heat transfer, quantity of pesticide ap-plications, respiration rates, evaluation of fruit growth and quality, ripeness index to forecast optimum harvest time, grading and so on (Hahn and Sanchez, 2000; Leeet al., 2006; Lorestani and Tabatabaeefar, 2006; Topuzet al., 2005;Wilhelm et al., 2005). Among all these attributes, surface area is one
of the most important factors in all these application fields. Research work has been done to determine the relationship between surface area and more easily measured attributes such as mass, volume and 2-D measures (Forbes and Tatters-field, 1999; Hahn and Sanchez, 2000; Lee et al., 2006; Sabliovet al., 2002; Wang and Nguang, 2007).
In recent years, the search to find rapid and non-destruc-tive techniques for measurement of these physical attributes for size sorting, quality grading etc have attracted many researches. Different mathematical models and numerical methods have been applied to extract a representation of sur-face area and volume. Machine vision and image processing techniques have been found increasingly useful in the fruit industry, especially for applications in quality inspection and shape sorting. Researches in this area indicate the feasibility of using such systems to improve product quality while freeing people from the traditional hand sorting of agricultural materials. Currently, machine vision is the most effective tool for external feature measurements such as colour intensity, colour homogeneity, bruises, size, shape and stem identification (Forbes and Tattersfield, 1999; Jafari et al., 2006; Leeet al., 1999; Lorestaniet al., 2006; Sabliovet al., 2002). The use of machine vision is gaining interest for determination of physical attributes of fruits and irregular-shaped objects, because it is a non-destructive method re-quiring image analyses and image processing operations. Forbes and Tattersfield (1999) developed a combined ma-chine vision and artificial neural network technique for the estimation of pear volume from 2-D digital images. The RMS percentage error using a single digital image was 3%. This error was reduced to 1.9% when the volume was esti-mated from sets of four images. Lorestaniet al. (2006) deve-loped a fuzzy logic based algorithm for sorting of Golden delicious apples. Features such as colour and size were mea-sured through a data acquisition system consisted of apples sorter, illumination chamber, webcam and a PC. Grading results obtained in this manner showed 91.2 and 95.2% agreements for off-line and online cases, respectively, with that of human expert. Hahn and Sanchez (2000) developed an imaging algorithm to measure the volume of non-circular
Determination of orange volume and surface area using image processing technique
M. Khojastehnazhand, M. Omid* and A. Tabatabaeefar
Department of Agricultural Machinery, Faculty of Biosystems Engineering, University of Tehran, Karaj, Iran Received August 8, 2008; accepted October 10, 2008
© 2009 Institute of Agrophysics, Polish Academy of Sciences *Corresponding author’s e-mail: [email protected]
A A
Agggrrroooppphhyhyysssiiicccsss
shaped agricultural produce such as carrots. Both Sabliovet al. (2002) and Wang and Nguang (2007) used image-processing techniques to compute the volume and surface area of axi-symmetric agricultural products. Baileyet al. (2004) demonstrated an image processing approach which estimated the mass of agricultural products rapidly and ac-curately. Koc (2007) determined the volume of watermelon using ellipsoid approximation and image processing. He compared the results with water displacement method to determine overall system accuracy.
The objective of this study was to develop an efficient algorithm for accurate computation of volume and surface area of oranges based on machine vision.
MATERIALS AND METHODS
A total of fifty randomly selected oranges of various sizes were purchased from a local market. The mass of each orange was measured by a digital balance, with an accuracy of ±
0.01 g.
The minimum and maximum masses were 136 and 237 g, respectively (Table 1). In order to determine the volume and surface area of oranges a machine vision system was designed, developed and tested. The design of this system was divided into the following sequential stages: image acquisition, image processing, volume and surface area computation with image processing method and system validation.Samples M
(g)
VWDM VIP STM SIP
Samples M
(g)
VWDM VIP STM SIP
(cm3) (cm2) (cm3) (cm2)
1 184.7 206.4 208.7 150.65 153.17 26 182.7 204.9 204.8 152.48 145.38
2 183.4 202.0 202.4 147.4 144.93 27 169.8 184.0 180.4 139.10 137.29
3 170.7 194.6 192.2 142.92 144.02 28 177.5 191.6 187.7 140.12 142.13
4 157.3 175.0 169.8 137.07 132.34 29 213.2 234.9 234.7 160.17 163.14
5 195.3 249.0 251.6 170.53 171.70 30 167.2 183.3 183.0 140.15 138.43
6 180.4 201.9 200.2 145.49 142.99 31 191.6 218.4 220.9 156.37 154.76
7 169.8 189.3 187.4 141.53 148.38 32 170.6 185.2 183.4 137.19 142.71
8 148.6 174.9 169.5 131.1 126.31 33 188.5 205.2 213.4 145.2 150.92
9 151.5 165.4 159.9 128.66 123.46 34 197.5 225.3 227.9 157.83 160.83
10 139.0 146.8 141.3 120.11 115.87 35 176.7 189.9 185.6 140.94 140.60
11 136.0 135.6 137.3 115.58 113.26 36 184.0 197.2 193.5 144.98 143.41
12 154.6 163.8 168.5 127.82 128.03 37 168.5 186.2 183.1 140.26 140.22
13 171.0 182.6 185.0 135.57 140.36 38 173.8 184.1 182.9 139.02 134.49
14 237.0 268.0 272.4 178.18 179.03 39 174.8 190.1 185.9 142.90 143.84
15 157.0 164.1 167.4 127.57 129.27 40 199.9 234.6 239.2 163.07 166.41
16 197.2 224.2 222.1 157.26 158.29 41 178.9 196.6 196.8 148.95 144.30
17 184.8 204.6 202.4 149.55 149.14 42 181.5 202.7 207.8 149.03 145.33
18 194.0 223.6 226.6 156.49 155.33 43 178.2 194.0 193.2 142.17 144.26
19 190.6 200.2 201.4 145.02 145.48 44 166.6 184.0 187.9 137.59 136.83
20 166.0 174.2 173.7 133.22 135.01 45 182.7 188.1 185.0 135.85 137.97
21 186.0 202.3 207.3 150.71 153.99 46 223.7 249.7 252.8 167.40 175.23
22 165.0 173.2 174.1 133.45 130.51 47 166.3 176.5 173.7 136.51 131.20
23 188.0 204.0 209.2 145.25 153.68 48 163.4 178.9 180.3 136.17 135.87
24 186.5 200.9 201.3 143.50 147.51 49 172.8 182.3 187.3 137.59 129.49
25 224.6 257.4 259.0 177.97 174.47 50 172.1 180.7 178.2 138.51 135.03
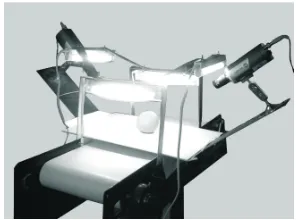
The proposed system consists of two CCD cameras (PROLINE UK, Model 565s with 510 by 492 pixel resolu-tion), two capture cards (WinFast DV2000 with a resolution 320Hx240V), an appropriate lighting system and a personal computer (PC) (Fig. 1). The cameras had a CS lens mount, a focal length of 3.5-8 mm, 510x492 pixel resolutions, and provided a resolution of 480 vertical TV lines. The cameras were mounted about 25 cm above the belt and powered by a 24V power supply.
To provide uniform lighting, four fluorescent tubes, pla-ced above the conveyor, were used. The position of the lighting tubes was adjusted to provide uniform, well illumi-nated and shadow-free images of fruit. The light source and cameras were mounted on a frame and were attached to the measurement table. A white cardboard was used as back-ground surface to facilitate and simplify the segmentation task. Signals from orange samples were captured by the camera, transferred to the PC through the video capture card, digitised, and stored on the PC inRGB(red, green, blue) co-lour space. A program was developed to capture and record the surface images of the orange. Algorithms were im-plemented using Visual Basic 6.0 programming language.
The image processing aspect of this study comprises
three steps:backgroundsegmentation, image enhancements and dimensional calibration. In order to remove the ground from fruit images, firstly an image from the back-ground is captured. By determination ofR,G, andBvalues for all pixels of background, standard deviation of the images are then calculated and stored in the database. Once the image of the fruit is captured, theRGBvalue of any pixel in the image can be computed by Eq. (1):
P X Y( , )=B216+G28+R. (1)
TheRGBvalues in the fruit image are then compared with that of the stored information on the background image available in the database. If the difference between the two RGB values is less than 3ó, then it is regarded as the background, else it is fruit:
If |PB- PF|£3ó, then Pixel = Background, (2)
where: PBis theRGBvalue of background image pixel, PFis
the RGB value of fruit image pixel and ó is the standard
deviation of background image. This method of background segmentation produces slight shadows underneath of the fruit image. To correct for this overestimation we used infor-mation about the shadow histogram, by determining upper and lower threshold limits. This simple technique worked satisfactorily for orange as well as other citrus fruits tested.
The number of pixels in the foreground (fruit) has to be scaled in order to convert (map) the total number of pixels into a real area/volume value. The constants Csa(scale factor of surface area) and Cvol(scale factor of volume) of Csa=0.487 10-2and Cvol=0.295 10-3were obtained after rationing the real and measured area/volume of a perfect sphere, respec-tively. The Csaand Cvolare eventually used to convert units of measurement from pixels to cm2and cm3, respectively.
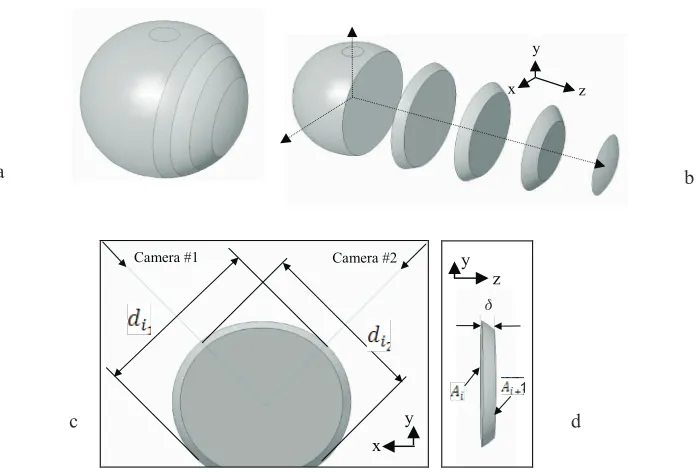
The volume and surface area of a conical frustum can be calculated using equations that are commonly found in mathematics handbooks (Szirtes, 2006). Consider the 3-D representation of the orange (Fig. 2). Conceptually, we di-vide the image of the fruit into a number of frustums of right cylindrical cone (Fig. 2b). These elementary cylindrical ob-jects are assumed to be of equal pixel height,d, as shown in Fig. 2d. The volume of the orange may then be estimated by summing the elementary volumes of individual cylinders. The required dimensional attributes are the top and bottom diameters and the height of the frustum as shown in Fig. 2c, d.
The cross-sectional areas through the elliptical frustum (Ai andAi+1in Fig. 2d) can be calculated using the two perpendicular diameters (Fig. 2c) obtained by the cameras. These surfaces are assumed ellipsoidal to increase the system accuracy. To be axi-symmetric in this context, all the cross-sections on the x–y plane should be elliptical. The area ofAi is given by (i= 1, 2,…, n):
Ai= pd di1 i2
4 , (3)
where:di1anddi2are the two perpendicular diameters of surface (Fig. 2c). The accuracy of estimatedAidepends on
the position of minimum and maximum diameters of the orange surface. The volume of each frustum,Vi, (i= 1, 2, …,n)
is then calculated by:
Vi= Ai+Ai+1
2 d, (4)
where:AiandAi+1 are, respectively, the top and the bottom surface areas ofiandi+1 segments, anddis the frustum pixel height, as shown in Fig. 2d. All frustums have equal thickness. Once the volume of individual frustums is ob-tained, the total volume of the orange can be readily calcu-lated by adding them up:
VIP Vi
i n = å
=1
, (5)
where:VIPis total volume of the orange calculated by the
The surface area, Si, (i= 1, 2, …, n), that is the
circumferential or lateral surface area of each frustum, can be calculated from the following expression:
Si=p di +di +di+ +di + 4( 1 2 1 1 2 1)
d2 1 2 1 1 2 1
2
4 4
+æ + - +
è ç ç
ö
ø ÷ ÷
+ +
di di di di
. (6)
The total surface area can be determined by adding them up:
SIP Si
i n = å
=1
(7)
where:SIPis the total surface area of orange using theIP
method.
The actual volume of oranges can be measured using the water displacement method (VWDM). In this method, the
object is completely submerged in water and the mass of the displaced water measured (Mohsenin, 1970). Even though this method is quite accurate, it is not ideal for objects that absorb water, and for some products this approach might be considered intrusive or destructive.
The actual surface area of oranges can be measured using the tape method (STM). In this method, the tape is
usually cut into small strips to fully cover the surface of the object, then these strips are peeled off and the total area is measured either by hand or by an area meter. The accuracy of this method is heavily dependent on how precisely
the object can be covered with tape strips, and also on how exactly the area for these tape pieces can be measured. The TM has been found time-consuming, labourinten-sive and prone to human error (Mohsenin, 1970; Sabilov et al., 2002).
The paired t-test and the mean difference confidence interval approach are used to compare the volume and surfa-ce area determined by the image prosurfa-cessing (VIP andSIP) techniques and the actual values (VWDMandSTM). Also, the
Bland-Altman approach is used to plot the agreement bet-ween the calculated and measured orange volume/area (Bland and Altman, 1999). The statistical analyses were per-formed using the Excel Analysis Toolpack option (MS Corporation, Redmond, WA, USA).
RESULTS AND DISCUSSION
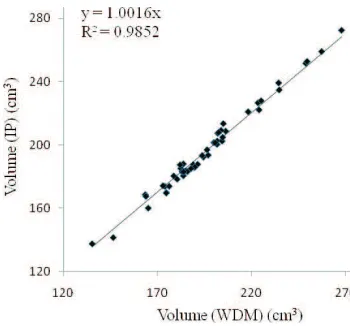
The volume determined by the image processing (IP) technique was compared with the mean volume measured by the water displacement method (WDM). The results of comparison between predicted (IP) and experimental (WDM) values with R2=0.9852 are shown in Table 1 and Fig. 3. The mean volume difference betweenIPandWDM wasd1= -0.15 cm3(95% confidence interval: -1.12 and 0.82 cm3). The standard deviation of the volume differences was sd1= 3.41 cm3. The paired t-test results showed that the volume computed with IP method was not significantly different from the volume measured withWDM(P= 0.7540) (Table 2). The volume differences between the computed and experimental results were normally distributed. 95% of
x y
z
´
Camera #1 Camera #2
(d) z y
x y
d
1
Fig. 2.Axi-symmetric geometry: a – 3-D view of an orange, b – segmentation of orange into a number of frustums of right elliptical cone, c – extracted diameters of a frustum from the two cameras: side-view from the z-axis, and d – thickness of a frustum and its surface areas: zoomed-in view of a frustum of right elliptical cone.
a b
the volume differences are expected to lie betweend1–1.96sd1 and d1+1.96sd1(known as 95% limits of agreement, Bland and Altman, 1999). The 95% limits of agreement for comparison of volumes computed withIPmethod and mea-sured withWDMwere -6.67 and 6.98 cm3(Fig. 4). Also from the results shown in Fig. 4, we can conclude that orange size has no effect on the accuracy of estimated volume. Recently, Koc (2007) determined the volume of watermelon by means of IP technique using circular discs. However, he concluded that as the size of the watermelon increases, theIPmethod overestimates the volume. This increase (or overestimation) in the volume seems logical since larger watermelons are nearer to the camera. However, the improvement achieved in the present study may be attributed to the more sophisticated image processing method used here; using two cameras instead of one, and implementing a more accurate algorithm through the elliptical frustum instead of simple circular discs for volume estimation.
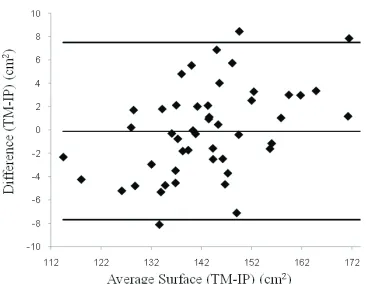
A plot of the surface areas computed usingIPmethod and the tape method (TM) is given in Table 1. The results of comparison between predicted (IP) and measured (TM) va-lues with R2=0.9296 are shown in Fig. 5. The mean surface area difference between the two methods wasd2= 0.11 cm2 (95% confidence interval: -0.97 and 1.19cm2). The standard deviation of the surface area differences wassd2= 3.80 cm2. The paired t-test results showed that the surface area measured withIPmethod is not significantly different than the actual surface area measured byTM(P= 0.8371) (Table 2). The surface area differences betweenIP method andTM were also normally distributed and the 95% limits of agreement in comparing these two methods were calculated to be 7.70 and 7.48 cm2(Fig. 6). Figure 6 shows that orange size has no effect on the accuracy of estimated surface area.
There are some situations in which it is desirable to determine relationships among physical characteristics; for example, fruits are often graded by size, but it may be more economical to develop a machine vision system which gra-des by mass (Baileyet al., 2004). The size of an agricultural produce is frequently represented by its mass because it is relatively simple to measure. Lorestani and Tabatabaeefar (2006) obtained empirical equations for modelling the mass of kiwi based on physical attributes. However, the
volume-Fig. 3.Comparison of computed and measured volume of oranges with image processing (IP) method and water displacement method (WDM).
Fig. 4.Bland-Altman plot for the comparison of orange volumes computed with image processing (IP) method and measured with water displacement (WDM); outer lines indicate the 95% limits of agreement (-6.67; 6.98 cm3) and centre line shows the average difference (0.15cm3).
Parameters Volume
(VWDMandVIP)
Surface area (STMandSIP)
Pairedt-test 0.7540 0.8371
95% confidence interval for the mean difference
-1.12; 0.82 -0.097; 1.19 T a b l e 2.t-test analyses on comparing volume and surface area measurement methods
based sorting system developed here provides a more effi-cient method than mass sorting. The mass of agricultural produce can be estimated from volume if the density of the produce is known. The characterization results of oranges showed that the volume and mass parameters are highly correlated (Table 1). The correlation formula derived based on the collected data is as follows:
M=0.68VIP+44.6, R2=0.93, (8)
where:MandVIPare the estimated mass (grams) and
com-puted volume (cm3) usingIPtechnique Eq. (5), respectively. Hence, this simple formula may be used to grade oranges based on the mass of oranges using the estimated volume information that was already computed byIPtechnique.
The developed algorithms are quite general and may be readily applied for volume and surface area computation of other axi-symmetric fruits such as melon, kiwifruit, pogranate and pear. It should be stated that the proposed me-thod is rotationally invariant and does not require fruit align-ment on the conveyor. Finally, the background segalign-menta- segmenta-tion method adapted here is not based on threshold values, and therefore it can be used with other fruits. Hence, the method may be easily integrated with one of citrus colour informationegHSI colour space, in an online multi-product sorting system for grading citrus.
CONCLUSIONS
1. The image processing method can accurately compute the volume and surface area of oranges.
2. The difference between volumes and surface areas computed using the proposed method, the water dis-placement and tape methods is not statistically significant at the 5% level.
3. The Bland-Altman approach shows that the size of orange has no effect on the estimation of volume and surface area of oranges.
4. The regression analysis indicates that volume and mass of the oranges are highly correlated (R2=0.93).
5. The method presented here is quite general and may be readily extended for volume and surface area compu-tation of other axi-symmetric fruits such as melon, kiwifruit, pomegranate, and pear.
REFERENCES
Bailey D.G., Mercer K.A., Plaw C., Ball R., and Barraclough H., 2004.High speed mass estimation by image analysis. Proc. New Zealand Nat. Conf. Non Destructive Testing (Eds S.C. Mukhopadhyay, R.F. Browne, G.S. Gupta), July 27-29, Palmerstone North, New Zealand.
Bland J.M. and Altman D.G., 1999. Measuring agreement in method comparison studies. Stat. Meth. Med. Res., 8, 135-160. Forbes K.A. and Tattersfield G.M., 1999. Estimating fruit
volume from digital images. Africon, IEEE, 1, 107-112. Hahn F. and Sanchez S., 2000.Carrot volume evaluation using
imaging algorithms. J. Agric. Eng. Res., 75, 243-249. Jafari A.A., Mohtasebi S., Eghbali-Jahromi H., and Omid M.,
2006. Weed detection in sugar beet fields using machine vision. Int. J. Agric. Biol., 8(5), 602-605.
Koc A.B., 2007. Determination of watermelon volume using ellipsoid approximation and image processing. Postharvest Biol. Technol., 45(3), 366-371.
Lee W.S., Slaughter D.C., and Giles D.K., 1999.Robotic weed control system for tomatoes. Precision Agric., 1, 95-113. Lee D.J., Xu X., Eifert J., and Zhan P., 2006.Area and volume
measurements of objects with irregular shapes using multiple silhouettes. Optical Eng., 45(2), 027202:1-10. Lorestani A.N., Omid M., Bagheri-Shooraki S., Borghei A.M.,
and Tabatabaeefar A., 2006.Design and evaluation of a fuzzy logic based decision support system for grading of Golden Delicious apples. Int. J. Agric. Biol., 8(4), 440-444. Lorestani A.N. and Tabatabaeefar A., 2006.Modeling the mass
of kiwi fruit by geometrical attributes. Int. Agrophysics, 20, 135-139.
Mohsenin N.N., 1970.Physical Properties of Plant and Animal Materials. Gordon and Breach Press, New York, NY, USA. Sabliov C.M., Boldor D., Keener K.M., and Farkas B.E., 2002.
Image processing method to determine surface area and volume of axi-symmetric agricultural products. Int. J. Food Prop., 5, 641-653.
Szirtes T., 2006.Applied Dimensional Analysis and Modeling. Elsevier Press, Burlington, MA, USA.
Topuz A., Topakci M., Canakci M., Akinci I., and Ozdemir F., 2005. Physical and nutritional properties of four orange varieties. J. Food Eng. Res., 66, 519-523.
Wang T.Y. and Nguang S.K., 2007.Low cost sensor for volume and surface area computation of axi-symmetric agricultural products. J. Food Eng., 79, 870-877.
Wilhelm L.R., Suter D.A., and Brusewitz G.H., 2005.Physical Properties of Food Materials. Food and Process Engineering Technology. ASAE Press, St. Joseph, MI, USA.