R E S E A R C H
Open Access
A Single Nucleotide Polymorphism in the
FADS1
Gene is Associated with Plasma Fatty
Acid and Lipid Profiles and Might Explain
Gender Difference in Body Fat Distribution
Huilan Guo
1,2, Lichao Zhang
1,2, Chaonan Zhu
1,2, Fei Yang
1,2, Shanshan Wang
3, Shankuan Zhu
1,2and Xiaoguang Ma
1,2*Abstract
Background:Genotyping of the rs174547 polymorphism in the fatty acid desaturase 1 gene (FADS1) shows that it is associated with the FA composition of plasma phospholipids and lipid metabolic indices among several ethnic groups. However, this association requires further confirmation in the Chinese population, and little is known about the effect of polymorphisms in fatty acid-related genes on body fat distribution.
Methods:Anthropometric measurements of 951 Chinese adults aged 18–79 were obtained and body fat distribution was estimated using dual-energy X-ray absorptiometry. The FA composition of plasma phospholipids was measured by gas chromatography. Multiple linear regression assessed whether the rs174547 genotype was associated with FA composition, body fat distribution, and metabolic traits in additive, dominant, and recessive models.
Results:The rs174547 C minor allele was associated with a higher proportion of linoleic acid, lower arachidonic acid and docosahexaenoic acid, as well as lower delta-6-desaturase and delta-5-desaturase activity. Female C allele carriers had lower android fat percentages and lower levels of low-density lipoprotein-cholesterol, while male C allele carriers had lower gynoid fat percentages and higher triglyceride after adjusting for age, income, BMI, behavioral risk factors, and regional fat percentages.
Conclusion:An association ofFADS1rs174547 with the FA composition of plasma phospholipids was identified among this Chinese adult population. The association with body fat distribution and lipid metabolic indices differed between men and women, which might explain sexual differences in body fat distribution and lipid metabolism.
Keywords:SNP, genotype, desaturase activity, lipid profiles, fat mass, fatty acid, fat distribution
Background
Previous studies have identified associations between varia-tions in genes encoding fatty acid desaturase 1 (FADS1) and 2 (FADS2) with changes in plasma FA profiles and al-tered desaturase activity [1–4]. For instance, FADS1 rs174547, a T/C SNP in intron 9 ofFADS1, was reported to
be associated with arachidonic acid to linoleic acid (AA:LA) FA ratios in both Caucasians and Asians [5, 6]. Similarly, the association of this locus with fatty acid level was exam-ined among Chinese, but the findings were inconsistent across studies [7, 8].
FA metabolism has been linked to body fat accumulation and obesity [9–12]. However, it is not clear whether the polymorphisms in FA-related genes are associated with obesity and body fat distribution. A previous study of a Chinese population failed to associateFADS1rs174547 with BMI [13], but as yet no studies have focused on body com-position, especially body fat and its distribution (i.e., body fat percentage and central obesity). Although gender differences * Correspondence:[email protected]
1Department of Nutrition and Food Hygiene, School of Public Health, School of Medicine, Zhejiang University, 866 Yu-hang-tang Road, Hangzhou, Zhejiang 310058, China
2Chronic Disease Research Institute, School of Public Health, School of Medicine, Zhejiang University, 866 Yu-hang-tang Road, Hangzhou, Zhejiang 310058, China
Full list of author information is available at the end of the article
have been identified for body fat distribution [14], for ex-ample, men tend to accumulate fat in the abdominal region (apple-type obesity) and women in the hip region (pear-type obesity), few genetic variations explain this disparity so far. Moreover, while genome-wide association studies have revealed gene-by-sex interactions for BMI and waist circumference (WC) [15, 16], few studies have ex-plained gender differences in fat distribution measured by issue-specific technology such as dual-energy X-ray absorptiometry (DXA) or computed tomography [17].
FADS1 rs174547 was shown to be involved in the lipid
metabolic pathway which catalyzes the biosynthesis of highly unsaturated FA. Thus, this SNP might impact on hu-man lipid profiles. Previous studies associated the FADS1 rs174547 genotype with lipids levels in Chinese population. For instance, a Chinese study reported that the CC variant of rs174547 was significantly associated with increased TG and decreased HDL-C [18]. However, the findings were in-consistent in recent studies. In a recent study examining the association between the FADS gene cluster and coronary ar-tery disease and lipids in northern Chinese Han population, no significant associations were found between rs174547 and lipids indicators [19].
This study aimed to examine the effect of FADS1 rs174547 on plasma FA composition, body composition, body fat indices, and plasma lipid profiles among Chinese adults. We also explored the impact of this SNP on gender differences in body fat distribution.
Methods Study sample
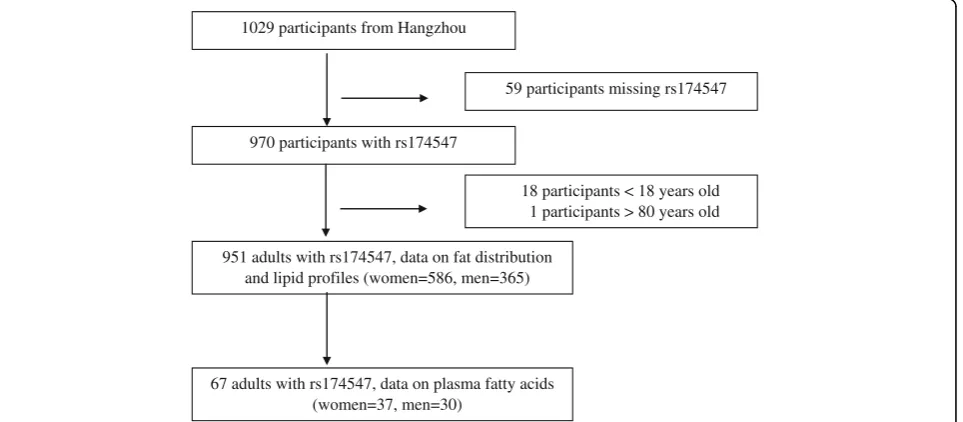
A total of 1029 community residents aged from 18 to 82 years old were recruited voluntarily between November 2008 and May 2009 from two communities in Hangzhou
City, a capital provincial city in eastern China. Two com-munities were chosen for convenience from Xiacheng and Xiaoshan districts of the city. The subjects were recruited voluntarily by posters, flyers, and community leaders. All subjects completed a standardized questionnaire survey, underwent physical anthropometry and body composition measurements, and provided blood samples at the Obesity and Body Composition Research Center of Zhejiang Uni-versity School of Public Health. In 2014, 67 participants were sampled with stratification on BMI distribution, and the measurement of plasma FA was made using their stored plasma samples. In 2015, after excluding the partici-pants aged <18 or >80 years, theFADS1rs174547 genotype was determined in 951 participants (including the 67 par-ticipants sampled in 2014) using stored blood samples.
The flow of participants included in the analysis is shown in Fig. 1. Written informed consent was obtained from all participants and the study was approved by the Ethics Committee of the Second Affiliated Hospital of Zhejiang University.
Measurements
Weight and height were measured with subjects wearing light clothing and without shoes. Body weight was recorded to the nearest 0.1 kg (Detecto, Missouri, USA). Body height was measured with a hypsometer to the nearest 0.1 cm. All values were recorded as the mean of three measures. WC was measured at the approximate midpoint between the lower margin of the last palpable rib and the top of the iliac crest, at minimal respiration. Hip circumference was mea-sured at the maximum circumference of the buttocks with the tape parallel to the floor. Blood pressure was obtained from the right arm of seated participants after a 5-min rest. It was measured twice by the same trained examiners with
1029 participants from Hangzhou
970 participants with rs174547
951 adults with rs174547, data on fat distribution and lipid profiles (women=586, men=365)
67 adults with rs174547, data on plasma fatty acids (women=37, men=30)
59 participants missing rs174547
18 participants < 18 years old 1 participants > 80 years old
a mercury sphygmomanometer according to a standard protocol [20]; the mean of the two measurements was used for analysis. BMI was calculated as weight in kilograms divided by height in meters squared.
DXA (GE Lunar Prodigy, WI, USA with software version 11.40.004) was implemented to measure body fat distribu-tion as previously described [21]. The bone mineral dens-ity, fat mass, and lean soft tissue mass of the whole body and specific regions of interest (limb, trunk, an-droid region, and gynoid region) were measured. DXA was checked daily against a calibration phantom using the manufacturer’s precision standards of <0.8%. Fat mass percentage (FMP), as an indication of fat distribu-tion, was calculated as regional fat mass kg/body weight in kg*100.
Information on demographics, socioeconomic status, and lifestyle behavior was collected by face-to-face inter-view using a structured questionnaire, including questions on age, sex, income, smoking status, alcohol consumption, and physical activity. Participants were classified according to their smoking status as nonsmokers or current smokers, and according to their alcohol consumption as non-drinkers, current drinkers, and abstainers. Physical activity was grouped as low, moderate, or heavy based on its frequency and intensity according to the international physical activity questionnaire [22, 23].
Blood biochemical analysis and DNA extraction
After an overnight fasting, venous blood specimens were collected for biochemical analysis. Fasting plasma glu-cose (FPG) concentrations were determined using a hexokinase method. Total cholesterol (TC) and TG con-centrations were measured using COD-PAP and GPO-PAP methods, and HDL-C and LDL-C were measured using an enzymatic homogeneous assay. The levels of apolipoprotein A1, and apolipoprotein B were deter-mined by immunoturbidimetric assay. All the reagents were obtained from Roche. Then remaining samples were stored at −80 °C for further analysis. Genomic DNA was extracted from 1 to 5 mL whole blood using a commercially available DNA isolation kit (BloodGen Midi Kit, CWBIO, Beijing, China) according to the man-ufacturer’s protocol between April and May 2015.
Measurement of plasma phospholipid fatty acid
For the analysis of FA composition, total lipids were ex-tracted from 200 μl plasma using chloroform–methanol (2:1 v:v) according to the Folch method [24]. The ho-mogenates were stilled at 4 °C and subsequently centri-fuged at 3000 xg for 5 min, then the lipid-containing chloroform phase was transferred to a new tube and dried under nitrogen gas. The extraction process was repeated with an equal volume of chloroform. The resulting free FAs were methylated by the addition of
14% boron trifluoride in methanol at 100 °C for 1 h. The reaction was stopped by adding distilled water, and the contents were centrifuged at 3000 xg for 5 min and dried under nitrogen gas for phase separation. The lipid phase was evaporated under nitrogen gas, and reconsti-tuted in hexane for analysis. FA methyl esters were sep-arated by gas chromatography using an Agilent 7890A gas chromatograph (Agilent Technologies, Palo Alto, CA). Peaks were identified by comparison with FA methyl ester standards. The levels of plasma FAs were expressed as percent fatty acid composition: palmitic acid (C16:0), stearic acid, palmitoleic acid, oleic acid (OA), LA (C18:2n −6),α-linolenic acid (C18:3n−3), γ-linolenic acid (GLA; C18:3n − 6), Docosahexaenoic acid (DHA; C22:6n − 3), AA (C20:4n − 6), and eicosapentaenoic acid (C20:5n − 3). Desaturase activity was estimated using the ratio of the product FA to precursor FA, which has previously been well-established. The Δ6 desaturase (D6D) activity was estimated by dividing the % composition of DGLA by LA, and theΔ5 desaturase (D5D) activity was estimated by dividing the % compos-ition of AA by DGLA [25].
Statistical analysis
The statistical significance of demographic characteristics was analyzed using thet-test for continuous variables or the chi-square test for categorical variables. Pearson’sχ2test was used to examine whether rs174547 genotype frequencies were in Hardy–Weinberg equilibrium (HWE). The associa-tions between FADS1 rs174547 and plasma phospholipid FAs, body composition indices, and lipid profile indicators were identified by multivariate linear regression models, with each stage of regression analysis performed assuming additive (variant/variant vs. variant/common vs. common/ common), dominant (variant/variant + variant/common vs. common/common), or recessive (variant/variant vs. variant/ common + common/common) models. The effect value was determined from the model with the lowestPvalue.
Table 1Characteristics of the Study Population in the in the fatty acid analysis (N= 67)
Variables Mean ± SD or N (%) Pvalue for gender
difference
Total (n= 67) Men (n= 37) Women (n= 30)
Age (years) 51.6 ± 12.9 50.6 ± 13.2 52.7 ± 12.8 0.259
BMI (kg/m2) 23.8 ± 3.1 24.2 ± 3.3 23.1 ± 2.8 0.068
Smoking <0.001
Non-smoker 43 (64.2) 15 (40.5) 28 (59.5)
Current smoker 24 (35.8) 22 (93.3) 2 (6.67)
Alcohol consumption 0.007
Non-drinker 29 (43.3) 10 (27.03) 19 (63.3)
Current drinker 36 (53.7) 25 (69.4) 11 (36.7)
Abstainer 2 (3) 2 (5.41) 0 (0)
Rs174547 genotypes 0.427
TT 26 (38.81) 15 (40.5) 11 (36.7)
TC 36 (53.73) 18 (48.7) 18 (60.0)
CC 5 (7.46) 4 (10.8) 1 (3.3)
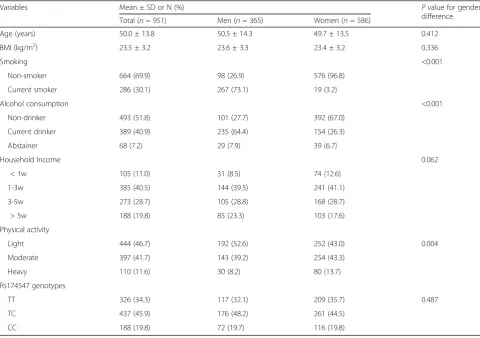
Table 2Characteristics of the Study Population in anthropometric measurement and lipids analysis (N= 951)
Variables Mean ± SD or N (%) Pvalue for gender
difference
Total (n= 951) Men (n= 365) Women (n= 586)
Age (years) 50.0 ± 13.8 50.5 ± 14.3 49.7 ± 13.5 0.412
BMI (kg/m2) 23.5 ± 3.2 23.6 ± 3.3 23.4 ± 3.2 0.336
Smoking <0.001
Non-smoker 664 (69.9) 98 (26.9) 576 (96.8)
Current smoker 286 (30.1) 267 (73.1) 19 (3.2)
Alcohol consumption <0.001
Non-drinker 493 (51.8) 101 (27.7) 392 (67.0)
Current drinker 389 (40.9) 235 (64.4) 154 (26.3)
Abstainer 68 (7.2) 29 (7.9) 39 (6.7)
Household Income 0.062
< 1w 105 (11.0) 31 (8.5) 74 (12.6)
1-3w 385 (40.5) 144 (39.5) 241 (41.1)
3-5w 273 (28.7) 105 (28.8) 168 (28.7)
> 5w 188 (19.8) 85 (23.3) 103 (17.6)
Physical activity
Light 444 (46.7) 192 (52.6) 252 (43.0) 0.004
Moderate 397 (41.7) 143 (39.2) 254 (43.3)
Heavy 110 (11.6) 30 (8.2) 80 (13.7)
Rs174547 genotypes
TT 326 (34.3) 117 (32.1) 209 (35.7) 0.487
TC 437 (45.9) 176 (48.2) 261 (44.5)
Results
The characteristics and rs174547 genotypes of the FA analysis sample (n = 67) are shown in Tables 1 and 2 shows anthropometric measurements and lipid analysis of the whole sample (n= 951). For whole sample analysis, men showed higher levels of physical activity, alcohol con-sumption, and smoking prevalence than women, while no sex difference was observed in age, BMI, or household in-come. The effect allele of rs174547 was the C allele, which had a frequency of 0.343 and conformed to HWE (P= 0.117), with a genotyping success rate of 99.5%.
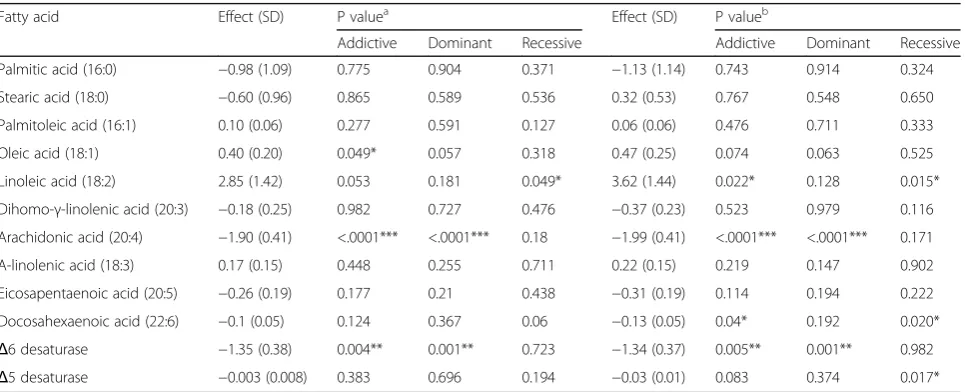
Correlations between the rs174547 genotype and plasma phospholipid FAs are shown in Table 3. The number of C alleles was positively correlated with the proportion of OA and LA in the additive model and recessive model when adjusting for age and sex. An in-crease in the number of C alleles was associated with a significantly higher OA level and LA level, and with a significantly lower AA level and D6D in the additive model and recessive model. When including age, sex, smoking, drinking, and BMI in the model, the positive association between the C allele and LA remained sig-nificant, while that between the C allele and OA was lost. The C allele was inversely associated with the concentration of AA, DHA, D6D, and D5D after adjusting the covariates.
The associations between the rs174547 genotype and anthropometric indicators among men and women are shown respectively in Tables 4 and 5. In men, no signifi-cant association between fat distribution and the rs174547 C allele was observed when only adjusting for age. However, after further adjusting the covariates and BMI, the C allele was negatively correlated with WC, gynoid FMP, and limb FMP. The gynoid FMP remained significantly associated with the C allele in the additive
model and dominant model when further adjusting for other regional fat distribution.
In women, all indicators of body fat distribution except weight, BMI, WC, and weight-to-hip ratio (WHpR) showed a decreasing trend with increasing numbers of C alleles of the respective genotype after adjusting for age. When further adjusting for covariates and BMI, the as-sociation of the C allele with WHpR and android FMP remained significantly negatively correlated, while the association with other indicators of fat distribution di-minished. When including gynoid FMP in the model, the android FMP remained significantly associated with the C allele in the dominant model.
The associations between the rs174547 genotype and lipid profiles among women and men are shown respect-ively in Tables 6 and 7. The level of TG was positrespect-ively correlated with the C allele in the additive model among men when adjusting for covariates and BMI; the associ-ation remained significant after further adjusting for an-droid FMP. In women, the C allele was negatively correlated with the concentration of LDL-C in the addi-tive model and dominant model after further adjusting for android FMP.
Discussion
In the present study, we found that the FA metabolism-relatedFADS1SNP rs174547 was significantly associated with several lipid metabolic indices and anthropometric indicators. We also confirmed an association between rs174547 and plasma phospholipid FA, and showed that rs174547 was associated with body fat distribution with a significant gender difference.
Several studies have previously explored the association of SNPs in theFADSgene cluster with plasma phospho-lipid FA in various ethnicities, and report the correlation
Table 3The association between rs174547 and plasma fatty acids (N= 67)
Fatty acid Effect (SD) P valuea Effect (SD) P valueb
Addictive Dominant Recessive Addictive Dominant Recessive
Palmitic acid (16:0) −0.98 (1.09) 0.775 0.904 0.371 −1.13 (1.14) 0.743 0.914 0.324
Stearic acid (18:0) −0.60 (0.96) 0.865 0.589 0.536 0.32 (0.53) 0.767 0.548 0.650
Palmitoleic acid (16:1) 0.10 (0.06) 0.277 0.591 0.127 0.06 (0.06) 0.476 0.711 0.333
Oleic acid (18:1) 0.40 (0.20) 0.049* 0.057 0.318 0.47 (0.25) 0.074 0.063 0.525
Linoleic acid (18:2) 2.85 (1.42) 0.053 0.181 0.049* 3.62 (1.44) 0.022* 0.128 0.015*
Dihomo-γ-linolenic acid (20:3) −0.18 (0.25) 0.982 0.727 0.476 −0.37 (0.23) 0.523 0.979 0.116
Arachidonic acid (20:4) −1.90 (0.41) <.0001*** <.0001*** 0.18 −1.99 (0.41) <.0001*** <.0001*** 0.171
Α-linolenic acid (18:3) 0.17 (0.15) 0.448 0.255 0.711 0.22 (0.15) 0.219 0.147 0.902
Eicosapentaenoic acid (20:5) −0.26 (0.19) 0.177 0.21 0.438 −0.31 (0.19) 0.114 0.194 0.222
Docosahexaenoic acid (22:6) −0.1 (0.05) 0.124 0.367 0.06 −0.13 (0.05) 0.04* 0.192 0.020*
Δ6 desaturase −1.35 (0.38) 0.004** 0.001** 0.723 −1.34 (0.37) 0.005** 0.001** 0.982
Δ5 desaturase −0.003 (0.008) 0.383 0.696 0.194 −0.03 (0.01) 0.083 0.374 0.017*
a
Table
6
Association
between
rs174547
and
lipid
profiles
in
men
(
N
=
365)
Indices
Effect
(SD)
P
value
a
Effect
(SD)
P
value
b
Effect
(SD)
P
value
c
Addicti
ve
Domi
nant
Recess
ive
Add
ictive
Domi
nant
Recessive
Add
ictive
Domin
ant
Re
cessive
TG
(mmo
l/l)
0.18
(0.35
)
0.983
0.680
0.597
0.18
(0.09
)
0.
042*
0.112
0.079
0.21
(0.09)
0.02
1*
0.055
0.
064
TC
(mm
ol/l)
0.07
(0.13
)
0.803
0.957
0.608
0.08
(0.13
)
0.
724
0.992
0.519
0.10
(0.13)
0.56
4
0.799
0.
466
HDL-C
(mmo
l/l)
0.02
(0.02
)
0.252
0.399
0.292
0.04
(0.09
)
0.
789
0.997
0.628
0.07
(0.09)
0.49
9
0.663
0.
488
LDL-C
(mmo
l/l)
−
0.04
(0.10)
0.858
0.953
0.695
−
0.04
(0.04
)
0.
302
0.527
0.269
−
0.03
(0.02
)
0.12
8
0.266
0.
159
Apoa1
(g/L)
0.02
(0.02
)
0.437
0.530
0.517
0.02
(0.02
)
0.
356
0.418
0.485
0.01
(0.02)
0.64
6
0.726
0.
683
Apob
(g
/L)
0.03
(0.03
)
0.530
0.961
0.235
0.03
(0.02
)
0.
432
0.984
0.165
0.04
(0.03)
0.19
8
0.552
0.
110
aAdujsted
for
age;
bAdjusted
for
age,
income,
smoking,
drinking,
physical
activity
and
BMI;
TG
triglyceride,
TC
total
cholesterol,
HDL-C
high-density
lipoprotein
cholesterol,
LDL-C
high
low-density
lipoprotein
cholesterol,
Apoa1
Apolipoprotein
A1,
Apob
Apolipoprotein
B;
cAdjusted
for
age,
income,
smoking,
drinking,
physical
activity,
BMI,
and
gynoid
fat
mass
percent;
*
P
<
Table
7
The
association
between
rs174547
and
lipid
profiles
in
women
(
N
=
586)
Indices
Effect
(SD)
P
value
a
Effect
(SD)
P
value
b
Effect
(SD)
P
value
c
Addicti
ve
Domi
nant
Recess
ive
Add
ictive
Domi
nant
Recessive
Add
ictive
Domin
ant
Re
cessive
TG
(mmo
l/l)
−
0.09
(0.09)
0.541
0.888
0.344
−
0.02
(0.09
)
0.
924
0.946
0.796
0.03
(0.08)
0.89
4
0.714
0.
842
TC
(mm
ol/l)
−
0.03
(0.05)
0.513
0.607
0.564
−
0.03
(0.08
)
0.
692
0.687
0.811
−
0.01
(0.05
)
0.82
2
0.828
0.
881
HDL-C
(mmo
l/l)
−
0.04
(0.03)
0.155
0.119
0.469
−
0.04
(0.06
)
0.
624
0.526
0.897
−
0.02
(0.06
)
0.81
7
0.724
0.
996
LDL-C
(mmo
l/l)
−
0.04
(0.04)
0.386
0.426
0.531
−
0.03
(0.02
)
0.
067
0.081
0.214
−
0.04
(0.02
)
0.03
5*
0.037*
0.
183
Apoa1
(g/L)
0.02
(0.03
)
0.754
0.891
0.460
0.01
(0.03
)
0.
989
0.789
0.764
−
0.01
(0.03
)
0.79
7
0.600
0.
870
Apob
(g
/L)
−
0.03
(0.02)
0.150
0.330
0.145
−
0.01
(0.01
)
0.
320
0.424
0.392
−
0.01
(0.02
)
0.53
0
0.686
0.
509
aAdujsted
for
age;
bAdjusted
for
age,
income,
smoking,
drinking,
physical
activity
and
BMI;
cAdjusted
for
age,
income,
smoking,
drinking,
physical
activity,
BMI,
and
android
fat
mass
percent;
TG
triglyceride,
TC
total
cholesterol,
HDL-C
high-density
lipoprotein
cholesterol,
LDL-C
high
low-density
lipoprotein
cholesterol,
Apoa1
Apolipoprotein
A1,
Apob
Apolipoprotei
n
B;
*
P
<
of particular alleles with higher levels of LA and lower levels of AA [3, 7], which is consistent with our current results. Suhre et al. observed an association between D5D activity and rs174547 [4]; however, we demonstrated that rs174547 was more significantly associated with D6D. Similarly, the effect of rs174547 on dyslipidemia has been reported among many ethnic groups. The rs174547 C allele was previously found to be positively correlated with the level of TC and negatively correlated with the level of HDL-C in Chinese and other Asian populations [26–28]. However, Wu et al. found no significant asso-ciations of rs174547 with TG and TC levels among Chinese [19]. It has been acknowledged that the sexual dimorphism exists in general lipid profiles [29–32], so the association between the blood lipid indices and rs174547 might should be performed separately for fe-male and fe-male. Our results showed that rs174547 was significantly correlated with TC levels in men, and negatively correlated with LDL-C in women, which sug-gested that this locus may be a gender-specific SNP.
Gender differences in body fat distribution are well-established [14], with women known to predominantly accumulate subcutaneous fat in their limbs and hips, while men accumulate visceral fat in their abdomens; they therefore have an increased risk of obesity-related metabolic diseases [33, 34]. Body composition was pre-cisely measured using DXA in our study, revealing that female C allele carriers had less abdominal fat reflected by the android FMP, and male C allele carriers had less subcutaneous fat reflected by the gynoid FMP. Thus, our findings indicated that FADS1 rs174547 might be a use-ful tool to elucidate the genetic basis of obesity-related disease, and it might be a predictive marker to identify high-risk individuals for abnormal body fat distribution and dyslipidemia, especially in male subjects. Besides, mutations of the same allele appeared to cause different body compositions among men and women, suggesting that gender differences in fat distribution reflect genetic diversity, which may involve differences in gene expres-sion and function. It should be noted that the sexual differences in body fat distribution and lipid metabol-ism involve many genetic and environmental factors and their complex interactions. Our finding might par-tially explain this gender discrepancy.
A major strength of our study is that it is the first to demonstrate the impact of this FA-related SNP on gen-der differences in body fat distribution in a Chinese adult population. Although the influence of rs174547 on BMI has been studied previously [13], fat distribu-tion measures derived from DXA are more precise and provide additional information to further understand the association with rs174547. We also thoroughly dis-cussed the impact of gender differences on the associ-ation of rs174547 with blood lipid profiles. However,
we acknowledge a number of limitations. First, we only focused on the effect of one SNP, and did not explore interaction effects between SNPs. Second, we did not consider the influence of environmental factors on genotype and phenotype, and most of the study partici-pants were middle-aged adults. Finally, the study sam-ple was from a capital city in eastern China and the subjects were not recruited through a random sampling procedure. In addition, the 951 sample size was rela-tively small. Thus our study sample might not be repre-sentative of the entire Chinese population. However, we focused on the association analysis between factors ra-ther than descriptive analysis of the population in this study, the representativeness of the sample might not affect the association results. Further large and nation-ally representative studies were warranted to confirm the findings.
Conclusions
In summary, we investigated the relationship between
FADS1 rs174547 with plasma phospholipid FA profiles,
anthropometric measurements, and lipid profiles in this Chinese adult population. The rs174547 C allele was shown to correlate with the level of plasma FA. The associ-ation between the rs174547 genotype and body fat dis-tribution and lipid indicators differed between men and women, which might partially explain sexual differences in body fat distribution and lipid metabolism. Future research should investigate the effects of FADS1 and
FADS2on body fat distribution, especially in women.
Abbreviations
AA:Arachidonic acid; D5D:Δ5 desaturase; D6D:Δ6 desaturase; DGLA: Dihomo-γ-linolenic acid; DXA: Dual-energy X-ray absorptiometry; FA: Fatty acid; FADS: Fatty acid desaturase; FMP: Fat mass percentage; GLA:γ-linolenic acid; HDL-C: High-density lipoprotein cholesterol; HWE: Hardy–Weinberg equilibrium; LA: Linoleic acid; LDL-C: Low-density lipoprotein cholesterol; SNP: Single nucleotide polymorphism; TC: Total cholesterol; WC: Waist circumference; WHpR: Weight-to-hip ratio
Acknowledgements
We are grateful to those participants who involved in this study.
Funding
This study was supported, in part, by funding from the National Natural Science Foundation of China (81,402,664 and 31,400,766), the Institute of Sports Science of Zhejiang province in China (2011F10052–17(2016)), and the China Medical Board (14–197 and 15–216).
Availability of data and materials
Please contact corresponding author for data requests.
Authors’contributions
Competing interests
The authors declare that they have no competing interests.
Consent for publication
Not applicable.
Ethics approval and consent to participate
This study was approved by the Ethics Committee of the Second Affiliated Hospital of Zhejiang University, and all procedures were in accordance with ethical standards of the institution. All participants provided written consent before participation in this study.
Publisher’s Note
Springer Nature remains neutral with regard to jurisdictional claims in published maps and institutional affiliations.
Author details
1
Department of Nutrition and Food Hygiene, School of Public Health, School of Medicine, Zhejiang University, 866 Yu-hang-tang Road, Hangzhou, Zhejiang 310058, China.2Chronic Disease Research Institute, School of Public Health, School of Medicine, Zhejiang University, 866 Yu-hang-tang Road, Hangzhou, Zhejiang 310058, China.3Department of Public Health, Shandong Provincial Hospital affiliated to Shandong University, Jinan, Shandong, China.
Received: 27 December 2016 Accepted: 20 March 2017
References
1. Rzehak P, Heinrich J, Klopp N, Schaeffer L, Hoff S, Wolfram G, Illig T, Linseisen J. Evidence for an association between genetic variants of the fatty acid desaturase 1 fatty acid desaturase 2 ( FADS1 FADS2) gene cluster and the fatty acid composition of erythrocyte membranes. Br J Nutr. 2009;101:20–6.
2. Schaeffer L, Gohlke H, Muller M, Heid IM, Palmer LJ, Kompauer I, Demmelmair H, Illig T, Koletzko B, Heinrich J. Common genetic variants of the FADS1 FADS2 gene cluster and their reconstructed haplotypes are associated with the fatty acid composition in phospholipids. Hum Mol Genet. 2006;15:1745–56.
3. Bokor S, Dumont J, Spinneker A, Gonzalez-Gross M, Nova E, Widhalm K, Moschonis G, Stehle P, Amouyel P, De Henauw S, et al. Single nucleotide polymorphisms in the FADS gene cluster are associated with delta-5 and delta-6 desaturase activities estimated by serum fatty acid ratios. J Lipid Res. 2010;51:2325–33.
4. Suhre K, Shin SY, Petersen AK, Mohney RP, Meredith D, Wagele B, Altmaier E. Cardio Gram, Deloukas P, Erdmann J, et al. Human metabolic individuality in biomedical and pharmaceutical research. Nature. 2011;477:54–60.
5. Merino DM, Johnston H, Clarke S, Roke K, Nielsen D, Badawi A, El-Sohemy A, Ma DW, Mutch DM. Polymorphisms in FADS1 and FADS2 alter desaturase activity in young Caucasian and Asian adults. Mol Genet Metab. 2011;103:171–8. 6. Abdelmagid SA, Clarke SE, Roke K, Nielsen DE, Badawi A, El-Sohemy A,
Mutch DM, Ma DW. Ethnicity, sex, FADS genetic variation, and hormonal contraceptive use influence delta-5- and delta-6-desaturase indices and plasma docosahexaenoic acid concentration in young Canadian adults: a cross-sectional study. Nutr. Metab. 2015;12:14.
7. Hu Y, Li H, Lu L, Manichaikul A, Zhu J, Chen YD, Sun L, Liang S, Siscovick DS, Steffen LM, et al. Genome-wide meta-analyses identify novel loci associated with n-3 and n-6 polyunsaturated fatty acid levels in Chinese and European-ancestry populations. Hum Mol Genet. 2016;25:1215–24. 8. Dorajoo R, Sun Y, Han Y, Ke T, Burger A, Chang X, Low HQ, Guan W, Lemaitre
RN, Khor CC, et al. A genome-wide association study of n-3 and n-6 plasma fatty acids in a Singaporean Chinese population. Genes Nutr. 2015;10:53. 9. Micallef M, Munro I, Phang M, Garg M. Plasma n-3 polyunsaturated fatty
acids are negatively associated with obesity. Br J Nutr. 2009;102:1370–4. 10. Sneddon AA, Tsofliou F, Fyfe CL, Matheson I, Jackson DM, Horgan G, Winzell MS,
Wahle KW, Ahren B, Williams LM. Effect of a conjugated linoleic acid and omega-3 fatty acid mixture on body composition and adiponectin. Obesity (Silver Spring). 2008;16:1019–24.
11. Saito E, Okada T, Abe Y, Odaka M, Kuromori Y, Iwata F, Hara M, Mugishima H, Kitamura Y. Relationship between estimated fatty acid desaturase activities and abdominal adiposity in Japanese children. Obes Res Clin Pract. 2014;8:e201–98.
12. Kawashima A, Sugawara S, Okita M, Akahane T, Fukui K, Hashiuchi M, Kataoka C, Tsukamoto I. Plasma fatty acid composition, estimated desaturase activities, and intakes of energy and nutrient in japanese men with abdominal obesity or metabolic syndrome. J Nutr Sci Vitaminol. 2009;55:400–6. 13. Wang JW, Tang X, Li N, Wu YQ, Li S, Li J, Qin XY, Zhang ZX, Hu YH, Chen DF.
The impact of lipid-metabolizing genetic polymorphisms on body mass index and their interactions with soybean food intake: a study in a Chinese population. Biomed Environ Sci. 2014;27:176–85.
14. Dixon AK. Abdominal fat assessed by computed tomography: sex difference in distribution. Clin Radiol. 1983;34:189–91.
15. Heid IM, Jackson AU, Randall JC, Winkler TW, Qi L, Steinthorsdottir V, Thorleifsson G, Zillikens MC, Speliotes EK, Magi R, et al. Meta-analysis identifies 13 new loci associated with waist-hip ratio and reveals sexual dimorphism in the genetic basis of fat distribution. Nat Genet. 2010;42:949–60. 16. Randall JC, Winkler TW, Kutalik Z, Berndt SI, Jackson AU, Monda KL,
Kilpeläinen TO, Esko T, Mägi R, Li S, et al. Sex-stratified genome-wide association studies including 270,000 individuals show sexual dimorphism in genetic loci for anthropometric traits. PLoS Genet. 2013;9:e1003500. 17. Sung Y, Pérusse L, Sarzynski M, Fornage M, Sidney S, Sternfeld B, Rice T, Terry J,
Jacobs D, Katzmarzyk P. Genome-wide association studies suggest sex-specific loci associated with abdominal and visceral fat. Int J Obes. 2016;40:662–74. 18. Liu SJ, Zhi H, Chen PZ, Chen W, Lu F, Ma GS, Dai JC, Shen C, Liu NF, Hu ZB,
et al. Fatty acid desaturase 1 polymorphisms are associated with coronary heart disease in a Chinese population. Chin Med J. 2012;125:801–6. 19. Wu Y, Zeng L, Chen X, Xu Y, Ye L, Qin L, Chen L, Xie L. Association of the
FADS gene cluster with coronary artery disease and plasma lipid concentrations in the northern Chinese Han population. Prostaglandins Leukot. Essent. Fatty Acids. 2017;117:11–6.
20. Perloff D, Grim C, Flack J, Frohlich ED, Hill M, McDonald M, Morgenstern BZ. Human blood-pressure determination by sphygmomanometry. Circulation. 1993;88:2460–70.
21. Fu X, Zhu F, Zhao X, Ma X, Zhu S. Central fat accumulation associated with metabolic risks beyond total fat in normal BMI Chinese adults. Ann Nutr Metab. 2014;64:93–100.
22. Fan M, Lyu J, He P. Chinese guidelines for data processing and analysis concerning the International Physical Activity Questionnaire. Zhonghua Liu Xing Bing Xue Za Zhi. 2014;35:961–4.
23. Craig CL, Marshall AL, Sjostrom M, Bauman AE, Booth ML, Ainsworth BE, Pratt M, Ekelund U, Yngve A, Sallis JF, Oja P. International physical activity questionnaire: 12-country reliability and validity. Med Sci Sports Exerc. 2003;35:1381–95.
24. Folch J, Lees M, Sloane Stanley GH. A simple method for the isolation and purification of total lipides from animal tissues. J Biol Chem. 1957;226:497–509. 25. Martinelli N, Girelli D, Malerba G, Guarini P, Illig T, Trabetti E, Sandri M, Friso S,
Pizzolo F, Schaeffer L, et al. FADS genotypes and desaturase activity estimated by the ratio of arachidonic acid to linoleic acid are associated with inflammation and coronary artery disease. Am J Clin Nutr. 2008;88:941–9. 26. Nakayama K, Bayasgalan T, Tazoe F, Yanagisawa Y, Gotoh T, Yamanaka K,
Ogawa A, Munkhtulga L, Chimedregze U, Kagawa Y, et al. A single nucleotide polymorphism in the FADS1/FADS2 gene is associated with plasma lipid profiles in two genetically similar Asian ethnic groups with distinctive differences in lifestyle. Hum Genet. 2010;127:685–90.
27. Park MH, Kim N, Lee JY, Park HY. Genetic loci associated with lipid concentrations and cardiovascular risk factors in the Korean population. J Med Genet. 2011;48:10–5.
28. Chung S-K, Yu H, Park AY, Kim JY, Cha S. Genetic loci associated with changes in lipid levels leading to constitution-based discrepancy in Koreans. BMC Complement Altern Med. 2014;14:230.
29. Abbott RD, Garrison RJ, Wilson P, Epstein FH, Castelli WP, Feinleib M, LaRue C. Joint distribution of lipoprotein cholesterol classes. The Framingham study. Arterioscler Thromb Vasc Biol. 1983;3:260–72. 30. Georgopoulos A, Rosengard AM. Abnormalities in the metabolism of
postprandial and fasting triglyceride-rich lipoprotein subfractions in normal and insulin-dependent diabetic subjects: effects of sex. Metabolism. 1989;38:781–9. 31. Johnson JL, Slentz CA, Duscha BD, Samsa GP, McCartney JS, Houmard JA,
Kraus WE. Gender and racial differences in lipoprotein subclass distributions: the STRRIDE study. Atherosclerosis. 2004;176:371–7.
33. Fu X, Song A, Zhou Y, Ma X, Jiao J, Yang M, Zhu S. Association of regional body fat with metabolic risks in Chinese women. Public Health Nutr. 2014;17:2316–24.