R E S E A R C H
Open Access
Small, synthetic, GC-rich mRNA stem-loop
modules 5
′
proximal to the AUG start-codon
predictably tune gene expression in yeast
Erwin Lamping
*, Masakazu Niimi and Richard D Cannon
Abstract
Background:A large range of genetic tools has been developed for the optimal design and regulation of complex metabolic pathways in bacteria. However, fewer tools exist in yeast that can precisely tune the expression of individual enzymes in novel metabolic pathways suitable for industrial-scale production of non-natural compounds. Tuning expression levels is critical for reducing the metabolic burden of over-expressed proteins, the accumulation of toxic intermediates, and for redirecting metabolic flux from native pathways involving essential enzymes without negatively affecting the viability of the host. We have developed a yeast membrane protein hyper-expression system with critical advantages over conventional, plasmid-based, expression systems. However, expression levels are sometimes so high that they adversely affect protein targeting/folding or the growth and/or phenotype of the host. Here we describe the use of small synthetic mRNA control modules that allowed us to predictably tune protein expression levels to any desired level. Down-regulation of expression was achieved by engineering small GC-rich mRNA stem-loops into the 5′UTR that inhibited translation initiation of the yeast ribosomal 43S
preinitiation complex (PIC).
Results:Exploiting the fact that the yeast 43S PIC has great difficulty scanning through GC-rich mRNA stem-loops, we created yeast strains containing 17 different RNA stem-loop modules in the 5′UTR that expressed varying amounts of the fungal multidrug efflux pump reporter Cdr1p fromCandida albicans. Increasing the length of mRNA stem-loops (that contained only GC-pairs) near the AUG start-codon led to a surprisingly large decrease in Cdr1p expression; ~2.7-fold for every additional GC-pair added to the stem, while the mRNA levels remained largely unaffected. An mRNA stem-loop of seven GC-pairs (ΔG =−15.8 kcal/mol) reduced Cdr1p expression levels by >99%, and even the smallest possible stem-loop of only three GC-pairs (ΔG =−4.4 kcal/mol) inhibited Cdr1p expression by ~50%.
Conclusion:We have developed a simple cloning strategy to fine-tune protein expression levels in yeast that has many potential applications in metabolic engineering and the optimization of protein expression in yeast. This study also highlights the importance of considering the use of multiple cloning-sites carefully to preclude unwanted effects on gene expression.
Keywords:mRNA stem-loops, Post-transcriptional regulation of gene expression, Inhibition of translation initiation, Yeast 43S preinitiation complex, Regulation of translation, Negative interactions of multiple cloning-sites
* Correspondence:[email protected]
Sir John Walsh Research Institute, University of Otago, Dunedin 9054, New Zealand
Background
Recent advances in synthetic biology and bioinformatics together with exponentially growing biological databases and the -omics revolution, especially transcriptomics and metabolomics, have increased the importance of yeast to industrial biotechnology [1,2].Saccharomyces cerevisiaeis a key eukaryotic model organism for fundamental molecular biology research, it was the first eukaryotic organism to have its entire genome sequenced [3], and it is also a common industrial microorganism used extensively in food and beverage production. These factors, together with its genetic tractability and its ability to grow at low pH, have made S. cerevisiaean attractive microorganism to be used as a chemical factory. Gibsonet al., 2008, have assembled the entire Mycoplasma genitalium genome in yeast [4], and Shao et al., 2009, used transformation-associated recombination to assemble entire metabolic pathways in one single step in yeast [5]. The list of non-natural bio-logical compounds successfully produced byS. cerevisiaeis diverse and ranges from protein drugs to fine and com-modity chemicals [1], advanced biofuels [6], the large family of benzylisoquinoline alkaloids [7] and many other secondary metabolites with a wide range of pharmaco-logical activities [2] including the successful production of high levels of artemisinin [8], a highly effective antimalarial.
Despite these significant advances in synthetic biology major challenges in the design of optimal metabolic path-ways remain. To obtain maximal yield, pathway flux needs to be optimized, and the accumulation of toxic intermedi-ates and the metabolic burden on the host minimized. Therefore, one of the key challenges of pathway engineering is the regulation of individual pathway enzymes for optimal activity [2]. Control of expression still relies heavily on regulatable, often plasmid-based, expression systems, but their use is largely limited to research and development only. Both regulatable promoters and plasmids require expensive synthetic media for their stable maintenance and controlled function (i.e. addition of inducers or repressors). In addition, many inducers exhibit disadvantageous pleiotropic effects [9,10] that affect other aspects of the cell’s biology and/or physiology that are often not well characterized and may lead to misinterpretations of the induced effects or negatively affect expression of foreign genes. Thus, an ideal production host requires expression modules stably integrated into the genome with each enzyme expression level individually optimized in a way that does not depend on regulatable promoters and the use of complex synthetic media. Alper et al., 2005, provided an elegant solution by creating constitutive promoter libraries inEscherichia coliandS. cerevisiaethat drove a wide (~1000-fold) dynamic range of protein pro-duction [11,12]. However, the lack of well-characterized promoters still provides a significant hurdle for pathway engineering in yeast.
Here we describe how we discovered a way to tune pro-tein production predictably in yeast. This was revealed dur-ing the development of a novel system for the constitutive expression of exceptionally high levels of functional heterologous membrane proteins in S. cerevisiae. The expression system consists of plasmid pABC3 and derivative plasmids and the S. cerevisiae hosts AD1-8u -and its close relative ADΔ[13,14]. Both strains are deleted in seven ABC transporters, which makes them exquisitely sensitive to a wide range of xenobiotics [15,16], and the transcription factor PDR3. They also contain the gain-of-function mutant transcription factor Pdr1-3p, that drives the hyper-expression of heterologous ORFs from single-copy genes stably integrated at the genomic
PDR5locus [13-15,17]. This system has several advantages over other, plasmid-based, expression systems: i) significant cost savings for large-scale protein production, as there is no need for expensive synthetic media for the maintenance of plasmids; ii) robust, highly reproducible, phenotypes and homogenous cell populations; and iii) improved homogeneity of the expressed protein. The objective of this study was to develop a strategy to down-regulate these constitutively over-expressed proteins in a way that avoids the potential disadvantages of existing regulatory systems. When we tried to improve the cloning efficiency of large (7~kb) expression modules by replacing all hexamer cutting sites of the multiple cloning-site (MCS) of pSK-PDR5-PPUS [15] with rare 8 bp cutting sites we noticed that inclusion of the GC-richSfiI site reduced protein expression levels ~8-fold. This forced us to use a single AT-rich 8 bp cutting site (PacI) for efficient cloning of the 5′end of heterologous ORFs in plasmid pABC3 [14] - thus indicating, as shown by Crook et al., 2011 [18], that MCSs can be far from benign cloning tools.
that determines its degree of inhibition of protein expression/translation in mammalian cells.
In this study we created 17 systematically modified mRNA stem-loop constructs in front of the C. albicans
multidrug efflux pump reporter Cdr1p ORF which revealed minimal features necessary for effective repression of pro-tein expression in yeast. Stem-loops of mixed A/U- and G/C-pair containing stems inhibited Cdr1p expression less predictably. However, Cdr1p expression controlled by mRNA stem-loops comprising stems containing only GC-pairs was highly predictable and decreased exponen-tially with the number of GC-pairs in the stem. Even the smallest stem-loop stem of 3 GC-pairs inhibited Cdr1p expression by ~50%. Additional fine-tuning of expression could be achieved by varying the size of the loop. The degree of translation inhibition by individual mRNA stem-loop modules appeared an intrinsic feature that was independent of: i) sequence context; ii) the host yeast strain; iii) the growth medium; iv) the pH and carbon source of the growth medium; v) steady-state mRNA levels; and vi) they also appeared independent of the growth stage of cells. The stable and predictable tuning of protein expression, with a large dynamic range, from a single promoter by well-defined, small, GC-rich mRNA stem-loops near the AUG start codon provides a simple and very powerful tool for optimal pathway engineering and syn-thetic biology in yeast. It also provides important clues for an improved understanding of the molecular mechanism of AUG start codon scanning of the yeast 43S PIC.
Results
AnSfiI cloning site 5′proximal to the ATG start-codon severely affects gene expression levels in yeast
We have created an efficient system for the heterologous over-expression of fully functional membrane proteins in the uniquely modified S. cerevisiae host AD1-8u- (AD) [14,15,17]. The list of successfully over-expressed membrane proteins includes important multidrug efflux pumps from a range of yeast species (e.g. S. cerevisiae Pdr5p,
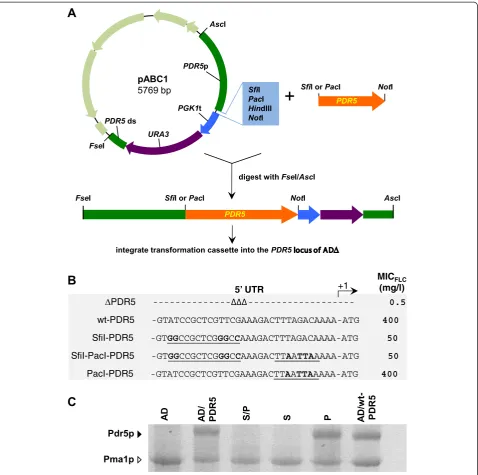
C. albicans Cdr1p and Cdr2p, Candida glabrata Cdr1p and Pdh1p, Candida krusei Abc1p and Cryptococcus neoformans Mdr1p [14,15]). The original expression sys-tem used the cloning vehicle pSK-PDR5-PPUS [15]. In an effort to improve the cloning efficiency for large genes such as fungal ATP-binding cassette (ABC) multidrug ef-flux pumps, pSK-PDR5-PPUS was modified to contain a range of conveniently positioned rare, 8 bp, restriction en-zyme cloning sites (plasmid pABC1; Figure 1A). However, whenPDR5was cloned either as anSfiI/NotI orPacI/NotI fragment into pABC1 (Figure 1A) there was an unexpect-edly weak drug (fluconazole [FLC]) resistance phenotype conferred on host AD after integration of the transform-ation cassette into the genomic PDR5 locus (compare MICFLCof AD/wt-PDR5 (400 mg/l) with AD/S-PDR5 and
AD/SP-PDR5 (50 mg/l; Figure 1B)). This severely re-duced drug resistance phenotype was reflected in dra-matically reduced Pdr5p expression levels (Figure 1C).
Further tests showed that it was actually the SfiI site with just 5 nucleotide changes to the 5′ UTR of PDR5
that caused these ~8-fold reduced protein expression levels. This was confirmed by creating a set of PDR5
over-expressing strains that had only the SfiI, the SfiI/
PacI, or thePacI cloning sites in their 5′UTRs: the rest of the PDR5 locus was unchanged. Strain AD with the entire wt PDR5 locus restored (AD/PDR5) was also created and served as a positive control. All AD derivative strains that had either a wtPDR5 5′UTR, or strains that contained the PacI site, had high Pdr5p expression levels (MICFLC = 400 mg/l; Table 1), but strains that contained theSfiI site at position−18 relative to the ATG start codon had ~8-fold reduced MICFLC(50 mg/l; Table 1). This also clearly demonstrated that replacing the 3′ UTR of PDR5
with thePGK1terminator followed by theURA3selection marker did not affect Pdr5p expression (Table 1). Based on these results we hypothesized that the unusual nature of theSfiI cloning site (SfiI = GGCCNNNNNGGCC) allowed the formation of a small, but stable, GC-rich, mRNA stem-loop 5′ proximal to the AUG start-codon that may have inhibited Pdr5p translation.
We therefore created plasmid pABC3, without the
SfiI site, which then enabled efficient cloning and maximal levels of expression of heterologous ORFs [14]. Clearly, as also demonstrated by Crook et al., 2011 [18], MCSs are not just benign and convenient cloning tools but they can dramatically affect protein production in yeast, and sites with high GC content 5′ proximal to the ATG start codon should be used with caution. As the ability to reduce gene expression could be of use to us, we investigated the effect of the SfiI site on Cdr1p expression.
Inhibition ofPDR5expression by theSfiI cloning site is independent of its position, the host in which it is expressed, its sequence context, and growth conditions
Sec6p is part of the soluble eukaryotic exocyst complex that is required for the polarized transport of late post-Golgi secretory vesicles and their fusion with the plasma membrane. We created a temperature sensitive mutant in AD (AD/sec6-4) that enabled cells over-expressing Cdr1p to accumulate intact, late post-Golgi, secretory vesicles loaded with large amounts of mature Cdr1p after shifting the growth temperature for 2 h to the non-permissive temperature of 37°C [26]. Over-expression of different
5’ UTR
MICFLC (mg/l)
+1
PDR5 --- --- 0.5
wt-PDR5 -GTATCCGCTCGTTCGAAAGACTTTAGACAAAA-ATG 400
SfiI-PDR5 -GTGGCCGCTCGGGCCAAAGACTTTAGACAAAA-ATG 50
SfiI-PacI-PDR5 -GTGGCCGCTCGGGCCAAAGACTTAATTAAAAA-ATG 50
PacI-PDR5 -GTATCCGCTCGTTCGAAAGACTTAATTAAAAA-ATG 400
Figure 1TheSfiI restriction enzyme cloning site severely inhibits gene expression in yeast. A.A schematic diagram of the cloning strategy used to over-express heterologous ORFs inS. cerevisiae.PDR5(orange) was cloned asSfiI/NotI orPacI/NotI fragments into pABC1 (the pBluescriptIISK(+) vector backbone is light green and the multiple cloning site of the transformation cassette light blue). pABC1-PDR5 was digested withFseI andAscI to release the 7.4 kb transformation cassette [PDR5promoter (green)-ORF (orange)-PGK1terminator (blue)-URA3 marker (purple)-PDR5downstream region (green)]. The transformation cassettes were gel purified and used to transformS. cerevisiaeAD to Ura+.B.Effect of 5′UTR on Pdr5p activity. Strains expressing Pdr5p were created either using pABC1 (SfiI-PDR5, SfiI-PacI-PDR5) or pABC3
(PacI-PDR5), as previously described [14], andΔPDR5 (AD) and wt-PDR5 (AD124567u-) were used as negative (0% Pdr5p expression) and positive
(100% Pdr5p expression) controls, respectively. The 32 nucleotides upstream of the ATG start-codon for each construct are shown.SfiI andPacI restriction sites are underlined and the nucleotides that differ from the wild-typePDR55′UTR are shown in bold type. The right hand column lists the MICFLCvalues for the strains. The MICFLCvalues for three independent transformants were measured and did not vary by more than one
using either pABC3 or pABC1 to over-express Cdr1p, the over-expression of which is often associated with multidrug resistance of the fungal pathogen C. albicans [27,28]. As with Pdr5p, theSfiI-site caused a severe reduction (~4-fold) of the FLC resistance phenotype of AD/S-CDR1-URA3 compared to ADΔ/P-CDR1-URA3 cells (Table 2). In-terestingly, the FLC resistance of ADΔ/P-CDR1-URA3 (MICFLC = 200 mg/l) was also ~6-times higher than AD1002 (MICFLC = 30 mg/l) - the original CDR1 over-expressing strain that was created using pSK-PDR5-PPUS [15]. AD1002 contained seven hexamer cloning sites (5′ HindIII, EcoRV, EcoRI, PstI, SmaI, BamHI, SpeI 3′) 5′proximal to theCDR1ATG start codon [15]. Expressing two other ORFs (C. albicansmultidrug efflux pumpCDR2 AandB alleles [29]) as eitherPacI orSfiI fragments gave similar results. The SfiI-site reduced the expression of
CDR2A ~6-fold and the expression of CDR2B ~8-fold
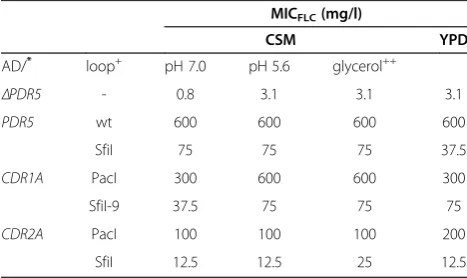
(Table 2). These results clearly demonstrated that the degree of inhibition (<4-8-fold) of expression by theSfiI-site was also largely independent of the adjacent ORF sequence. The inhibition of Pdr5p, Cdr1Ap and Cdr2Ap expression by theSfiI-site was also unaffected by changing the pH of the growth medium, replacing glucose with non-fermentable glycerol as a carbon source or replacing the synthetic CSM with the complex YPD growth medium (Table 3). And creating ADΔ/SfiI(−4)-CDR1 with the SfiI-site positioned at −4 instead of −18 (AD/S-CDR1-URA3) relative to the ATG start-codon showed that inhibition of Cdr1p expression by theSfiI-site was also independent of its position in the 5′UTR near the ATG start codon (Table 2).
TheSfiI-site in the 5′UTR near the ATG start codon inhibits translation and increases steady-state mRNA levels
To ascertain whether the reduced expression of Pdr5p in strains containing theSfiI-site was due to reducedPDR5
mRNA levels or whether the SfiI-site inhibited transla-tion of Pdr5p, Northern blot analysis of late-logarithmic cells (grown in CSM and harvested at OD600 = 5) was performed on AD and AD/sec6-4 cells over-expressing different PDR5mRNA-constructs (Figure 2). Two wild-type control strains (AH22 and SY1) and the negative (ΔPDR5) control strain AD/pABC3 were also included, and the housekeeping geneACT1was used as an internal standard.PDR5mRNA levels, normalized forACT1, were very low (~2-4%) in AH22 and SY1 (without Pdr1-3p) and, as expected, no PDR5 mRNA was detectable for AD/pABC3 (Figure 2A and B). Interestingly though, normalizedPDR5mRNA levels were ~10-times higher in AD (55-125%) than in AD/sec6-4 (4.2-17%; Figure 2B), although expression of Pdr5p was the same in either
Table 2 Effects ofPDR55′UTR on Cdr1p and Cdr2p expression
AD/+ PDR55′UTR++ MICFLC(mg/l)
CDR1A PacI 200
SfiI 50
SfiI(−4) 50
CDR2A+++ PacI 120
SfiI 20
CDR2B+++ PacI 240
SfiI 30
+
AD strains containing the indicated ORFs followed by thePGK1terandURA3 marker.
++
Nucleotide changes to thePDR55′UTR just upstream of the ATG start codon (SfiI(−4) = CDR1-construct #1).
+++
The two alleles ofCDR2fromC. albicansATCC 10261.
Table 3 Effects of growth conditions on Pdr5p, Cdr1p, and Cdr2p expression
MICFLC(mg/l)
CSM YPD
AD/* loop+ pH 7.0 pH 5.6 glycerol++
ΔPDR5 - 0.8 3.1 3.1 3.1
PDR5 wt 600 600 600 600
SfiI 75 75 75 37.5
CDR1A PacI 300 600 600 300
SfiI-9 37.5 75 75 75
CDR2A PacI 100 100 100 200
SfiI 12.5 12.5 25 12.5
*
ΔPDR5= AD;PDR5: wt = AD/PDR5 and S = AD/S-PDR5;CDR1A: PacI = ADΔ/P-CDR1-URA3 andSfiI-9 = ADΔ/construct-9-CDR1;CDR2A: PacI = AD/P-CDR2A-URA3 andSfiI = AD/S-CDR2A-URA3 (Table5).
+
Nucleotide changes to thePDR55′UTR just upstream of the ATG start codon.
++
Glycerol instead of glucose in the CSM. Table 1 Effects ofPDR55′UTR and transcription terminator
on Pdr5p expression in yeast strains AD and AD-sec6-4 MICFLC(mg/l)
PDR55′UTR AD AD sec6-4
Δ 0.6 0.6
WT 400 400
PacI 400 400
SfiI 50 50
SfiI/PacI 50 50
PacI 400 400
SfiI 50 nd
SfiI/PacI 50 50
+Δ
PDR5(top) = AD1-8u
-. The strains underneath contain either the entire wt PDR5gene (WT) or were modified in their 5′UTRs just upstream of the ATG start codon to create the restriction sites indicated in the neighbouring column. The strains in the bottom three rows are identical to the strains above except that thePGK1terandURA3marker were placed between the ORF and thePDR5terminator.
genetic background (Table 1). Indeed the PDR5 mRNA levels of the wt- and PacI-site containing constructs in AD/sec6-4 were very similar to those in SY1 and AH22 (Figure 2B). However, despite these significant differences in mRNA levels of PDR5 in AD/sec6-4 and AD which could be due to the different transcription terminators, the levels in all SfiI-site containing constructs were reproducibly 2-4-times higher than in their respective
PacI (Figure 2C and D) or WT (Figure 2C) constructs, possibly due to an mRNA-stabilizing effect. This effect was independent of the amount of mRNA present in the cell:
PDR5 mRNA levels were ~3-times higher for the SfiI-site containing constructs when cells (AD/sec6-4/PDR5, AD/sec6-4/P-PDR5 and AD/sec6-4/S-PDR5) were har-vested either at early-log (2.5-times higher), late-log (3.4-times higher), or stationary growth phase (2.9-times higher; Additional file 1: Figure S1E), even though thePDR5
mRNA levels were ~10-times higher in early-log than late-log or stationary phase cells (Additional file 1: Figure S1C).
These results clearly demonstrated that the SfiI-site 5′ proximal to the AUG start codon inhibited translation of Pdr5p in the presence of a ~3-fold increase in PDR5
mRNA levels that was independent of: i) steady-state mRNA levels; and ii) the growth stage of cells.
TheSfiI mRNA stem-loop provides a strong physical barrier for the yeast translation initiation machinery
To analyze the inhibitory effect of theSfiI mRNA stem-loop on the expression of Cdr1p in more detail, and to ascertain whether we could predictably tune expression by modifying mRNA stem-loop structures positioned at−4 relative to the AUG start codon, we created Cdr1p-expressing yeast strains with 17 different, systematically modified, GC-rich mRNA stem-loops near the AUG start codon. A detailed description of the strategy employed to create these different mRNA species is given in the Materials and Methods section, and a schematic illustration can be found in Additional file 2: Figure S2.
A
RNA
PDR5
ACT1
PDR5 long exp.
B
pA
BC3
AD/sec6-4 AD
C
D
AD/sec6-4 AD
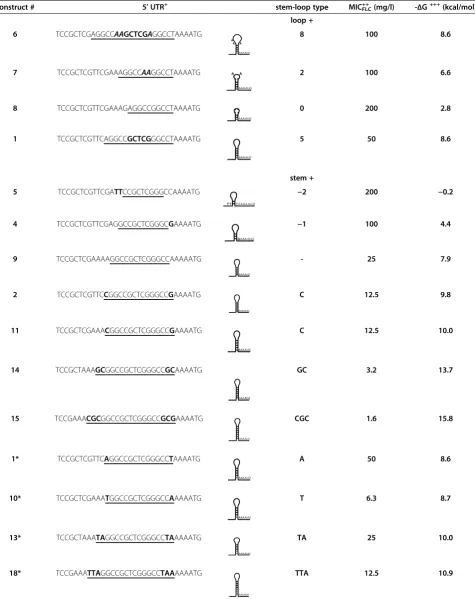
In order to establish whether the SfiI mRNA stem-loop per se or a specific SfiI mRNA stem-loop-recog-nizing protein caused the inhibition of translation, we systematically modified the size of the stem and the size of the loop of the hypothetical SfiI mRNA stem-loop in front of the AUG start codon and quantified the effects. mRNA secondary structure predictions and calculation of their thermodynamic stabilities (Table 4) were determined with the Mfold web server [31]. Increasing the size of the hypotheticalSfiI loop from 5 nucleotides (GCUCG, construct 1) to 8 (AAGCU CGA, construct 6) or decreasing it to 2 nucleotides (AA, construct 7) caused only moderate (~2-fold) increases in their respective MICFLC values (Table 4). Only the complete elimination of the loop (construct 8) re-stored wt-Cdr1p expression levels (Table 4). Slightly increasing the thermodynamic stability of the SfiI stem-loop of construct 1 by replacing an AU-pair with a GC-pair in construct 2 (ΔG = −9.8 vs. -8.6 kcal/mol) caused a further ~4-fold reduction of Cdr1p expression (Table 4) while reducing the size of the stem from five (construct 2) to two GC-pairs (con-struct 5) eliminated any possible secondary (con-structure and resulted in wt-Cdr1p expression levels (Table 4). Construct 4, however, with a stem of only 3 GC-pairs (ΔG = −4.4 kcal/mol), was still able to inhibit Cdr1p expression by ~50% (Table 4).
These results were consistent with an SfiI site at −4 that forms a GC-rich mRNA stem-loop which provides a strong physical barrier for the yeast ribosomal AUG start codon scanning machinery.
FLC resistance levels are an accurate measure for the amounts of Cdr1p expressed
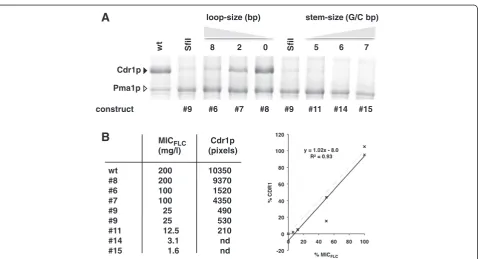
To confirm that FLC resistance levels can be used as an accurate measure for the amount of Cdr1p expressed, we isolated plasma membranes from a representative set of strains and compared their MICFLC values with the amount of Cdr1p expressed (Figure 3). A plot of the amount of Cdr1p expressed and the measured FLC re-sistance level for seven of these constructs (including the MICFLC value for the negative control strain AD; MICFLC= 0.5 mg/l) showed that there was a strong lin-ear correlation (R2= 0.93; Figure 3B; construct 6 (4 GC-pairs stem plus 8 bp loop; MIC = 100 mg/l) appeared to be an outlier due to the 50% margin of error intrinsic to the way MIC values were measured). This confirmed that the MICFLC values of different Cdr1p expressing strains could be used as a simple measure for Cdr1p ex-pression levels. The data also seemed to suggest that all Cdr1p molecules were fully functional and contributed equally/additively to FLC transport even when expressed at levels as high as ~30% of total plasma membrane protein.
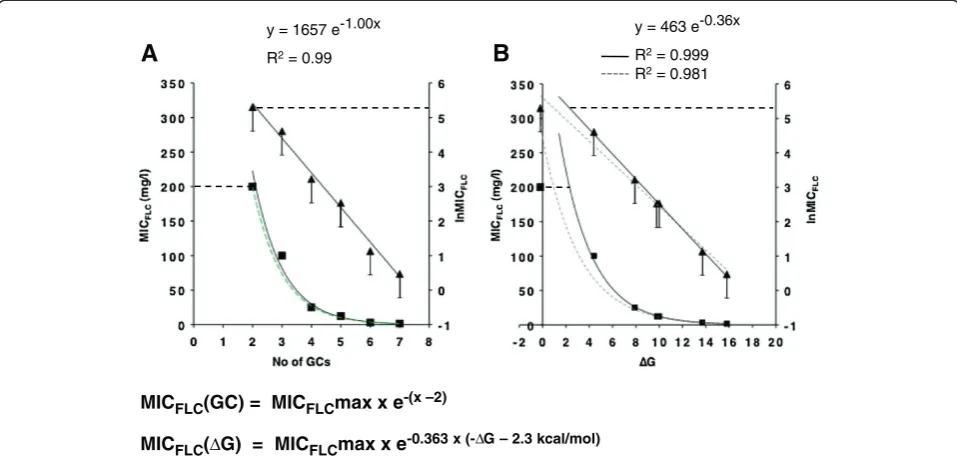
Cdr1p expression levels reduce exponentially with the number of GC-pairs in mRNA stem-loop stems containing only GC-pairs
The step-wise increase in GC-pairs of the ‘core’ SfiI mRNA stem-loop stem (construct 9; Table 4) led to a remarkably consistent decrease in Cdr1p expression: constructs 2 and 11 (+1 GC-), 14 (+2 GC-) and 15 (+3 GC-pairs) each expressed ~50-75% less Cdr1p than the previous construct (Figure 4A and Table 4).
Surprisingly, the MICFLCvalues decreased exponentially with the number of GC-pairs in mRNA stem-loop con-structs containing only GC-pairs (Figure 4A). Even the two smallest 2 and 3 GC-pairs stem constructs 5 and 4 fit well (R2 = 0.99) onto the black exponential trend lines (Figure 4A). This was even more remarkable given the 50% margin of error that was intrinsic to the way MICFLC values were determined (see‘error’bars in Figure 4).
There was also a clear exponential relationship between the thermodynamic stabilities of these constructs and their MICFLCvalues (R2= 0.98; dashed grey trend lines in Figure 4B). However, in this case the variance decreased when the data point for the smallest, 2 GC-pairs, stem-loop construct 5 was excluded (R2 = 0.999; black trend lines in Figure 4B).
The exponential dependency of Cdr1p expression levels (MICFLC) for cells with mRNA stem-loops containing only GC-pairs with stems≥3 GC-pairs on either: i) the number of GC-pairs (MICFLC(GC)); or ii) the thermodynamic stabilities (MICFLC(ΔG)) of these constructs could be expressed as the formulae shown at the bottom of Figure 4 (x is the number of GC-pairs). The dashed green trend line in Figure 4A represents the calculated trend line for these constructs (assuming a MICFLCmax = 200 mg/l). It matched the experimentally determined results (black trend line) exceptionally well.
We conclude that even an mRNA stem-loop of 3 GC-pairs is biologically active and able to provide a relatively strong physical barrier for the yeast 43S PIC.
SfiI mRNA stem-loop stems of mixed AU/GC-pair stems
Table 4 Effects of modifying the coreSfiI stem-loop sequence (GGCCGCTCGGGCC; modifying the size of the stem and the loop) at position−4 to the ATG start codon on the expression of Cdr1p
construct # 5′UTR+ stem-loop type MICFLC++ (mg/l)
-ΔG+++(kcal/mol) loop +
6 TCCGCTCGAGGCCAAGCTCGAGGCCTAAAATG 8 100 8.6
7 TCCGCTCGTTCGAAAGGCCAAGGCCTAAAATG 2 100 6.6
8 TCCGCTCGTTCGAAAGAGGCCGGCCTAAAATG 0 200 2.8
1 TCCGCTCGTTCAGGCCGCTCGGGCCTAAAATG 5 50 8.6
stem +
5 TCCGCTCGTTCGATTCCGCTCGGGCCAAAATG −2 200 −0.2
4 TCCGCTCGTTCGAGGCCGCTCGGGCGAAAATG −1 100 4.4
9 TCCGCTCGAAAAGGCCGCTCGGGCCAAAAATG - 25 7.9
2 TCCGCTCGTTCCGGCCGCTCGGGCCGAAAATG C 12.5 9.8
11 TCCGCTCGAAACGGCCGCTCGGGCCGAAAATG C 12.5 10.0
14 TCCGCTAAAGCGGCCGCTCGGGCCGCAAAATG GC 3.2 13.7
15 TCCGAAACGCGGCCGCTCGGGCCGCGAAAATG CGC 1.6 15.8
1* TCCGCTCGTTCAGGCCGCTCGGGCCTAAAATG A 50 8.6
10* TCCGCTCGAAATGGCCGCTCGGGCCAAAAATG T 6.3 8.7
13* TCCGCTAAATAGGCCGCTCGGGCCTAAAAATG TA 25 10.0
Table 4 Effects of modifying the coreSfiI stem-loop sequence (GGCCGCTCGGGCC; modifying the size of the stem and the loop) at position−4 to the ATG start codon on the expression of Cdr1p(Continued)
12* TCCGCTAAAGAGGCCGCTCGGGCCTCAAAATG GA 6.3 12.4
17* TCCGAAATGAGGCCGCTCGGGCCTCAAAAATG TGA 3.2 13.2
16* TCCGAAACGAGGCCGCTCGGGCCTCGAAAATG CGA 6.3 14.5
+
All stem-loop sequences are underlined. Loop nucleotides of theSfiI stem-loop constructs with different size loops (top) are highlighted in bold type and nucleotide changes made to modify the size of the stem (bottom) of the coreSfiI stem-loop are also highlighted in bold type letters. Numbers at the top panel indicate the size of the loop; a–sign followed by a number indicates by how many nucleotide pairs the coreSfiI stem-loop stem was reduced and letters indicate the nucleotide sequence of the left arm of the nucleotide pairs with which the coreSfiI stem-loop had been increased.
++
MICFLCvalues represent the MICFLCvalues of three independent transformants and they were practically identical for all constructs tested. +++
ΔG values calculated for individualSfiI stem-loops (underlined sequences).
*SfiI stem-loop constructs of different size stems containing mixed AU- and GC-pairs.
SfiI 8 2 0 5 6 7
wt SfiI
loop-size (bp)
Cdr1p
Pma1p
stem-size (G/C bp)
#9 #6 #7 #8 #9 #11 #14 #15
construct
MICFLC Cdr1p
(mg/l) (pixels)
wt 200 10350
#8 200 9370
#6 100 1520
#7 100 4350
#9 25 490
#9 25 530
#11 12.5 210
#14 3.1 nd
#15 1.6 nd
A
B
Figure 3Drug resistance levels (MICFLC) of Cdr1p-expressing strains are directly proportional to the amount of Cdr1p expressed. A. SDS-PAGE of plasma membrane proteins (30μg) isolated from ADΔstrains containing differentSfiI stem-loop constructs. The black arrowhead indicates Cdr1p and the white arrowhead indicates the prominent plasma membrane proton pump protein Pma1p. wt = ADΔ/P-CDR1-URA3; SfiI = ADΔ/ construct9-CDR1; lanes labeled 8, 2 and 0 represent Cdr1p expressing strains with decreasing loop-size of 8 nucleotides (ADΔ/construct6-CDR1), 2 nucleotides (ADΔ/construct7-CDR1) or no loop at all (ADΔ/construct8-CDR1); lanes labeled 5, 6 and 7 represent strains with increasing stem-size of 5 GC-pairs (ADΔ/construct11-CDR1), 6 GC-pairs (ADΔ/construct14-CDR1) and 7 GC-pairs (ADΔ/construct15-CDR1).B.The MICFLCvalues for each construct
correlated well with the amounts of Cdr1p expressed (measured as pixels using the ImageJ software [30]). %CDR1 (Y-axis) and %MICFLC(X-axis) are the
expression levels and MICFLCrelative to wt Cdr1p. To the right is a graphical illustration of this correlation (constructs #14 and #15 were excluded from the
graph because their Cdr1p expression was below the detection limit but the MICFLC= 0.5 of the negative control strain AD (no Cdr1p) was included), and
reduction of Cdr1p expression compared with construct 9 (Table 4). Clearly, the presence of additional AU-pairs in GC-rich stem-loops (constructs 1, 10, 12, 13, 16, 17 and 18; Table 4) led to less predictable Cdr1p expression levels and their effects appeared to be dependent on the surrounding mRNA sequence unlike mRNA stem-loops containing only GC-pairs whose inhibitory effects re-mained unaffected by the surrounding mRNA sequence (e.g. constructs 2 and 11 had identical MICFLC values although they contained the same nucleotide variations as constructs 1 and 10; Table 4).
A practical application of GC-rich mRNA stem-loops for high-throughput drug screening
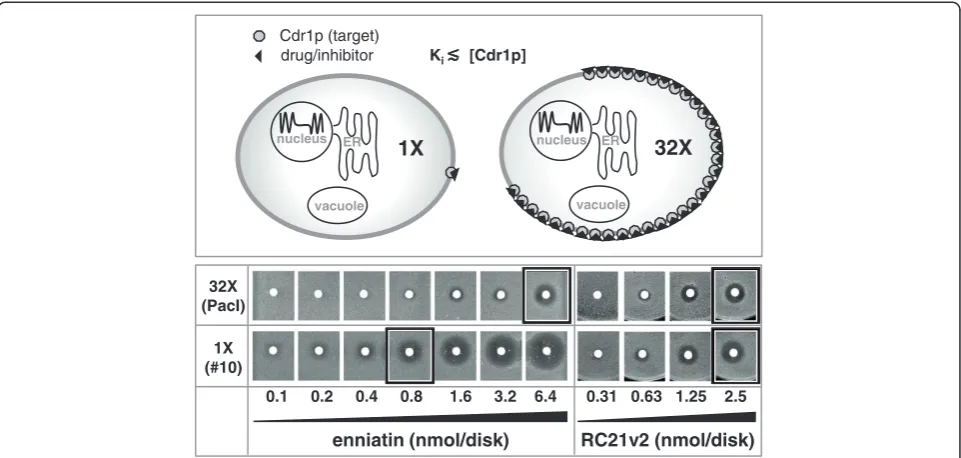
The ability to stably express heterologous genes at different levels has exciting applications in drug screening. Yeast provides a good platform for high-throughput drug screen-ing due to its genetic tractability, its fast growth rate, its scalability, and its ability to grow on relatively inexpensive growth media. Screening large compound libraries can yield high numbers of false positive hits. One way to reduce the number of false positive hits would be to perform second-ary screens with two additional strains: i) a negative control
strain that does not express the target to identify false posi-tive hits caused by general toxicity of the compound; and ii) a strain that expresses significantly lower amounts of the target protein (e.g. ~32 times less; Figure 5; top panel) to increase the success rate for identifying positive hits that inhibit the target protein with highest efficiency (i.e. preferred hits). Growth inhibition of a strain that expresses ~32 times less of an essential target would (in theory) require ~32 times less of a highly effective compound (compound has high affinity to the target) but similar amounts of a less effective (low-affinity) compound. This is because high-affinity inhibitors (i.e. Ki ≪ target concentration [E]; Figure 5), unlike low affinity inhibitors (Ki ≧ [E]), do not follow the typical Michaelis-Menten kinetics.
We demonstrated how such a screen may be used to distinguish between a strong, target-specific, inhibitor of efflux pump Cdr1p, enniatin [32], and RC21v2 [33], a weaker Cdr1p-specific D-octapeptide inhibitor (Figure 5). CSM agar plates contained FLC at concentrations of ¼ the MICFLC of the test strains so that each strain was able to grow and cells accumulated similar amounts of FLC. The assumption that the test strains accumulate
A
B
y = 1657 e-1.00x
R2= 0.99
y = 463 e-0.36x
R2= 0.999 R2= 0.981
MICFLC(GC) = MICFLCmax x e-(x –2)
MICFLC MICFLCmax x e-0.363 x (- – 2.3 kcal/mol)
Figure 4Cdr1p expression levels decrease exponentially with an increase in the number of GC-pairs in stems containing only GC-pairs 5′proximal to the AUG start-codon. A.The relationship between MICFLCvalues of Cdr1p-expressing strains and the number of GC-pairs in
stems containing only GC-pairs. Black squares represent MICFLCvalues and black triangles represent the lnMICFLCvalues plotted against the
number of GC-pairs in stem-loop constructs. The two black lines represent the trend lines for the best fit of these two data sets (‘error’bars indicate the possible range of MICFLCvalues of individual constructs; see text for further details). The horizontal black dashed lines mark the
MICFLCmax values of wild type Cdr1p-expressing cells. The green dashed trend line is the trend line that was created with the calculated MICFLC
values for stem-loop constructs containing only GC-pairs using the formula shown underneath.B.The relationship between MICFLCvalues of
Cdr1p-expressing strains and the calculatedΔG values for stems containing only GC-pairs. The same symbols as inAwere used. The dashed grey lines are the trend lines for the best fit including the data point for the construct containing 2 GC-pairs, while the two black lines represent the trend lines for the best fit of the data sets excluding that data point. The formula that can predict the MICFLCvalues for stem-loop constructs
containing only GC-pairs using their calculatedΔG values is shown underneath. All MICFLCvalues are the values for three independent
similar amounts of intracellular FLC is based on the fact that the FLC drug target Erg11p is located inside the cell in the endoplasmic reticulum and that, while the test strains differ in the amounts of Cdr1p expressed, they express the same, or very similar, amounts of Erg11p and therefore require the same, or very similar, intracel-lular concentrations of FLC to inhibit its essential func-tion. Conducting the experiment in this way ensured that Cdr1p inhibition was directly dependent on the amount of inhibitor used. Two-fold increasing amounts of enniatin or RC21v2 were put on filter disks and the disks were placed onto plates seeded with a lawn of either of the two strains (Figure 5). After incubating the plates at 30°C for two days growth inhibitory zones appeared, the sizes of which were used as an indication of the level of Cdr1p inhibition. wt-CDR1 expressing cells required ~8-16 times more enniatin thanCDR1-construct 10 expressing cells whereas both Cdr1p-expressing strains required similar amounts of the weaker inhibitor RC21v2 to inhibit cell growth to the same degree (Figure 5).
Discussion
Our host strain ADΔis deleted in seven ABC transporters [13] and therefore exquisitely sensitive to many xe-nobiotics [14,15]. The overexpression of Cdr1p led to a ~400-fold increase in FLC resistance. We exploited
this large dynamic range of FLC susceptibilities as a very sensitive and robust tool to analyze the effects
of varying mRNA stem-loops 5′ proximal of the
AUG start-codon on the efficiency of Cdr1p translation in yeast.
A number of studies have shown that small, GC-rich, mRNA stem-loops placed into 5′UTRs of yeast genes have strong inhibitory effects on their expression levels [19-24]. This effect was exhibited at the level of translation (mRNA levels were mostly unaffected and varied no more than 2–4 fold [19,22,24]) and was largely independent of gene context and the promoter used. The inhibitory effects of individual mRNA stem-loops were comparable to some of our Cdr1p stem-loop constructs (Table 4): e.g. i) a −10.5 kcal/mol mRNA stem-loop (GAATTCCCATCTTGGGAATTC; stem nucleotides are in italics) positioned 21 nt upstream of the AUG start-codon of the GCN4-lacZ reporter plasmid reduced the β-galactosidase activity to 13% [20]; and ii) a−8.5 kcal/mol mRNA stem-loop (TGAATTCGTTAACG AATTCA) right next to the AUG start codon of theCYC1
gene (this construct was integrated into theCYC1locus) reduced iso-1-cytochrome c expression to 10% [19]. Most other mRNA stem-loops tested were of higher stabilities (<−20 kcal/mol) and inhibited reporter gene expression (e.g. endogenous CYC1 and HIS4 genes or the plasmid-encoded chloramphenicol acetyl transferase (cat) reporter) 0.1 0.2 0.4 0.8 1.6 3.2 6.4
enniatin (nmol/disk)
32X (PacI)
1X (#10)
vacuole vacuole
1X
32X
nucleus ER nucleus ER
Cdr1p (target) drug/inhibitor
0.31 0.63 1.25 2.5
RC21v2 (nmol/disk)
Ki [Cdr1p]
Figure 5Demonstration of Cdr1p target concentration-dependent chemosensitization to enniatin and RC21v2.The top panel illustrates the theoretical assumption that 32 times more of a high-affinity Cdr1p inhibitor (Ki≪[Cdr1p]) is required to inhibit a strain that expresses 32
times more Cdr1p. Yeast strains ADΔ/P-CDR1-URA3 (32X, top row) and ADΔ/construct10-CDR1 (1X, bottom row) were used to test this theory. CSM agar plates contained [FLC] = ¼ MICFLCof these two test strains (Table 4). Filter disks containing 0.1 - 6.3 nmol of enniatin or 0.3 - 2.5 nmol
to <1% or completely undetectable levels causing histidine auxotrophy for someHIS4constructs [19,21,24].
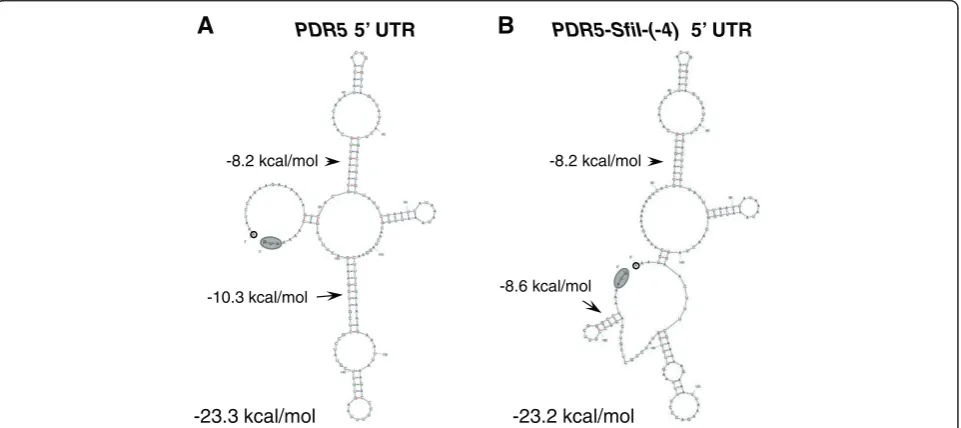
However, our studies demonstrate for the first time that small GC-rich mRNA stem-loops placed 5′proximal to the AUG start-codon can be used as an efficient tool to ‘ pre-dictably’ down-regulate protein expression levels in yeast whereas the degree of inhibition of mRNA stem-loops of mixed G/C and A/U pairs was less predictable. Figure 6 shows representative secondary structures predicted for the wild-type and the SfiI-site containing 5′ UTRs of PDR5. All 34 possible secondary structures for the
SfiI-containing construct predicted the presence of the−8.6 kcal/mol GC-rich mRNA stem-loop (Figure 6B) but the structures for the rest of the molecule varied sig-nificantly (data not shown). This −8.6 kcal/mol GC-rich
SfiI mRNA stem-loop was also predicted for all possible secondary structures that included the 5′ part of CDR1
(data not shown), indicating that the surrounding mRNA sequence has little effect on the possible formation of small, GC-rich, mRNA stem-loops. We experimentally verified sequence context independence of the inhibitory effects of this SfiI mRNA stem-loop by expressing four different ORFs (PDR5,CDR1,CDR2AorCDR2B) and using two different terminators (PGK1orPDR5terminator) with similar results. The inhibitory effects of the SfiI mRNA stem-loop were also independent of the host in which they were expressed or any changes to the growth medium. Interestingly, Northern blot analysis revealed that theSfiI mRNA stem-loop increased (~3-fold) the steady-state
mRNA levels of PDR5. This increase was observed in different strain backgrounds and in cells harvested at different growth stages. Thus, it seemed that the GC-rich mRNA stem-loop had increased the stability (i.e. half-life) of the mRNA. Sagliocco et al., 1994, made similar observations for acatreporter transcript that contained a strong (ΔG =−23.2 kcal/mol) GC-rich mRNA stem-loop (the stem had 8 consecutive GC-pairs) placed in its 5′ UTR which inhibited its translation by ~99% but increased its mRNA half-life ~3-fold [34]. However, further investigations revealed no obvious correlation between the translatability of different stem-loop constructs and their half-life [34].
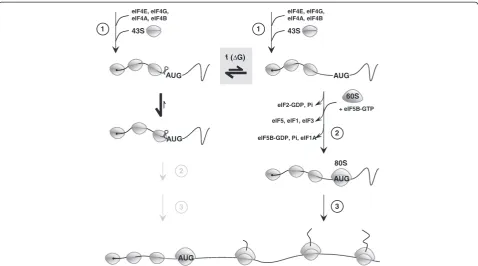
The vast amount of literature on translation initiation in yeast and higher eukaryotes (a schematic illustration is given in Figure 7 and reviews can be found in [36-38]) combined with our own observations reveal important insights into the possible molecular mechanism of inhib-ition of translation by GC-rich mRNA stem-loops in yeast. A first important clue derives from studies by Sagliocco
et al., 1993, who clearly demonstrated that any mRNA reporter that carried a strong 5′-secondary structure had a biphasic polysome distribution one mRNA pool that was actively translated and heavily loaded with ribosomes while the majority of mRNA molecules had only the 43S PIC bound [23]. And secondly, studies have shown that the 43S PIC is extremely tightly bound to the mRNA
in vivo [39]. This together with our own observations (i.e. inhibition of AUG start codon scanning by small
PDR5 5’ UTR
A
-10.3 kcal/mol -8.2 kcal/mol
-23.3 kcal/mol
PDR5-SfiI-(-4) 5’ UTR
B
-23.2 kcal/mol -8.2 kcal/mol
-8.6 kcal/mol
stem-loops is directly proportional to the predicted thermodynamic stability (f(ΔG); grey boxed-in area) of
stem-loop stems consisting of GC-pairs only) is strongly suggestive of the following model of AUG start codon scanning of the yeast 43S PIC. There are two types of transcripts (shown at the top of Figure 7) that are in equilibrium with each other, those that have the GC-rich mRNA stem-loop formed in front of the advancing 43S PIC (left) and those that don’t (right). GC-rich stem-loop containing mRNA species get stuck in the advancing 43S PIC (i.e. the yeast 43S PIC cannot resolve stems >2 GC-pairs; center left of Figure 7) leaving only the small remaining pool of mRNA without a GC-rich stem-loop to be efficiently translated (once the first 43S PIC has successfully scanned through the entire 5′ UTR the mRNA remains unfolded [23]; right side of Figure 7), leading to a biphasic polysome distribution and inhibition of translation that is inversely proportional to the thermodynamic stability of the stem-loop. This model
is further supported by recent in vitro studies with a reconstituted mammalian translation system where the authors have shown that small GC-rich mRNA stem-loops get trapped inside the 43S PIC and require a dedicated DHX29 RNA helicase to be resolved [40]. Inter-estingly, yeast does not appear to have a dedicated DHX29 homolog [40] which could explain why it is so sensitive to GC-rich mRNA stem-loops artificially introduced into its 5′ UTRs and why their rather short 5′ UTRs (<134 nucleotides [41]) are so AU rich [41,42]. Clearly, further experimental evidence is required to unravel whether GC-rich mRNA stem-loops do indeed get stuck inside the 43S PIC and create a‘stalled’complex from which it is difficult for the yeast 43S PIC to escape (center left; Figure 7), or whether another less obvious mechanism is at work that could explain our findings. But whatever the mechanism, it is clear that the yeast 43S PIC has a very limited ability to unwind ‘local’ (i.e. complementary stem nucleotide-pairs separated by loops of no more than ~10
eIF2-GDP, Pi
60S
80S AUG
AUG
AUG
eIF5, eIF1, eIF3
+ eIF5B-GTP
eIF5B-GDP, Pi, eIF1A 2
2
3
3
1
eIF4E, eIF4G, eIF4A, eIF4B
43S 1
eIF4E, eIF4G, eIF4A, eIF4B
43S
f
Figure 7Effects of small,‘local’, GC-rich mRNA stem-loops on the yeast 43S PIC.Protein translation in eukaryotes starts (1) with the binding of the eukaryotic initiation factor 4F (eIF4F = eIF4E and eIF4G) to the 5′cap (5′m7G; black dot) of the mature mRNA. eIF4A together with
eIF4B are thought to unwind secondary structure in an ATP-dependent fashion close to the 5′cap to allow access for the 43S PIC (small grey ovals). The 43S PIC consists of the 40S ribosomal subunit to which eIF1, 1A, 2 (bound to GTP), 3 and 5 and tRNAMetare bound. After attachment
of the 43S PIC next to the 5′cap region AUG start-codon scanning proceeds. Recognition of the AUG start-codon (2) induces GTP hydrolysis and the release of eIF2, GDP, and Pi, which is followed by the eIF5B-GTP catalyzed joining of the 60S subunit (large grey oval) and the displacement of eIF5, eIF1 and eIF3 followed by hydrolysis of eIF5B-GTP and the release of eIF5B-GDP and eIF1A leading to the production of an 80S initiation complex competent for elongation (3) [36,37]. Small,‘local’, GC-rich mRNA stem-loops 5′proximal to the AUG start codon inhibit AUG
nucleotides) GC-rich mRNA stem-loops and their degree of inhibition of translation is determined solely by their thermodynamic stability and independent of sequence context and the promoter used.
Conclusions
We successfully exploited the intrinsic nature of small GC-rich mRNA stem-loop modules 5′ proximal to the AUG start-codon of yeast genes to stably and predictably tune gene dosage from a single promoter without the need for inducers. This discovery, and the general lack of well-characterized promoters for gene expression in yeast, makes GC-rich mRNA stem-loop modules an important tool for regulating protein expression in yeast. They could be of value for i) the titration of minimal expression levels required for essential genes; ii) the elucidation of gene function; or iii) the determination of the precise impact of the gene dosage on a desired phenotype [11]. They could help identify the rate-limiting step and optimize the expression levels for genes in novel metabolic pathways by modifying the expression modules for each gene. Also they could be used to down-regulate expression levels of essential genes of competing endogen-ous biological pathways, which can lead to dramatically reduced levels of a target metabolite. One example would be the successful synthesis of artemisinic acid, precursor of the antimalarial artemisinin, in yeast that required down-regulation of the essential gene ERG9 [8,43]. Another application of the GC-rich mRNA stem-loop modules is the optimization of heterologous membrane protein expression in yeast as, often, high expression levels can lead to their misfolding and/or mislocalization [44,45]. As AUG start-codon scanning is a universal eukaryotic feature it is possible that this strategy can be applied in many other eukaryotic hosts as well [25].
Materials and methods
Strains and culture conditions
S. cerevisiaestrains used in this study are listed in Table 5 and are based on AD1-8u- [13] or its derivative strain ADΔ [14] that has been deleted of the entire URA3
gene. Yeast strains were grown in synthetic medium (CSM pH 5.6) containing 0.077% (w/v) complete sup-plement mixture (Bio 101, Vista, CA), 0.67% (w/v) yeast nitrogen base without amino acids (Difco) and 2% (w/v) glucose or 2% (w/v) glycerol as carbon source or in synthetic medium buffered to pH 7.0 (CSM pH 7.0) with 10 mM 2-(N-morpholino)-ethanesulfonic acid (MES) and 18 mM N-2-hydoxyethylpiperazine-N
’-2-ethanesul-fonic acid (HEPES) or in complex YPD medium containing 1% (w/v) yeast extract, 2% (w/v) peptone, and 2% (w/v) glu-cose (Difco Laboratories, Detroit, MI). Yeast transformants were selected on plates containing 0.077% (w/v) complete supplement mixture without uracil (CSM–URA) (Bio 101,
Vista, CA), 0.67% (w/v) yeast nitrogen base without amino acids (Difco), 2% (w/v) glucose, and 2% (w/v) agar (Difco). Plasmids were maintained in E. coli strain DH5α. E. coli
cells were grown in Luria-Bertani (LB) medium, to which ampicillin was added (100μg/ml) as required.
Materials
Molecular biology reagents, restriction and modifying enzymes were from New England Biolabs (Beverly, MA) or from Roche Diagnostics N.Z. Ltd. (Auckland, New Zealand). Lyophilized desalted DNA oligonucleotides listed in Additional file 3: Table S1 were purchased from Sigma-Aldrich Pty. Ltd. (Sydney, Australia). PCR and DNA fragments were purified using kits from Qiagen Pty. Ltd. (Clifton Hill, Victoria, Australia). Genomic DNA (gDNA) was isolated from individual yeast colonies by using the Y-DER™ Yeast DNA Extraction Reagent Kit from Pierce (Rockford, IL) and downscaling the recommended protocol 50-fold. Yeast cells were transformed using the alkali-cation yeast transformation kit from Bio 101 with slight modifications for AD1-8u- as described previously [14]. Plasmids and entire transformation cas-settes PCR-amplified from the gDNA of different yeast strains (Table 5) were verified by DNA sequencing using the DYEnamic ET Terminator Cycle Sequencing kit v 3.1 (Amersham Pharmacia Biotech, UK) and analyzed at the Micromon DNA Sequencing Facility (Monash University, Melbourne, Australia). For standard PCR reactions (95°C for 5 min followed by cycles of: 95°C for 20 sec; 55°C for 10 sec; and 68°C for 1 min/kb of PCR fragment) the high fidelity KOD+ DNA polymerase was used (Toyobo, Osaka, Japan or Novagen, San Diego, CA). For site-directed mutagenesis of plasmids the Chameleon® site-directed mutagenesis kit (Stratagene, La Jolla, CA) was employed. ExoSAP treatment was used to eliminate unwanted DNA oligomer primers from PCR reactions. In short, a 5μl portion of the PCR reaction was incubated at 37°C with 0.2 μl ExoSAP-IT® (Affymetrix, Santa Clare, CA) for 15 min and the enzyme was heat inactivated at 80°C for 30 min. Small aliquots (0.1–1μl) were then used as DNA templates for DNA sequencing or PCR.
Compounds
Fluconazole (FLC, Diflucan; aqueous solution) was pur-chased from Pfizer Laboratories Ltd. (Auckland, New Zealand) and enniatin was purchased from Sigma-Aldrich New Zealand Ltd. (Auckland, New Zealand). D-octapep-tide RC21v2 is a Cdr1p-specific inhibitor of FLC transport by ABC efflux pump Cdr1p [33].
Construction of plasmids pABC1 and pABC3
termination of highly expressed genes, the S. cerevisiae PGK1 transcription terminator was PCR amplified as a
HindIII/BamHI fragment from AD1-8u-gDNA and used to replace theHindIII/BamHIPDR5terminator fragment of pSK-PDR5-PPUS immediately 3′of thePDR5promoter to generate pSK-PDR5-PGK1. Further improvements (creation of a multiple cloning site with additional unique cloning sites upstream and downstream of the transformation cassette) of pSK-PDR5-PGK1 by site-directed mutagenesis led to the creation of vector pABC (precursor of pABC1).
Plasmid pABC3, the cloning vehicle that we routinely use for the overexpression of membrane proteins in yeast [14,17], was derived from plasmid pABC1 as previously described [14]. In short, we used site-directed mutagenesis to introduce a unique EcoRI site at the 3′ end of theURA3marker and replacedSacI of pABC1 with
XhoI creating plasmid pABC2. In a final step vector pABC3 was created by reverting the SfiI/AvaI sites of pABC2 to the wildtype PDR5 sequence to maximize translation efficiency in yeast and a secondAscI site was created at the 3′ end of the transformation cassette for ease of cassette excision [14].
DNA sequences of pSK-PDR5-PPUS, pSK-PDR5-PGK1, pABC, pABC1 and pABC2 were submitted to GenBank under accession numbers JN581374-78, respectively.
Creation ofPDR5over-expressing strains that had only their 5′UTR modified
AD and AD/sec6-4 strains that overexpressed wt-PDR5
or PDR5 with their 5′ UTR modified to contain either theSfiI-, theSfiI-PacI- or thePacI-site 5′proximal to the ATG start codon of PDR5were created by transforming
Table 5Saccharomyces cerevisiaestrains used in this study
Strains Genotype Reference
AH22 MAT a, leu2-3, leu2-112, his 4–519, can1 G. R. Fink, MIT, MA, USA
SY1 MAT a, ura3-52, leu2-3, 112, his 4–619, sec6-4,GAL [46]
AD124567u-= AD/wt-PDR5 MATα, PDR1-3,ura3,his1,Δyor1::hisG,Δsnq2::hisG,Δpdr10::hisG,Δpdr11::hisG,
Δycf1::hisG,Δpdr3::hisG
[13]
AD1-8u-= AD MATα, PDR1-3,ura3,his1,Δyor1::hisG,Δsnq2::hisG,Δpdr10::hisG,Δpdr11::hisG,
Δycf1::hisG,Δpdr5::hisG,Δpdr15::hisG,Δpdr3::hisG
[13]
ADΔ AD1-8u-,Δura3 [26]
AD/pABC3 AD1-8u-,Δpdr5::pABC3 (empty vector cassette) [47]
AD/sec6-4 MATα, PDR1-3,ura3,his1,Δyor1::hisG,Δsnq2::hisG,Δpdr10::hisG,Δpdr11::hisG,
Δycf1::hisG,Δpdr5::hisG,Δpdr15::hisG,Δpdr3::hisG, sec6-4::200
[26]
AD/PDR5 AD1-8u-, PDR5 This study
AD/SP-PDR5-URA3 AD1-8u-,Δpdr5::pABC1-SfiI-PacI-PDR5 This study
AD/S-PDR5-URA3 AD1-8u-,Δpdr5::pABC1-SfiI-PDR5 This study
AD/P-PDR5-URA3 AD1-8u-,Δpdr5::pABC3-PDR5 This study
AD/SP-PDR5 AD1-8u-, SfiI-PacI-PDR5 This study
AD/S-PDR5 AD1-8u-, SfiI(−18)-PDR5 This study
AD/P-PDR5 AD1-8u-, PacI-PDR5 This study
AD/sec6-4/PDR5 AD1-8u-, sec6-4::200, PDR5 This study
AD/sec6-4/SP-PDR5 AD1-8u-, sec6-4::200, SfiI-PacI-PDR5 This study
AD/sec6-4/S-PDR5 AD1-8u-, sec6-4::200, SfiI(−18)-PDR5 This study
AD/sec6-4/P-PDR5 AD1-8u-, sec6-4::200, PacI-PDR5 This study
AD/sec6-4/SP-PDR5-URA3 AD1-8u-, sec6-4::200,Δpdr5::pABC1-SfiI-PacI-PDR5 This study
AD/sec6-4/P-PDR5-URA3 AD1-8u-, sec6-4::200,Δpdr5::pABC3-PDR5 This study
AD/S-CDR2A-URA3 AD1-8u-,Δpdr5::pABC1-SfiI-CDR2A (A allele ofC. albicans10261) This study
AD/P-CDR2A-URA3 AD1-8u-,Δpdr5::pABC3-CDR2A [29]
AD/S-CDR2B-URA3 AD1-8u-,Δpdr5::pABC1-SfiI-CDR2B (B allele ofC. albicans10261) This study
AD/P-CDR2B-URA3 AD1-8u-,Δpdr5::pABC3-CDR2B [29]
AD/S-CDR1-URA3 AD1-8u-,Δpdr5::pABC1-SfiI-CaCDR1A (A allele ofC. albicans10261) This study
ADΔ/P-CDR1-URA3 ADΔ,Δpdr5::pABC3-CaCDR1A [14]
ADΔ/SfiI(−4)-CDR1 = ADΔ/construct1-CDR1 ADΔ,Δpdr5::construct1 This study
AD and AD/sec6-4 with four different DNA fragments that contained that part of the promoter and ~1/3 (1163) bp) of the ORF ofPDR5 that was deleted in both strains [13]. To ensure proper integration of these DNA frag-ments via homologous recombination into the genomic
PDR5 locus of AD and AD/sec6-4 >200 bp additional
PDR5 sequence was included on either end. The DNA fragments that were used to create AD/ and AD/sec6-4/
PDR5 were PCR-amplified from gDNA of AD/wt-PDR5 using the primer pair pd5f/pd8r. The DNA fragments that were used to create AD/SP-, /S-, and /P-PDR5 and AD/ sec6-4/SP-, /S-, and /P-PDR5 were obtained by digesting 2 μg of plasmids pABC1-SP-PDR5, pABC1-S-PDR5, and pABC3-PDR5, respectively, with AscI and SalI and gel purifying the resulting ~2.5 kb DNA fragments. Positive transformants were selected on CSM plates containing 20 μg/ml FLC, a concentration that was high enough to prevent growth of AD and AD/sec6-4 but low enough for any of the expected recombinant yeast strains to grow. Three independent transformants were verified for each individual construct for proper integration at the PDR5 locus by PCR from purified gDNA and by DNA sequencing.
Creation of an mRNA stem-loop library near the AUG start-codon ofCDR1
1–10 ng of pABC3-CDR1A [14] were used as DNA
template to amplify 18 pairs of PCR fragments to create 17 different yeast strains (ADΔ/constructs(1,2,4-18)-CDR1; Table 4 and Additional file 2: Figure S2). Strains with weaker stem-loops (ADΔ/constructs(1,2,4-8)-CDR1) were created using strategy 1, as illustrated in Additional file 2: Figure S2A. In a first step, two DNA fragments (the 3′part of thePDR5promoter and the 5′part of theCDR1ORF) were amplified with primers pd5f/pSfiM-(1–8)r and pSfiM-(1–8)f/Rev-3, respectively. Each pair of DNA fragments had identical stem-loop sequences near their 3′ (PDR5 fragment) and 5′ (5′-CDR1 fragment) ends, respectively (highlighted light blue in Additional file 1: Figure S2 and underlined sequences in Additional file 3: Table S1). Portions of PCR amplicons were treated with ExoSAP-IT® to eliminate DNA oligomer primers before mixing 1 μl (~40 ng) of each pair of DNA fragments (construct pairs 1–8) and amplifying the fused PCR products with the outside primer pair pd5f/Rev-3 in a second PCR step. The eight fused PCR products were column purified and used to transform ADΔas described below. Using this approach it was impossible to amplify the fused PCR product for ADΔ/construct3-CDR1 (core SfiI stem-loop extended with three extra GC-pairs; see primers pSfiM-3f/r in Additional file 3: Table S1). This strong stem-loop of seven GC-pairs inhibited the fusion of the two overlapping PCR fragments as illustrated in Additional file 2: Figure S2B (top left).
In order to create larger stem-loops with additional AU-and GC-pairs (including ADΔ/construct15-CDR1 to replace the planned but not obtainable ADΔ/construct3-CDR1) we developed an alternative cloning strategy (Additional file 2: Figure S2B). Primer pairs pSfiM-(9–18)(f/r) were designed so that their 5′ends contained a core SfiI site (bold type face; Additional file 3: Table S1) that was extended on either side with one, two, or three extra nucleotides (underlined in Additional file 3: Table S1). The sequences for primers pSfiM-(9–18)f were extended with three additional As followed by ~20 bp of the CDR1A ORF. This design en-sured that the positions of the stem-loops of constructs 9– 18 were always at−4 relative to the AUG start-codon. The sequences of primers pSfiM-(9–18)r were each extended with an additional three Ts so that each sequence of theSfiI constructs(9–18) was flanked by three A nucleotides (Add-itional file 3: Table S1) to minimize secondary structure around the predicted stem-loops. An additional ~25 bp of the wild-type PDR5promoter sequence was added to the reverse primers to ensure the amplification of PCR prod-ucts. The PDR5 promoter and the 5′-CDR1 fragments were then amplified by PCR from pABC3-CDR1A with pd5f/pSfiM-(9–18)r and pSfiM-(9–18)f/Rev-3 pri-mer pairs, respectively. A portion (~200 ng) of each PCR fragment was digested with SfiI, the digested fragments were then gel purified and dissolved in 50μl water. Corre-sponding pairs of SfiI-digested PCR fragments (5 μl; ~20 ng) were mixed, ligated, and ~2 ng of each ligation mix (mixes 9–18) used as a DNA template for PCR ampli-fication of ligated products using primers pd5f/Rev-3 (Additional file 2: Figure S2B). A single PCR fragment was obtained in all cases. This was possible for two reasons: i) the two DNA fragments of each pair of PCR fragments could only ligate at their SfiI digested ends (grey) leading to only three possible ligation products (Additional file 2: Figure S2B) as their blunt ends were not 5′-phosphorylated (non-phosphorylated primers were used to amplify the fragments); and ii) only fragment three of the ligation mix (PDR5-SfiI-5′
-CDR1; Additional file 1: Figure S2B) could be am-plified because the other two ligation products were inverted repeats that spontaneously form an intramo-lecular double strand after strand separation at 94°C.
Finally, the fused and PCR amplified DNA products obtained by either of these two strategies (Additional file 2: Figure S2A and B) were gel purified, and ~40 ng of each were mixed with 200 ng 3′-CDR1-URA3-PDR5(PCR amp-lified from pABC3-CDR1A with primers CaCDR1-3/ pAscI-2 and column purified; the remaining 3′part of the entire CDR1-transformation cassette was identical for all constructs) and used to transform ADΔ(Additional file 2: Figure S2C). The entire CDR1-transformation cassette (~7.5 kb) was divided into two parts (5′ CDR1 and 3′
required fewer cycles (a combined total of 40–45 cycles for two separate steps of PCR amplification required for either strategy; Additional file 2: Figure S2A and B) of PCR to ef-ficiently amplify, which significantly reduced the rate of amplification errors within positive transformants. Uracil prototroph transformants were selected on CSM-URA plates after incubation at 30°C for 2–3 d. Three independ-ent transformants were verified for each individual con-struct for proper integration at the PDR5 locus by PCR from purified gDNA and by DNA sequencing.
Northern blot analysis
Total RNA was isolated from S. cerevisiae cells using the hot-phenol extraction method. Usually about 100 ODU (optical density units; defined as the amount of cells corresponding to 1 ml of cells of an OD600 of 1) of cells were harvested by centrifugation for 1 min at 3000 g, the cells were washed once in ice-cold water, and snap frozen in liquid nitrogen and stored at −80°C. Samples (10 μg) of total RNA were se-parated on 1.2% denaturing agarose gels and stained with ethidium bromide (EtBr). The separated total RNA was photographed, immediately Northern blot-ted onto nylon+ membranes and further processed according to standard protocols [48]. 32
P-radioac-tively labeled probes for ACT1 and PDR5 were
obtained with a random priming kit using PCR-amp-lified DNA fragments of ACT1 (~800 bp; amplified
with pACT1for/pACT1rev) and PDR5 (~1200 bp;
amplified with pd7f/pd23r) as DNA templates. Both PCR fragments were amplified from gDNA extracted from AD/wt-PDR5.
Analysis and purification of plasma membrane (PM) proteins
PM fractions of S. cerevisiae cells were prepared as described previously [49] and protein samples (30 μg) were separated by SDS-PAGE with 8% polyacrylamide gels and stained with Coomassie Blue R250.
Functional analysis of multidrug efflux pump over-expressing yeast strains
The susceptibilities of three independent transformants for each individual construct to the antifungal FLC were measured as described previously [49].
Screening for inhibitors ofC. albicansmultidrug efflux pump Cdr1p (chemosensitization assay)
The chemosensitization of yeast strains over-expressing the C. albicans multidrug efflux pump Cdr1p to FLC was carried out as described previously [49]. In brief, a 10 ml YPD overnight culture of cells was diluted 1:20 into CSM medium and incubated at 30°C for a further four hours. Each test strain (OD600nm~1) was diluted to
OD600nm = 0.008 in 5 ml of melted CSM containing 0.6% agarose (50°C) and FLC at 0.25 x the minimum growth inhibitory concentration (MICFLC) of each strain. The cell suspension was poured into a rectangular Omnitray plate (126 by 86 by 19 mm; Nunc, Roskilde, Denmark) that contained 20 ml of CSM solidified with 0.6% agarose and FLC at a concentration of 0.25 x MICFLC of the respective test strain. Whatman 3MM paper disks containing different amounts of the Cdr1p drug pump inhibitor enniatin or RC21v2 were placed on the solidified top agarose and the plates were incubated at 30°C for 48 h.
Additional files
Additional file 1: Figure S1.Northern blot analysis (Additional file 1: Figure S1) was performed on cells harvested at early log (OD600= 0.5),
late log (OD600= 5) or stationary phase (OD600= 10–12; these cells were
grown in CSM (pH 5.6) for an additional 16 h compared to late-log phase cells) as described in the Materials and methods section. The experiment was performed on AD/sec6-4/PDR5, AD/sec6-4/S- and /P-PDR5 and two wild-typePDR5expressing strains, AH22 and SY1. Comparing the measured intensities between the short- and long-exposed bands for PDR5(Additional file 1: Figure S1A) that were within the linear range in both autoradigraphs helped determine the factor (18.3) by which the bottom autoradiograph was overexposed. This factor was used to analyze the Northern blot results (Additional file 1: Figure S1A) as presented in Additional file 1: Figure S1B-D. TheSfiI mRNA stem-loop near the AUG start codon causes∼3-fold increased mRNA levels ofPDR5 that is independent of the growth phase.Ashows the two large ribosomal bands of total RNA extracts after they had been separated with a 1.2% denaturing agarose gel and stained with EtBr (top). Total RNA was extracted from the indicated strains harvested either at early log-, late log-, or stationary phase (from left to right), respectively. As in Figure 2A, the autoradiograph obtained forPDR5andACT1is shown underneath, and an overexposed autoradiograph forPDR5is shown at the very bottom.Bshows the growth-phase dependent change inACT1 mRNA levels relative to early log phase cells for the five test strains (ACT1mRNA levels of early log phase cells are shown as black bars, late log phase cells as dark grey bars and stationary phase cells as light grey bars).Cshows the growth-phase dependent change inPDR5mRNA levels relative to early log phase cells for the same strains and using the same assignment of bars as inBfor early log, late log, and stationary phase cells.Dshows the change in normalized (i.e. relative toACT1)PDR5 mRNA levels for all five test strains harvested at early log (black bars), late log (dark grey bars) or stationary growth phase (light grey bars), andE
shows the -fold differences of the normalizedPDR5mRNA levels relative to AD/sec6-4/PDR5 harvested for early log (0.5), late log (5) or stationary (10) phase cells, respectively (dark grey bars = wt-PDR5; black bars = S-PDR5 and light grey bars = P-PDR5, respectively). The numbers above individual bars inB, C, D,andEgive the actual values represented by the bars.