R E S E A R C H
Open Access
Differences in gut microbiota composition
between obese and lean children: a
cross-sectional study
Liene Bervoets
1,2*, Kim Van Hoorenbeeck
3,4, Ineke Kortleven
5, Caroline Van Noten
5, Niel Hens
5,6,7, Carl Vael
7,8,
Herman Goossens
7, Kristine N Desager
3,4and Vanessa Vankerckhoven
7Abstract
Background:An altered gut microbiota composition has recently been linked to obesity. The principal aim of this study is to investigate and compare the gut microbiota composition in obese and lean children. Secondly, associations between analysed gut bacterial species, dietary compounds, energy intake and biochemical blood parameters are evaluated.
Methods:In this prospective cross-sectional study, 26 overweight/obese (mean BMI: 28.7 ± 6.5) and 27 lean (mean BMI: 16.5 ± 2.1) children aged 6 to 16 were included. Faecal samples were collected and subjected to selective plating and quantitative real-time PCR (qPCR) in order to determine the concentrations of bacterial species belonging to the genera:Bacteroides, Bifidobacterium,Clostridium,StaphylococcusandLactobacillus. Matrix-assisted laser desorption/ionization time-of-flight mass spectrometry (MALDI-TOF MS) was applied for an in-depth identification of species ofBacteroides fragilisgroup. Differences in the concentrations of gut bacterial species between obese and lean children were statistically analysed using Mann WhitneyUtest. Subsequently, random forest analysis and multiple linear regression analysis were performed in order to test associations between gut bacterial species, dietary compounds and blood parameters.
Results:Obese children showed an elevated Firmicutes-to-Bacteroidetes ratio compared with lean children. Furthermore, low relative proportions ofB. vulgatusand high concentrations ofLactobacillusspp. were observed in the obese microbiota. In all children,Staphylococcusspp. were positively associated with energy intake. Additionally, in obese children,Lactobacillusspp. were positively associated with plasma hs-CRP.
Conclusions:Our findings corroborate a significant difference in the gut microbiota composition of important bacterial species between obese and lean children. In future, non-invasive manipulation of gut microbiota composition in early infancy could offer a new approach to manage childhood obesity and associated disorders.
Keywords:Gut microbiota, 16S rDNA, MALDI-TOF MS,Bacteroides fragilisgroup, Obesity, Children
Background
Although there is evidence that the prevalence of child-hood obesity is stabilising at different levels in different countries [1], the number of children and adolescents being overweight or obese is still dramatically high [2,3]. The major concern is that these children are at high risk
of developing severe co-morbidities such as metabolic syndrome, non-alcohol fatty liver disease, type 2 diabetes mellitus and premature cardiovascular diseases [4,5]. Moreover, obese children are highly prone to become obese adults, especially when having a high body mass index (BMI) or an obese parent [6,7]. In order to combat childhood obesity and related complications, prevention is crucial. At the moment, the most important strategies to manage childhood obesity are therapeutic lifestyle changes, such as changing dietary habits and the phys-ical activity level. However, these are often difficult to * Correspondence:[email protected]
1
Faculty of Pharmaceutical, Biomedical and Veterinary Sciences, University of Antwerp, Antwerp, Belgium
2
Faculty of Medicine and Life Sciences, Hasselt University, Agoralaan 1-Building D, 3590, Diepenbeek, Belgium
Full list of author information is available at the end of the article
achieve. When lifestyle modifications continue to fail, pharmacological interventions and possibly bariatric sur-gery could be considered.
Nowadays, it is generally accepted that the develop-ment of obesity is caused by gene-environdevelop-ment inter-actions, generating a chronic positive energy balance [8]. However, physiological and environmental predisposi-tions underlying obesity and associated metabolic disor-ders are still underexplored. Recent evidence suggests that our gut microbiota is involved in energy regulation as well as inflammation [9], and should therefore be considered as an environmental factor playing a role in the pathophysiology of obesity [10,11]. Although energy intake can affect the gut microbiota composition [12], it is still unclear whether the gut microbiota play a causal role in the development of obesity in humans.
So far, several studies in humans and mice have shown differences in gut microbiota composition bet-ween obese and lean subjects. These differences were mostly detected at the phylum level of mainly Firmicutes and Bacteroidetes [11-14]. Obesity in humans has already been associated with low intestinal concen-trations of Bacteroidetes and high concenconcen-trations of Firmicutes, although this finding has been contradicted by other studies [15,16]. Only few studies have investi-gated the prevalence of faecal bacterial phyla in obese children and adolescents. One study demonstrated low concentrations of Bacteroidetes and high concentrations of Firmicutes in the distal gut of obese adolescents living in Spain [17]. Another study in Sweden, did not find sig-nificant differences in the concentrations of Bacteroides fragilis group, Lactobacillus spp. and Bifidobacterium spp. between preschool children with excessive body weight and normal-weight children [18]. By contrast, Vael et al. [19] demonstrated that a high intestinal con-centration of Bacteroides fragilis group present in early infancy was associated with a higher risk of obesity later in life. In general, limited and contradictory findings with regard to the composition of the gut microbiota in obese children indicate that further in-depth analysis of the role of the intestinal microbiota in childhood obesity is warranted.
The principal aim of this study is to evaluate and com-pare the presence of certain gut bacterial species in fae-cal samples of obese and lean children and adolescents. Quantitative culturing was used to identify and de-termine the concentrations of the following bacterial genera:Bacteroides fragilisgroup,Bifidobacterium, Clos-tridium,StaphylococcusandLactobacillus. In addition to quantitative culturing, matrix-assisted laser desorption/ ionization mass spectrometry (MALDI-TOF MS) was used for in-depth analysis of species belonging to the Bacteroides fragilis group. Quantitative real-time poly-merase chain reaction (qPCR) was applied to quantify
Bacteroides-Prevotella-Porphyromonas spp., Bifidobac-terium spp., Clostridium coccoides-Eubacterium rectale group, Clostridium leptum group, Staphylococcus spp. and Lactobacillus spp. The Firmicutes-to-Bacteroidetes ratio was calculated based on the qPCR results. Finally, analysed gut bacterial species were associated with diet-ary compounds and energy intake, which were assessed by dietary records. Moreover, concentrations of bioche-mical blood parameters were measured in overweight and obese subjects.
Results
Subject characteristics
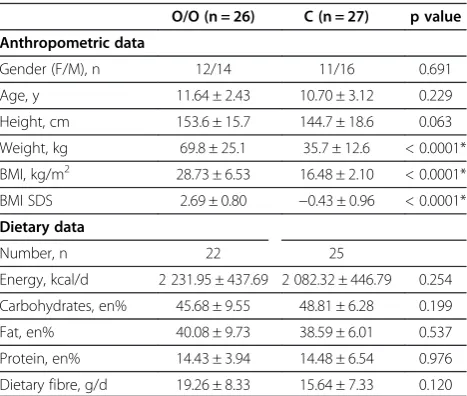
Characteristics of the study population are shown in Table 1. In total, 9 overweight, 7 obese, 10 morbidly obese (O/O) children and 21 normal-weight, 5 thinness grade I and 1 thinness grade III (C) children were in-cluded (see Methods section for details on BMI classifi-cation). Age, gender, height and dietary intake were not significantly different between the two study groups.
Quantification of bacterial genera and species of Bacteroides fragilisgroup
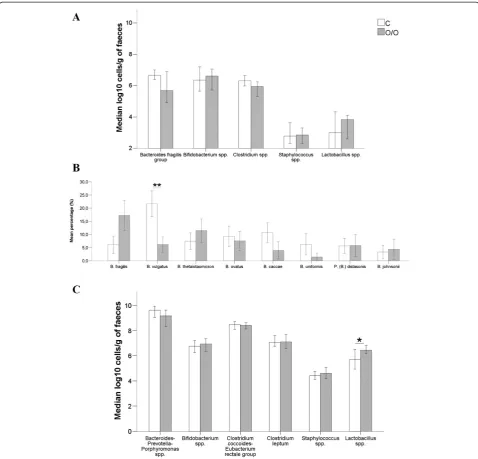
Differences in the concentrations of bacterial genera be-tween O/O and C children are presented in Figure 1A, B and C. Figure 1A illustrates differences between gut mi-crobiota in O/O and C children detected by quantitative plating. Bacteroides fragilis group and Clostridium spp. were borderline, but non-significantly different between O/O and C children (5.69 ± 2.14 vs. 6.66 ± 0.84 and 5.94 ± 1.10 vs. 6.31 ± 0.80, respectively; p = 0.050 and p = 0.074). In-depth analysis of species belonging to the Bacteroides fragilis group using MALDI-TOF MS re-vealed dominating relative proportions of B. fragilis
Table 1 General characteristics of the studied population
O/O (n = 26) C (n = 27) p value
Anthropometric data
Gender (F/M), n 12/14 11/16 0.691
Age, y 11.64 ± 2.43 10.70 ± 3.12 0.229
Height, cm 153.6 ± 15.7 144.7 ± 18.6 0.063
Weight, kg 69.8 ± 25.1 35.7 ± 12.6 < 0.0001*
BMI, kg/m2 28.73 ± 6.53 16.48 ± 2.10 < 0.0001*
BMI SDS 2.69 ± 0.80 −0.43 ± 0.96 < 0.0001* Dietary data
Number, n 22 25
Energy, kcal/d 2 231.95 ± 437.69 2 082.32 ± 446.79 0.254
Carbohydrates, en% 45.68 ± 9.55 48.81 ± 6.28 0.199
Fat, en% 40.08 ± 9.73 38.59 ± 6.01 0.537
Protein, en% 14.43 ± 3.94 14.48 ± 6.54 0.976
(17.3% vs. 6.1%, p = 0.136) and B. thetaiotaomicron (11.5% vs. 7.5%, p = 0.930) in faecal samples of O/O chil-dren compared with C chilchil-dren (Figure 1B). By contrast, in C children, relative proportions of B. caccae (10.7% vs. 4.0%, p = 0.051),B. ovatus (9.3% vs. 7.6%, p = 0.585), B. uniformis (6.3% vs. 1.5%, p = 0.177) and B. vulgatus (21.7% vs. 6.2%, p = 0.004) prevailed. Note that only B. vulgatusproportions were significantly different between the O/O and C children. Figure 1C shows differences found between gut bacterial species in O/O and C chil-dren detected by qPCR. In contrast to the quantitative
plating results, faecal concentrations of Lactobacillus spp. were found to be significantly higher in O/O com-pared with C children and adolescents (6.44 ± 1.20 vs. 5.69 ± 1.80, p = 0.035) using qPCR.
The Firmicutes-to-Bacteroidetes ratio
In Figure 2, a boxplot of the Firmicutes-to-Bacteroidetes ratio of O/O and C children is presented. The ratio resulted in favour of the Firmicutes in O/O children and adolescents (p = 0.007).
Figure 1Differences in bacterial genera between O/O and C group. A: Differences in bacterial genera between O/O and C detected by quantitative plating.B: Differences in relative proportions ofBacteroides fragilisgroup species between O/O and C detected by MALDI-TOF MS.C: Differences in bacterial genera between O/O and C detected by qPCR. Data of quantitative plating and qPCR are expressed as mean log10cells/g
Dietary assessment
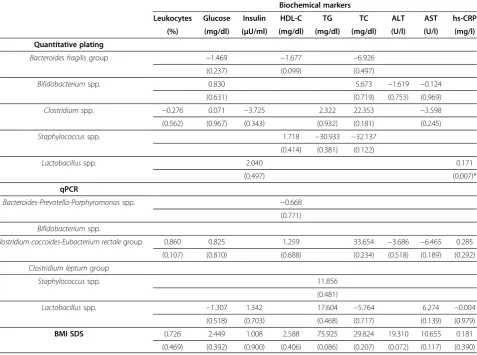
The most important associations between analysed gut bacterial species, dietary compounds and energy intake in a subsample of 22 O/O and 25 C children are pre-sented in Table 2. Children and adolescents with a high daily energy intake showed high faecal concentrations of Staphylococcus spp., analysed by means of quantitative plating (p = 0.028).
Biochemical markers
Important biochemical markers were measured in fas-ting venous blood samples of 19 obese children (see Material and Method section for more details on blood sampling procedure). The following mean values were obtained: fasting plasma glucose: 82.44 ± 5.34 mg/dl; fasting plasma insulin: 21.58 ± 17.31μU/ml; total choles-terol (TC): 176.26 ± 42.14 mg/dl; high-density lipopro-tein (HDL) cholesterol: 49.61 ± 10.05 mg/dl; triglycerides (TG): 112.63 ± 81.92 mg/dl; leukocytes: 7.86 ± 2.42%;
high-sensitive C-reactive protein (hs-CRP): 0.46 ± 0.36 mg/dl; alanin aminotransferase (ALT): 38.12 ± 19.82 U/l; aspartate aminotransferase (AST): 33.94 ± 12.79 U/l. The most important associations between major gut micro-biota species and the concentration of the biochemical markers are presented in Table 3. Intestinal concen-trations of Lactobacillus spp., which were analysed by quantitative plating, showed a positive association with plasma hs-CRP levels (p = 0.007).
Discussion
At birth, the gut microbiota of an infant is sterile but rapidly assembles over days or months [20]. Mode of de-livery (natural dede-livery versus caesarean section) and feeding method (breast feeding versus bottle feeding) have an early impact on the development of a child’s gut microbiome [21]. At the age of four, the gut microbiota is fully mature [22]. Eventually, each person develops a unique gut microbiota which is stable over time in healthy adults [23].
In this cross-sectional study, the obese gut microbiota composition was compared with that of a lean one. We focused on two major phyla Bacteroidetes and Firmicutes, next to the Bacteroides fragilis group, Bi-fidobacterium, Clostridium,Staphylococcusand Lactoba-cillus. Different bacterial groups were selected according to the frequency to which they have been described in relevant literature [17-19,24] and the ease of detection by the techniques used. On the one hand, quantitative plating was used as the‘gold standard’technique to iso-late and characterise the selected bacterial groups. How-ever, only 10 to 50% of all bacteria associated with the human body can be cultivated successfully [23,25]. Subse-quently, high-throughput culture-independent techniques, Figure 2Firmicutes-to-Bacteroidetes ratio of O/O versus C
children.O/O: obese group; C: control group. *p = 0.007.
Table 2 Most important associations between gut microbiota and dietary compounds represented by regression coefficientβ(p value)
Dietary compounds
Carbohydrates (en%) Fat (en%) Protein (en%) Fibre (g/d) Energy intake (kcal/d)
Quantitative plating
Bacteroides fragilisgroup 0.127 (0.110) 0.129 (0.129) 0.001 (0.987) −0.000 (0.620)
Bifidobacteriumspp. −0.025 (0.410) 0.000 (0.822)
Clostridiumspp. 0.001 (0.156)
Staphylococcusspp. 0.001 (0.028)*
Lactobacillusspp. 0.069 (0.360) 0.104 (0.180)
qPCR
Bacteroides-Prevotella-Porphyromonasspp. 0.048 (0.319) 0.069 (0.220) −0.000 (0.830)
Bifidobacteriumspp. 0.017 (0.439) 0.000 (0.285)
Clostridium coccoides-Eubacterium rectalegroup 0.000 (0.269)
Clostridium leptumgroup 0.000 (0.240)
which use DNA sequences encoding the 16S ribosomal RNA subunit, were applied in order to assign an organism to a phylogenetic classification more accurately [25].
To our knowledge, our study was the first to perform an in-depth analysis of species belonging to the Bacteroides fragilisgroup by means of MALDI-TOF MS. Overall, our results reveal a high Firmicutes-to-Bacteroidetes ratio in faeces of obese children including alterations at species level.
Selective media have been used successfully to identify and enumerate Bacteroides fragilis group from human faeces [26]. For the first time, a further in-depth analysis of species of the Bacteroides fragilis group revealed re-duced relative proportions of B. vulgatus in obese chil-dren and adolescents. One study reported decreased relative proportions ofB. vulgatusin the faeces of type 2 diabetic subjects using species specific PCR-denaturing gradient gel electrophoresis (DGGE) [27]. B. vulgatus was found to constitute a part of the core gut microbiota in healthy humans and is generally considered to be a beneficial gut commensal [28]. These findings point
towards a possible role forB. vulgatusin the pathophysi-ology of Western diseases, such as obesity and diabetes.
Moreover, the qPCR method that was used in this study to detect and quantify Bacteroidetes (Bacteroides-Prevotella-Porphyromonasspp.),Firmicutes (Clostridium coccoides-Eubacterium rectale group, Clostridium lep-tum group, Staphylococcus spp. and Lactobacillus spp.), and Bifidobacterium spp. in human faeces has already been thoroughly evaluated and validated [29-31]. In agreement with the findings of previous studies [32,33], we describe higher concentrations of Lactobacillus spp. in the obese gut microbiota. However, the use of quanti-tative plating did not permit the detection of a signifi-cantly higher concentration of Lactobacillus spp. in faeces of obese children, which we did see using qPCR. A possible explanation is that L. gasseri and L. acido-philus could not be identified in culture due to the presence of vancomycin in the LAMVAB medium [34]. Nevertheless, both quantitative culturing and qPCR resulted in a similar proportion of Lactobacillus spp. in the obese gut microbiota. A study conducted by Million Table 3 Most important associations between biochemical parameters, gut microbiota and BMI SDS represented by regression coefficientβ(p value)
Biochemical markers
Leukocytes Glucose Insulin HDL-C TG TC ALT AST hs-CRP
(%) (mg/dl) (μU/ml) (mg/dl) (mg/dl) (mg/dl) (U/l) (U/l) (mg/l)
Quantitative plating
Bacteroides fragilisgroup −1.469 −1.677 −6.926
(0.237) (0.099) (0.497)
Bifidobacteriumspp. 0.830 5.673 −1.619 −0.124
(0.631) (0.719) (0.753) (0.969)
Clostridiumspp. −0.276 0.071 −3.725 2.322 22.353 −3.598
(0.562) (0.967) (0.343) (0.932) (0.181) (0.245)
Staphylococcusspp. 1.718 −30.933 −32.137
(0.414) (0.381) (0.122)
Lactobacillusspp. 2.040 0.171
(0.497) (0.007)*
qPCR
Bacteroides-Prevotella-Porphyromonasspp. −0.668 (0.771)
Bifidobacteriumspp.
Clostridium coccoides-Eubacterium rectalegroup 0.860 0.825 1.259 33.654 −3.686 −6.465 0.285 (0.107) (0.810) (0.688) (0.234) (0.518) (0.189) (0.292)
Clostridium leptumgroup
Staphylococcusspp. 11.856
(0.481)
Lactobacillusspp. −1.307 1.342 17.604 −5.764 6.274 −0.004
(0.518) (0.703) (0.468) (0.717) (0.139) (0.979)
BMI SDS 0.726 2.449 1.008 2.588 75.925 29.824 19.310 10.655 0.181
et al. [32], demonstrated that Lactobacillus reuteri was associated with obesity in adults. By contrast, Santacruz et al. [33] showed that BMI SDS reduction in obese ado-lescents led to a concomitant increase in the concentra-tions ofLactobacillus spp. These findings thus suggest a possible role of Lactobacillus at species level in body weight and obesity. Additionally, we showed that the concentration of Lactobacillus spp. is positively corre-lated to plasma hs-CRP levels in obese children and ado-lescents. An increased prevalence of positive Firmicutes to higher levels of plasma hs-CRP was also seen in a study conducted in 51 obese and 28 normal-weight chil-dren and adults [35]. These results seems therefore to suggest a possible role for Lactobacillus spp. in “low-grade”inflammation, a major pathophysiological process of obesity.
Interestingly, we detected an elevated Firmicutes-to -Bacteroidetes ratio in the gut microbiota of obese chil-dren and adolescents. Previous investigators also showed significant associations between this ratio and obesity in mice and humans [11-14]. The results of our study are similar to a study in Spanish children, demonstrating increased concentrations of Firmicutes and decreased concentrations of Bacteroidetes in the obese gut [17]. Con-trary to these findings, other studies described no or even opposite differences in the Firmicutes-to-Bacteroidetes ra-tio between obese and lean subjects [15,16]. Possibly, these variations in study outcome are related to the fact that dif-ferent methodologies were applied in these studies.
To further elucidate the complex role of gut micro-biota in host physiology, a more thorough examination of the influence of diet on gut microbiota is re-commended. In order to do so, we analysed the rela-tionship between the presence of certain gut bacterial species with dietary compounds and energy intake. Here, we demonstrate that, independent of the BMI status, children and adolescents with a high energy intake (expressed in kcal/d) possess high faecal concentrations of Staphylococcus spp. analysed by quantitative culture. Note that the regression coefficientβof energy intake is low in all cases. This is due to the fact that values of en-ergy intake are expressed in kcal/d. Given the range of energy intake (1635.53 to 2669.64 kcal), results in effect on mean concentration ofStaphylococcusspp. of 1.27 to 2.08 are obtained. These results are not negligible and a real significant association has been detected. However, caution must be taken when translating these findings into a biological meaningful interpretation. Hence, more detailed research on this topic is necessary. Nevertheless, the importance of Staphylococcus spp. in childhood obesity has already been demonstrated by Kalliomaki et al. [24] who showed that a greater faecal concentra-tion ofStaphylococcus spp. during infancy predicted the development of overweight during childhood. A possible
role of Staphylococcus spp. in energy harvesting during childhood is thus suggested.
One major limitation of the current study is the small sample size and therefore these results should be in-terpreted with caution. In addition, pregnancy related factors, social status, and the period of being obese prior to inclusion were not taken into account.
Further longitudinal research on the cause-effect rela-tionship between gut microbiota and obesity is highly justified, since different bacterial species could play a sig-nificant role in the human energy harvest and weight regulation. Moreover, consideration of lifestyle factors in gut microbiota studies is highly recommended, since changes in dietary pattern and physical activity could influence gut microbiota composition and the deve-lopment of obesity. Finally, we suggest to focus future research not only on the elucidation of gut microbiota composition in obese subjects, but also on the study of gut metabolites, i.e.“metabolomics”. This suggestion for future research aims at expanding our knowledge on the complex interplay between gut microbiota, energy ho-meostasis and obesity.
In the future, modification of the gut microbiota com-position by the administration of pro-, pre- or synbiotics in early childhood could offer an opportunity to prevent and/or treat obesity [36]. However, additional research is required.
Conclusions
of the gut microbiota in obese children might conceivably contribute to limit the development of future obesity.
Methods
Subject characteristics
Overweight, obese and morbidly obese (O/O: obese group) children were recruited from the paediatric obe-sity clinic at the Antwerp Univerobe-sity Hospital. Normal-weight and lean children (C: control group) were recruited among the offspring of personnel working at the University of Antwerp. Skilled personnel recorded weight (scale, SECA 701 scale, Hamburg, Germany) and height (stadiometer, SECA 225, Hamburg, Germany) measurements, to the nearest 0.1 kg for weight and 1 mm for height and the BMI (in kg/m2). All subjects were classified based on the international BMI cut-off values of the Extended International Obesity Task Force (IOTF) for children aged 2 to 18 [37]. These values are based on age and gender-specific centile curves passing through BMI 35 (morbid obesity), 30 (obesity), 25 (overweight) and 18.5, 17 and 16 (thinness grades I, II and III) at age 18. BMI standard deviation score (SDS) was assessed using an electronic calculator (Auxology 1.1, Pfizer, New York, USA) based on the local reference standards, i.e. Flemish growth charts [38]. Exclusion criteria included the use of corticosteroids or antibiotics in the month prior to the study as well as during the study and signifi-cant co-morbidities such as an acute infection, prema-turity or chronic diseases. The study was conducted in accordance with the ethical rules of the Helsinki Declar-ation. Informed consent was obtained from all children and their parents or legal guardian. The study protocol was approved by the local medical Ethics Committee of the Antwerp University Hospital (document 7/41/226).
Gut microbiota analyses Faecal sample collection
A fresh faecal sample was self-collected and stored immediately at −20°C. The collection took place in the same week as the dietary record. Subsequently, the fae-cal samples were transported to the laboratory and stored at−80°C until further analysis.
Quantitative plating
Approximately 0.5 g of wet faeces was diluted in 9 vol-umes of phosphate buffer saline (PBS) and homogenized using a stomacher (Minimix®, Interscience, Arpents, France). Serial dilutions were plated using the Eddy Jet® apparatus (Led Techno, Heusden-Zolder, Belgium) onto the selective growth media. More specifically, Staphylo-coccusspp. were cultivated on mannitol salt agar (MSA) (Becton-Dickinson, Erembodegem, Belgium); only yellow and white colonies were considered [39].Bacteroides fra-gilis group was determined on Bacteroides Bile Esculin
agar (BBE) (Becton-Dickinson, Erembodegem, Belgium); only black pigmented colonies were considered [40]. Clos-tridiumspp. counts were obtained after pre-treatment of the faecal sample in 70% ethanol for 30 minutes and subsequent culture on Columbia blood agar (CBA) [41]. Lactobacillus spp. were cultured on Lactobacillus anaer-obic de Man, Rogosa and Sharpe with vancomycin and bromocresolgreen (LAMVAB) medium; only green and white colonies were considered [34].Bifidobacteriumspp. were determined on modified trypticase-phytone-yeast agar (MTPY); only colonies smaller than 0.7 mm were considered [42]. To confirm the presence of Bifidobac-teriumspp. in these colonies, a gram stain was conducted. The numbers of colonies positive for gram stain were expressed relative to the total number of colonies examined.
MALDI-TOF MS analysis
Of each sample, ten presumed colonies of Bacteroides fragilis group were subcultured on Wilkins-Chalgren medium for 24h and spotted onto a target plate. Matrix-assisted laser desorption/ionization mass spectrometry (MALDI-TOF MS) analysis was accomplished according to the manufacturer’s instructions (Microflex™LT Bruker Daltonik GmbH, Bremen, Germany). Recorded mass spectra generated with the MALDI Biotyper 2.0 software package were compared with each entry of the MALDI Biotyper database and relationships were identified. Ac-cording to the criteria by Nagy et al. [26], only identifi-cations with a log (score) between 1.9 and 3.0 were considered to be significant and allowed for identifica-tion of the bacterial populaidentifica-tions at the species level.
Quantitative real-time PCR
DNA extraction An aliquot (200 μl) of faecal
suspen-sion was suspended in 300 μl Tris-SDS solvent, 300 μg glass beads (diameter, 0.1 mm) and 500 μl TE-saturated phenol. Further extraction of total bacterial DNA was performed as described by Matsuki et al. [30]. The mix-ture was vortexed vigorously with FastPrep® FP120A (BIO 101® Systems, Thermo Scientific) for 30 s at a power level of 5.0. After centrifugation for 5 min at 13 000 rpm, 400 μl of the supernatant was collected and 400 μl phenol/chloroform/isoamylalcohol (25:24:1) was added. Subsequently, 250 μl of the supernatant was subjected to isopropanol.
For each bacterial strain, positive controls were added to each reaction and the total bacterial copy number per organism was determined with 16S rRNA gene targeted primers [29-31]. The bacterial primer sequences are re-ported in Table 4.
The Firmicutes-to-Bacteroidetes ratio An estimation
of the total amount of Firmicutes was obtained by ad-ding bacterial values (in log10 cells/g faeces) from Clos-tridium coccoides-Eubacterium rectale group (clostridial cluster XIV).
Clostridium leptum group (clostridial cluster IV), Lactobacillus spp. and Staphylococcusspp. For the total amount of Bacteroidetes, the Bacteroides-Prevotella-Porphyromonas spp. were taken into consideration. The ratio was calculated according to Mariat et al. [43].
Dietary assessment
A total of 22 (84.6%) O/O and 25 (92.6%) C children fully completed a five-day dietary record (three weekdays and two weekend days). The average daily intake of en-ergy and nutrients was calculated with the use of Becel Institute Nutritional Software program. The dietary va-riables examined in this study were carbohydrates (energy %), fat (energy %), protein (energy %), fibres (g/day), and total energy intake (kcal/day).
Biochemical analyses
Blood sampling was initially conducted to detect associ-ated metabolic and inflammatory complications in the O/O group. Since only 19 out of 26 fasting venous blood samples of obese children were available, results of only these samples were considered. Glucose, total cholesterol
(TC), high-density lipoprotein cholesterol (HDL-C), tri-glycerides (TG), alanine aminotransferase (ALT), aspartate aminotransferase (AST) and high-sensitive C-reactive pro-tein (hs-CRP) were measured on Dimension Vista 1500 System (Siemens Healthcare Diagnostics Inc., Neward, Delaware, USA). Insulin levels were measured using chemoluminescence (Roche Diagnostics, Rotkreuz, Switzerland). White blood cell count was performed using flow cytometry (Advia 2120, Siemens Healthcare Diagnos-tics Inc., Neward, Delaware, USA).
Statistical analysis
Descriptive and comparative analyses were performed in IBM SPSS version 20.0 (SPSS Inc., Chicago, IL, USA). The distribution of the residuals was tested for normality using the Kolmogorov-Smirnov test with Lilliefors cor-rection. Independent samples ttest was used in case of no significant deviation from normality. Otherwise the Mann Whitney Utest was used. Chi square (χ2) test of association was used to compare characteristics between the O/O and C study groups. Data were presented as mean with standard deviation (mean ± SD) unless indicated otherwise. Since bacterial counts followed a right-skewed distribution, data were log10-transformed. Bacterial data were expressed as median log10cells/g of faeces with interquartile ranges (IQR). Regression ana-lyses were implemented in R 2.13.1. Explanatory vari-ables were selected on the basis of a random forest analysis, i.e. a nonparametric technique that facilitates the selection of the important variables in a regression setting [44]. Given the random forest variable import-ance plot, the most important predictors above a visually selected cut-off value were chosen. Subsequently,
Table 4 16S rRNA gene-targeted group specific primers per bacterial group/species used in this study
Target Primer sequence (5’-3’) Reference strains Annealing
temp (°C)
Reference
Bacteroidetes
Bacteroides-Prevotella-Porphyromonasspp. GGTGTCGGCTTAAGTGCCAT Bacteroides fragilisDSM 2151/LMG 10263 68 [31]
CGGA(C/T)GTAAGGGCCGTGC
Firmicutes
Staphylococcusspp. GCGATTGATGGTGATACG Staphylococcus aureusATCC 29213 55 [29]
AGCCAAGCCTTFACGAACTAAAGC
Clostridium coccoides-Eubacteriumrectale group (clostridial cluster XIV)
CGGTACCTGACTAAGAAGC Ruminococcus productusDSM 2950/YIT 6141 55 [31]
AGTTT(C/T)ATTCTTGCGAACG
C. leptumgroup (clostridial cluster IV) GCACAAGCAGTGGAGT Faecalibacterium prausnitziiYIT 6174 50 [30]
TTCCTCCGTTTTGTCAA
Lactobacillusspp. AGCAGTAGGGAATCTTCCA Lactobacillus acidophilusLMG 9433 58 [31]
CACCGCTACACATGGAG
Actinobacteria
Bifidobacteriumspp. TCGCGTC(C/T)GGTGTGAAAG Bifidobacterium longumDSM 20219/YIT 4021 58 [31]
multiple linear regression was applied to quantify the as-sociations between gut microbiota, diet, biochemical pa-rameters and BMI SDS controlled for age and gender. Wilcoxon-signed rank test was used to evaluate the dif-ference of accuracy between quantitative culturing and qPCR. Statistical significance was assessed at the 5% level.
Abbreviations
ALT:Alanin aminotransferase; AST: Aspartate aminotransferase;
BBE:BacteroidesBile Esculin; BMI SDS: Body Mass Index Standard Deviation Score; C: Control group; CBA: Columbia Blood Agar; HDL: High-density lipoprotein; hs-CRP: High sensitive C-reactive protein; IOTF: International Obesity Task Force; IQR: Inter Quartile Ranges; LAMVAB:Lactobacillus Anaerobic de Man Rogosa and Sharpe with Vancomycin And Bromocresolgreen; MALDI-TOF MS: Matrix-Assisted Laser-Desorption /Ionization Time-Of-Flight Mass Spectrometry; MSA: Mannitol Salt Agar; MTPY: Modified Trypticase-Phytone-Yeast Agar; O/O: Obese group; PBS: Phosphate Buffer Saline; TC: Total cholesterol; TG: Triglycerides; qPCR: Quantitative real-time polymerase chain reaction.
Competing interests
All authors declare that there are no competing financial interests in relation to the work described.
Authors’contributions
KD, CV, HG and VVK conceived and designed the study. LB, KVH, IK and CVN collected the data. LB carried out experiments. LB, IK, CVN and NH statistically analysed the data. LB, KVH, NH and VVK interpreted the data. LB, IK and CVN did literature research. LB generated figures and tables. LB wrote the manuscript with help of KVH and VVK. KVH, NH, KD, CV, HG and VVK revised the paper. LB had full access to all of the data in the study and takes responsibility for the integrity of the data and accuracy of the data analysis. All authors had final approval of the submitted and published versions.
Acknowledgements
We thank Christine Lammens and Sabine Chapelle for their technical assistance in analysing the gut microbiota. We thank Racheli Banach and Annemie Van de Sompel for their help with the analysis of the dietary records. We thank dr. Eric Caers for the language editing of the manuscript. This study was funded by the Laboratory of Medical Microbiology, the Department of Pediatrics of the University of Antwerp, the Antwerp University Hospital and the foundation Limburg Sterk Merk, Hasselt University, Ziekenhuis Oost-Limburg and Jessa Hospital.
Author details
1Faculty of Pharmaceutical, Biomedical and Veterinary Sciences, University of
Antwerp, Antwerp, Belgium.2Faculty of Medicine and Life Sciences, Hasselt University, Agoralaan 1-Building D, 3590, Diepenbeek, Belgium.3Laboratory
of Experimental Medicine and Pediatrics, University of Antwerp, Antwerp, Belgium.4Department of Pediatrics, Antwerp University Hospital, Antwerp,
Belgium.5Faculty of Medicine and Health Sciences, University of Antwerp, Antwerp, Belgium.6Center for Statistics, Hasselt University, Diepenbeek,
Belgium.7Vaccine & Infectious Disease Institute, University of Antwerp,
Antwerp, Belgium.8Department of Microbiology, Klina Hospital, Antwerp,
Belgium.
Received: 18 March 2013 Accepted: 23 April 2013 Published: 30 April 2013
References
1. Olds T, Maher C, Zumin S, Peneau S, Lioret S, Castetbon K,et al:Evidence that the prevalence of childhood overweight is plateauing: data from nine countries.Int J Pediatr Obes2011,6:342–360.
2. Gupta N, Goel K, Shah P, Misra A:Childhood obesity in developing countries: epidemiology, determinants, and prevention.Endocr Rev2012,
33:48–70.
3. Lakshman R, Elks CE, Ong KK:Childhood obesity.Circulation2012,
126:1770–1779.
4. Weiss R:Metabolic syndrome in childhood - causes and effects.Endocr Dev2010,19:62–72.
5. Burgert TS, Taksali SE, Dziura J, Goodman TR, Yeckel CW, Papademetris X,et al:Alanine aminotransferase levels and fatty liver in childhood obesity: associations with insulin resistance, adiponectin, and visceral fat.J Clin Endocrinol Metab2006,91:4287–4294.
6. Whitaker RC, Wright JA, Pepe MS, Seidel KD, Dietz WH:Predicting obesity in young adulthood from childhood and parental obesity.N Engl J Med 1997,337:869–873.
7. Freedman DS, Khan LK, Serdula MK, Dietz WH, Srinivasan SR, Berenson GS:
The relation of childhood BMI to adult adiposity: the Bogalusa Heart Study.Pediatrics2005,115:22–27.
8. Maffeis C:Aetiology of overweight and obesity in children and adolescents.Eur J Pediatr2000,159(Suppl 1):S35–S44.
9. Cani PD, Bibiloni R, Knauf C, Waget A, Neyrinck AM, Delzenne NM,et al:
Changes in gut microbiota control metabolic endotoxemia-induced inflammation in high-fat diet-induced obesity and diabetes in mice.
Diabetes2008,57:1470–1481.
10. Backhed F, Ding H, Wang T, Hooper LV, Koh GY, Nagy A,et al:The gut microbiota as an environmental factor that regulates fat storage.
Proc Natl Acad Sci U S A2004,101:15718–15723.
11. Turnbaugh PJ, Ley RE, Mahowald MA, Magrini V, Mardis ER, Gordon JI:An obesity-associated gut microbiome with increased capacity for energy harvest.Nature2006,444:1027–1031.
12. Murphy EF, Cotter PD, Healy S, Marques TM, O'Sullivan O, Fouhy F,et al:
Composition and energy harvesting capacity of the gut microbiota: relationship to diet, obesity and time in mouse models.Gut2010,
59:1635–1642.
13. Ley RE, Backhed F, Turnbaugh P, Lozupone CA, Knight RD, Gordon JI:
Obesity alters gut microbial ecology.Proc Natl Acad Sci U S A2005,
102:11070–11075.
14. Ley RE, Turnbaugh PJ, Klein S, Gordon JI:Microbial ecology: human gut microbes associated with obesity.Nature2006,444:1022–1023. 15. Duncan SH, Lobley GE, Holtrop G, Ince J, Johnstone AM, Louis P,et al:
Human colonic microbiota associated with diet, obesity and weight loss.
Int J Obes (Lond)2008,32:1720–1724.
16. Schwiertz A, Taras D, Schafer K, Beijer S, Bos NA, Donus C,et al:Microbiota and SCFA in lean and overweight healthy subjects.Obesity (Silver Spring) 2010,18:190–195.
17. Ferrer M, Ruiz A, Lanza F, Haange SB, Oberbach A, Till H,et al:Microbiota from the distal guts of lean and obese adolescents exhibit partial functional redundancy besides clear differences in community structure.
Environ Microbiol2013,15:211–226.
18. Karlsson CL, Onnerfalt J, Xu J, Molin G, Ahrne S, Thorngren-Jerneck K:The microbiota of the gut in preschool children with normal and excessive body weight.Obesity (Silver Spring)2012,20:2257–2261.
19. Vael C, Verhulst SL, Nelen V, Goossens H, Desager KN:Intestinal microflora and body mass index during the first three years of life: an
observational study.Gut Pathog2011,3:8.
20. Mackie RI, Sghir A, Gaskins HR:Developmental microbial ecology of the neonatal gastrointestinal tract.Am J Clin Nutr1999,69:1035S–1045S. 21. Penders J, Thijs C, Vink C, Stelma FF, Snijders B, Kummeling I,et al:Factors
influencing the composition of the intestinal microbiota in early infancy.
Pediatrics2006,118:511–521.
22. Vrieze A, Holleman F, Zoetendal EG, de Vos WM, Hoekstra JB, Nieuwdorp M:
The environment within: how gut microbiota may influence metabolism and body composition.Diabetologia2010,53:606–613.
23. Vanhoutte T, Huys G, Brandt E, Swings J:Temporal stability analysis of the microbiota in human feces by denaturing gradient gel electrophoresis using universal and group-specific 16S rRNA gene primers.FEMS Microbiol Ecol2004,48:437–446.
24. Kalliomaki M, Collado MC, Salminen S, Isolauri E:Early differences in fecal microbiota composition in children may predict overweight.Am J Clin Nutr2008,87:534–538.
25. Zoetendal EG, Rajilic-Stojanovic M, de Vos WM:High-throughput diversity and functionality analysis of the gastrointestinal tract microbiota.
Gut2008,57:1605–1615.
26. Nagy E, Maier T, Urban E, Terhes G, Kostrzewa M:Species identification of clinical isolates of Bacteroides by matrix-assisted laser-desorption /ionization time-of-flight mass spectrometry.Clin Microbiol Infect2009,
27. Wu X, Ma C, Han L, Nawaz M, Gao F, Zhang X,et al:Molecular characterisation of the faecal microbiota in patients with type II diabetes.Curr Microbiol2010,61:69–78.
28. Qin J, Li R, Raes J, Arumugam M, Burgdorf KS, Manichanh C,et al:A human gut microbial gene catalogue established by metagenomic sequencing.
Nature2010,464:59–65.
29. Fang H, Hedin G:Rapid screening and identification of methicillin-resistant Staphylococcus aureus from clinical samples by selective-broth and real-time PCR assay.J Clin Microbiol2003,41:2894–2899.
30. Matsuki T, Watanabe K, Fujimoto J, Takada T, Tanaka R:Use of 16S rRNA gene-targeted group-specific primers for real-time PCR analysis of predominant bacteria in human feces.Appl Environ Microbiol2004,
70:7220–7228.
31. Rinttila T, Kassinen A, Malinen E, Krogius L, Palva A:Development of an extensive set of 16S rDNA-targeted primers for quantification of pathogenic and indigenous bacteria in faecal samples by real-time PCR.
J Appl Microbiol2004,97:1166–1177.
32. Million M, Maraninchi M, Henry M, Armougom F, Richet H, Carrieri P,et al:
Obesity-associated gut microbiota is enriched in Lactobacillus reuteri and depleted in Bifidobacterium animalis and Methanobrevibacter smithii.Int J Obes (Lond)2012,36:817–825.
33. Santacruz A, Marcos A, Warnberg J, Marti A, Martin-Matillas M, Campoy C, et al:Interplay between weight loss and gut microbiota composition in overweight adolescents.Obesity (Silver Spring)2009,17:1906–1915. 34. Hartemink R, Domenech VR, Rombouts FM:LAMVAB - A selective medium
for the isolation of lactobacilli from faeces.J Microbiol Methods1997,
29:77–84.
35. Ismail NA, Ragab SH, Elbaky AA, Shoeib ARS, Alhosary Y, Fekry D:Frequency of Firmicutes and Bacteroidetes in gut microbiota of obese and normal weight Egyptian children and adults.Arch Med Sci2010,7:501–507. 36. Luoto R, Kalliomaki M, Laitinen K, Isolauri E:The impact of perinatal
probiotic intervention on the development of overweight and obesity: follow-up study from birth to 10 years.Int J Obes (Lond) 2010,34:1531–1537.
37. Cole TJ, Lobstein T:Extended international (IOTF) body mass index cut-offs for thinness, overweight and obesity.Pediatr Obes2012,
7:284–294.
38. Roelants M, Hauspie R, Hoppenbrouwers K:References for growth and pubertal development from birth to 21 years in Flanders, Belgium.Ann Hum Biol2009,36:680–694.
39. Koch FC:Zentralbl. Bakteriol. Parasitenkd.Abt I Orig1942,149:122. 40. Murray PR, Rosenthal KS, Kobayashi GS, Pfaller MA:Anaerobic gram-negative
bacilli. InMedical Microbiology.St. Louis: Elsevier Mosby; 2002:354–358. 41. Ellner PD, Stoessel CJ, Drakeford E, Vasi F:A new culture medium for
medical bacteriology.Tech Bull Regist Med Technol1966,36:58–60. 42. Rada V, Petr J:A new selective medium for the isolation of glucose
non-fermenting bifidobacteria from hen caeca.J Microbiol Methods2000,
43:127–132.
43. Mariat D, Firmesse O, Levenez F, Guimaraes V, Sokol H, Dore J,et al:The Firmicutes/Bacteroidetes ratio of the human microbiota changes with age.BMC Microbiol2009,9:123.
44. Breiman L:Random forests.Mach Learn2001,45:5–32.
doi:10.1186/1757-4749-5-10
Cite this article as:Bervoetset al.:Differences in gut microbiota composition between obese and lean children: a cross-sectional study.
Gut Pathogens20135:10. Submit your next manuscript to BioMed Central and take full advantage of:
• Convenient online submission
• Thorough peer review
• No space constraints or color figure charges
• Immediate publication on acceptance
• Inclusion in PubMed, CAS, Scopus and Google Scholar
• Research which is freely available for redistribution