R E S E A R C H
Open Access
Development and validation of a screening
instrument to assess the types and quality of
foods served at home meals
Jayne A Fulkerson
1*, Leslie Lytle
2, Mary Story
2, Stacey Moe
2, Anne Samuelson
2,3and Audrey Weymiller
1Abstract
Background:Although there is growing interest in assessing the home food environment, no easy-to-use, low cost tools exist to assess the foods served at home meals, making it difficult to assess the meal component of the food environment. The aim of this study was to develop and validate a user-friendly screener to assess the types of foods served at home meals.
Methods:Primary food preparing adults (n = 51) participated in a validation study in their own homes. Staff and participants independently completed a screener as participants cooked dinner. The screener assessed the types of foods offered, method(s) of preparation, and use of added fats. Two scale scores were created: 1) to assess offerings of foods in five food groups (meat and other protein, milk, vegetables, fruit, grains), 2) to assess the relative healthfulness of foods based on types offered, preparation method, and added fats. Criterion validity was assessed comparing staff and participant reports of individual foods (kappa (k)) and scale scores (Spearman correlations).
Results:Criterion validity was high between participants’ and staffs’ record of whether major food categories (meat and other protein, bread and cereal, salad, vegetables, fruits, dessert) were served (k = 0.79-1.0), moderate for reports of other starches (e.g., rice) being served (k = 0.52), and high for the Five Food Group and Healthfulness scale scores (r = 0.75-0.85,p< .001).
Conclusions:This new meal screening tool has high validity and can be used to assess the types of foods served at home meals allowing a more comprehensive assessment of the home food environment.
Keywords:Validation, Meal screener, Dinner, Home, Families, Food
Background
Studies have shown that compared to foods consumed at home, away-from-home foods are higher in fat and calories [1] and contribute to poorer dietary quality and overweight status [2-6]. Thus, health and nutrition experts recommend limiting eating out and encourage more frequent home meal preparation [7]. The impor-tance of the home environment in influencing food intake and weight status has prompted the development of new valid instruments to assess food availability within the home food environment [8,9]. Although
these instruments assess foods available in the home, no validated instruments exist to assess what types of foods are served specifically at meals within the home. Foods served at meals may include a subset of those available within the home. Moreover, little is known about how these foods are prepared which may be important in regard to fat content.
The family meal component of the home food envir-onment has been gaining national attention, particularly because research has shown that family meals positively impact the dietary intake of children [10-17] and may be associated with overweight status, particularly among young children [10,15,18,19]. Because almost 70% of cal-ories and 80% of snacks consumed by children ages 6-11 years are eaten in the home [2], developing measures
* Correspondence: [email protected]
1
School of Nursing, University of Minnesota, 5-160 Weaver-Densford Hall, 308 Harvard Street SE, Minneapolis, MN 55455, USA
Full list of author information is available at the end of the article
to assess the types of foods served at home meals is an important first step in gaining a better understanding of
the influence of the home environment on children’s
food intake [20]. Although assessment of dietary intake at specific meals could be conducted with traditional methods of dietary recall interviews, this methodology is expensive and time- and labor-intensive. Thus, a practi-cal, easy-to-use valid instrument is needed for these assessments as the health promotion field encourages and advocates healthy lifestyle changes for families.
The purpose of this study was to develop and validate a self-administered screening instrument to assess the types of foods served at meals in the home setting. Additional goals included developing an instrument that was easy to self-administer using a format that captured a variety of foods, and that could provide summary indi-cators of food quality.
Methods
Procedures
Primary meal preparing adults (one per home where a child between the ages of 8 and 18 years resided) were recruited from the community using flyers posted at 19 Minneapolis Park and Recreation Centers to complete the screening instrument as they made a typical evening meal ("meal”was undefined) in their home. Participants were also invited to participate in three other studies at the time of screening, including validation of a home food inventory [9] and validation of home physical activ-ity and media equipment [21] using similar methodol-ogy. Trained research staff traveled to the participants’ homes to obtain written consent and independently complete the instrument while observing the participant preparing the meal. The screener typically took 5-15 min to complete, depending on the number of ingredi-ents included in the meal. Participants did not receive
“training”on how to complete the screener as the intent was for the screener’s written directions to be self-expla-natory to facilitate independent completion. Instructions indicated to list all foods and beverages prepared or made available as part of the evening meal, even if only one person ate it. Participants received a $30 gift card for their participation. The University of Minnesota’s Institutional Review Board approved this study.
Participants
The validation sample consisted of 51 adults aged 23-53 years (M = 39.4, SD = 7.0; 94% female). Sixty-eight per-cent of the sample was white, followed by African American (14%), American Indian (6%), mixed race/eth-nicity (6%), Latino (4%), and Asian (2%). Over half (62%) had a college degree, 26% had some college or vocational training and 12% had a high school degree or less.
Measures
Meal screener: development
Development of the screening instrument began with the investigators drafting items to reflect categories of foods that might be served at home meals and those likely to be useful to assess relative healthfulness. Preset food categories were used to facilitate instrument com-pletion, scoring and analysis. Opinions from four inter-nationally-respected nutrition experts were requested for further instrument development and assessment of face validity (see acknowledgements). The instrument was then revised to more finely discriminate between more and less healthful foods (e.g., by providing more options for sauces that were clearer in regard to fat content), account for mixed dishes, and clarify the instructions. Field testing of the instrument was conducted with five adults to inform revisions for the final version regarding ease of completion and to identify any foods that were difficult to include on the form.
Meal screener: final version
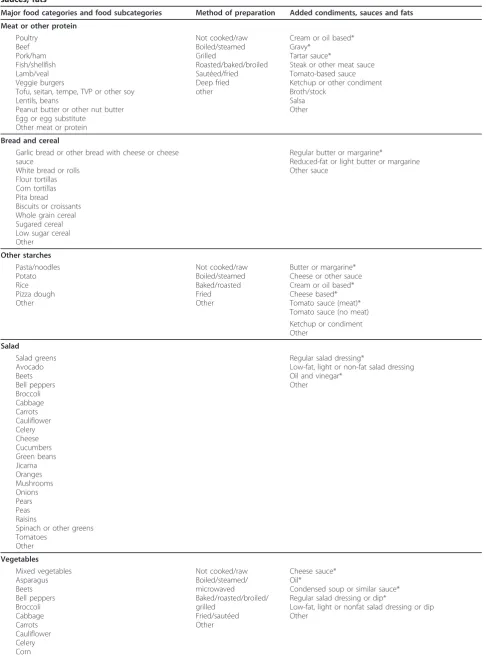
The final screener included an open-ended section for participants to write in foods that were served at the evening meal. Examples were provided to indicate that they should list main course, side dishes, beverages and dessert, if applicable. This initial step provided the parti-cipant with a reminder of what was served to assist with subsequent questions regarding preparation. The next section of the screener asked specific questions about the types of foods served and method of preparation in preset major food categories: 1) meat or other protein, 2) bread or cereal, 3) starches other than bread (e.g., pasta, noodles, potatoes, rice, pizza dough), 4) salad, 5) vegetables (other than potato), 6) fruit, 7) dessert, and 8) beverages. Foods within each major food category (e.g., pork (as food subcategory) within the meat/protein major food category) were presented in a checklist for-mat (yes/no if served) and included a checklist for pre-paration options and added fats (e.g., butter, sauce).
Table 1 describes the specific foods included in each major food category. For example, for the protein cate-gory, a participant would check “yes” if meat or other protein was served (i.e., served major food category) and then be prompted to check the specific type of food that was served within that category (e.g., poultry food sub-category). Then, he/she was instructed to check response options regarding method of preparation and whether or not fats were added during the cooking or serving process.
Scale scores
Table 1 Description of major food categories, food subcategories, method of preparation and added condiments, sauces, fatsa
Major food categories and food subcategories Method of preparation Added condiments, sauces and fats
Meat or other protein
Poultry Beef Pork/ham Fish/shellfish Lamb/veal Veggie burgers
Tofu, seitan, tempe, TVP or other soy Lentils, beans
Peanut butter or other nut butter Egg or egg substitute
Other meat or protein
Not cooked/raw Boiled/steamed Grilled
Roasted/baked/broiled Sautéed/fried Deep fried other
Cream or oil based* Gravy*
Tartar sauce*
Steak or other meat sauce Tomato-based sauce Ketchup or other condiment Broth/stock
Salsa Other
Bread and cereal
Garlic bread or other bread with cheese or cheese sauce
White bread or rolls Flour tortillas Corn tortillas Pita bread Biscuits or croissants Whole grain cereal Sugared cereal Low sugar cereal Other
Regular butter or margarine*
Reduced-fat or light butter or margarine Other sauce
Other starches
Pasta/noodles Potato Rice Pizza dough Other
Not cooked/raw Boiled/steamed Baked/roasted Fried Other
Butter or margarine* Cheese or other sauce Cream or oil based* Cheese based* Tomato sauce (meat)* Tomato sauce (no meat) Ketchup or condiment Other
Salad
Salad greens Avocado Beets Bell peppers Broccoli Cabbage Carrots Cauliflower Celery Cheese Cucumbers Green beans Jicama Oranges Mushrooms Onions Pears Peas Raisins
Spinach or other greens Tomatoes
Other
Regular salad dressing*
Low-fat, light or non-fat salad dressing Oil and vinegar*
Other
Vegetables
Mixed vegetables Asparagus Beets Bell peppers Broccoli Cabbage Carrots Cauliflower Celery Corn
Not cooked/raw Boiled/steamed/ microwaved Baked/roasted/broiled/ grilled
Fried/sautéed Other
Cheese sauce* Oil*
Condensed soup or similar sauce* Regular salad dressing or dip*
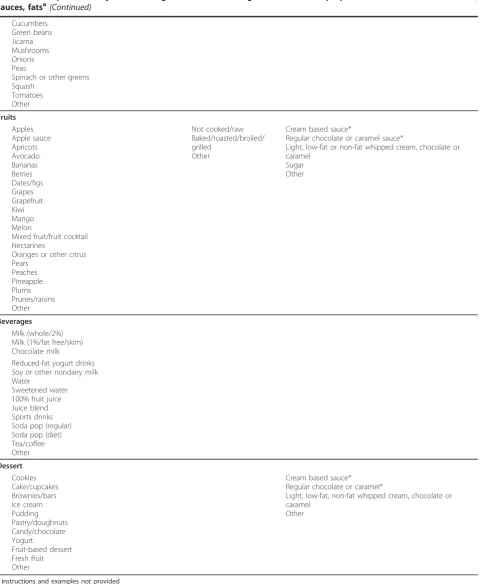
Table 1 Description of major food categories, food subcategories, method of preparation and added condiments, sauces, fatsa(Continued)
Cucumbers Green beans Jicama Mushrooms Onions Peas
Spinach or other greens Squash
Tomatoes Other
Fruits
Apples Apple sauce Apricots Avocado Bananas Berries Dates/figs Grapes Grapefruit Kiwi Mango Melon
Mixed fruit/fruit cocktail Nectarines
Oranges or other citrus Pears
Peaches Pineapple Plums Prunes/raisins Other
Not cooked/raw Baked/roasted/broiled/ grilled
Other
Cream based sauce*
Regular chocolate or caramel sauce*
Light, low-fat or non-fat whipped cream, chocolate or caramel
Sugar Other
Beverages
Milk (whole/2%) Milk (1%/fat free/skim) Chocolate milk
Reduced-fat yogurt drinks Soy or other nondairy milk Water
Sweetened water 100% fruit juice Juice blend Sports drinks Soda pop (regular) Soda pop (diet) Tea/coffee Other
Dessert
Cookies Cake/cupcakes Brownies/bars Ice cream Pudding Pastry/doughnuts Candy/chocolate Yogurt
Fruit-based dessert Fresh fruit Other
Cream based sauce* Regular chocolate or caramel*
Light, low-fat, non-fat whipped cream, chocolate or caramel
Other
a
on types of foods offered, preparation method, and added fats. For the Five Food Group score, participants were given one point for serving at least one food in each food group (range = 0-5). To more fully examine food offerings to include methods of food preparation and added fats, for the Healthfulness scale score, partici-pants were given a point for serving a food from each of the major food categories and a point for a healthy pre-paration method (e.g., baking); a point was subtracted if a high-calorie sauce was added (range = 0-10). The screener is available from the corresponding author upon request.
Data analysis
Criterion validity was assessed by comparing partici-pants’ and research staffs’ responses on the screener. Consistent in research of criterion validity, the research staff report was considered the“gold standard” [23] as they were trained on how to use the screener. Kappa and Spearman correlation statistics were used to evalu-ate these comparisons for individual foods, food cevalu-ate- cate-gories and scale scores (Five Food Group and Healthfulness scores), respectively. Kappa statistics greater than 0.60 reflect substantial agreement. To sum-marize these results, we calculated the average kappas (across individual foods) within major food categories. All analyses were conducted in SAS (v9.1, SAS Institute, Inc., Cary, NC, 2003).
Results
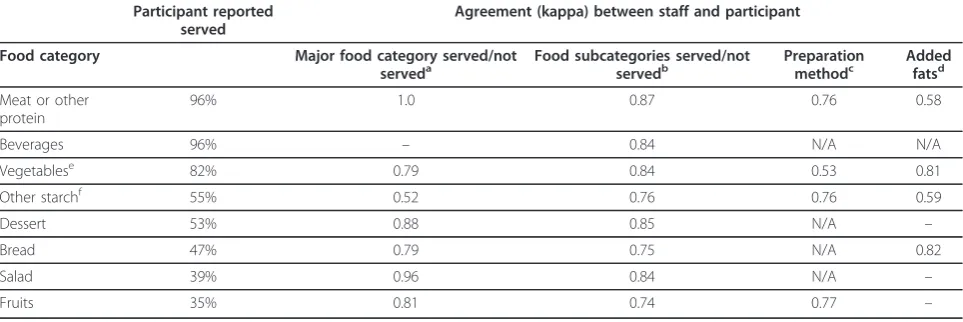
As shown in Table 2, the most frequently served major food categories at the home evening meal were meat or other protein and vegetables. Less than half of partici-pants reported serving bread, salad or fruits. Dessert was served by about half of participants while beverages were served by almost all participants. In regard to the Five Food Group score, about one-third (37%) of partici-pants reported serving foods from four of the five food groups, followed by foods from three food groups (27%), five food groups (18%), and two food groups (12%); 4% reported serving from one food group, and 2% did not serve foods from any of the five food groups. The Healthfulness scale score average was about 5 out of 10 (M = 4.6, SD = 1.8).
Table 2 provides a description of criterion validity (kappa statistics) with comparisons of agreement between the trained staff data (gold standard) and parti-cipants’data regarding whether or not a food was served from a major food category (e.g., meat or other protein; column 3), across foods within each major food category (food subcategory, column 4), method of preparation (column 5), and added fats (column 6). Kappa statistics between participants’and staffs’record of whether meat or other protein, beverages, vegetables, dessert, bread, salad, fruits were served ranged from 0.79 (vegetables) to 1.0 (meat or other protein), while the kappa value for serving other starches was 0.52. Average kappa values
Table 2 Prevalence of serving foods in major food categories and criterion validity of major food categories, food subcategories, method of preparation and use of added fats (n = 51)
Participant reported served
Agreement (kappa) between staff and participant
Food category Major food category served/not serveda
Food subcategories served/not servedb
Preparation methodc
Added fatsd
Meat or other protein
96% 1.0 0.87 0.76 0.58
Beverages 96% – 0.84 N/A N/A
Vegetablese 82% 0.79 0.84 0.53 0.81
Other starchf 55% 0.52 0.76 0.76 0.59
Dessert 53% 0.88 0.85 N/A –
Bread 47% 0.79 0.75 N/A 0.82
Salad 39% 0.96 0.84 N/A –
Fruits 35% 0.81 0.74 0.77 –
a
kappa comparing staff and participant report of whether major food category was served
b
kappa comparing staff and participant report of whether subcategory foods were served (averaged across foods within same subcategory)
c
includes raw/not cooked, boiled/steamed, grilled, roasted/baked/broiled, sautéed/fried, deep fried
d
includes sauces/condiments for meat or other protein, vegetables and other starches, butter/margarine/other sauce for breads and vegetables, salad dressings for salads, and sauces for fruit and dessert
e
includes vegetables other than potato
f
includes pasta/noodles, potato, rice, pizza dough, and other
–unable to calculate kappa because all participants reported that beverages were always served; all staff reported all salads were served with dressing; no one
reported fruits or desserts served with sauce
for each major food category ranged from 0.74 (fruits) to 0.87 (meat or other protein). Average kappa values for method of preparation ranged from 0.53 (vegetables) to 0.77 (fruits) and values for added fats ranged from 0.59 (other starches) to 0.81 (vegetables). Comparisons between staff and participant scores for Five Food Group and Healthfulness scale scores resulted in corre-lations of 0.75 (p < .001) and 0.85 (p < .001), respectively.
Discussion
This study describes the development and validation of an instrument to assess the types of foods served at home for the evening meal. The screener was developed to include a full range of foods that may be served at meals, particularly the evening meal, and a variety of healthful and unhealthful preparation methods. Study findings indicate the screening instrument has substan-tial criterion validity, and the checklist-type format was easily completed by participants in their homes.
The new screening instrument demonstrated criterion validity with moderate to high kappa values between participants’and staffs’reports of foods served at meals in the home and significant correlations between their scale scores regarding foods from the five major food groups and the healthfulness of foods. These findings and the fact that participants easily completed the screener suggests this tool can be used to effectively assess the types of foods served at meals. Costs and time associated with data collection in research studies could be reduced since participants are able to complete the screener in their own homes without research staff.
The Five Food Group and Healthfulness scales and most of the food categories showed substantial criterion validity; however, two comparisons resulted in kappas of less than 0.60. The general question of whether or not other starches were served had only moderate criterion validity. A detailed examination of these data indicates that staff were more likely to code“other starch”as pre-sent compared to participants. Perhaps the term“starch” is less commonly known among the general public even though pasta, noodles, potatoes, rice, and pizza dough were listed as examples. More research is needed in this area to assess how best to describe starchy carbohy-drates on surveys. The suboptimal agreement between staff and participants regarding preparation method for vegetables resulted from the greater likelihood of staff reports of frying vegetables compared to participant reports. It may be that participants only recognize frying in deep fat as “frying.” Future versions of the screener may separate out frying from sautéing to help increase validity.
The high average validity indices for added fats for vegetables and bread suggest that the screening
instrument may be useful for studies interested in redu-cing butter and sauces as a form of weight control or to reduce cholesterol. In addition, the ease of completion with regard to time (participants completed the form as they prepared the meal) and convenience and the low cost of the data collection are great assets of this tool for population-based studies, particularly those promot-ing healthful foods such as salads, fresh vegetables, fruit for dessert, and milk consumption. Furthermore, although the screener was developed to assess the eve-ning meal, further testing should be completed to evalu-ate its use for breakfast or lunch meals made at home.
To interpret the findings of this study, several issues warrant discussion. Study participants were self-selected volunteers and may not represent the general population in terms of motivation to complete the instrument and the types of meals prepared. In fact, some adults partici-pated in several validation studies conducted by the research team, perhaps indicating a highly motivated group that may have been more conscientious in com-pleting the screener, although none of our data or anec-dotal evidence support this bias. Although the authors carefully considered many food varieties and those from different cultures, the screener may not capture all foods served at home meals and all methods of prepara-tion (e.g., microwave cooking of protein) used by some families. Mixed dishes that contained many ingredients (e.g., soups) were more difficult to code on the instru-ment; however, problems were lessened when specific instructions were added during screener development. The instrument also includes additional “other” spaces for coding that could be used for foods common to a particular population. In addition, the screener does not assess thequantityof foods served at meals since parti-cipants either check “yes” or “no.” However, our mea-sure of a wide variety of different types of foods served at meals is similar to the variety score of the Healthy Eating Index [24] and may be linked to better diet qual-ity. Our aim was to create a brief screener and keep response burden to a minimum. Attempting to collect data on more foods, quantities of foods, or more speci-fics about foods such as brand names would have com-promised our aim. Lastly, the screener does not measure what was eaten at other eating occasions or at meals, only what was served at mealtime. In addition, the screener was designed to assess foods that are prepared in the home, limiting its utility for meals that are pur-chased elsewhere (i.e., takeout) but eaten in the home. Future research is needed to address the present study’s limitations.
Conclusions
home meals and it proved to be a valid and participant-friendly tool that may be useful for research studies aim-ing to understand the home food environment, particu-larly those that are community-based where data collection is expensive and time-consuming. The screener adds a new and important meal component to the limited number of validated instruments that assess the home food environment. Furthermore, identifying the types and quality of foods served at home meals can help inform appropriate intervention strategies for indi-vidual households or might identify targets for public health messages. Future research should include more specific indices of healthfulness and assess the instru-ment’s construct validity and test-retest reliability.
Acknowledgements
This study was supported by the University of Minnesota Graduate School’s Grant-in-Aid program (PI: Jayne A. Fulkerson) and as part of the IDEA study (PI: Leslie Lytle) funded by NCI’s Transdisciplinary Research in Energetics and Cancer Initiative (NCI Grant 1 U54 CA116849-01, Examining the Obesity Epidemic Through Youth, Family, and Young Adults, PI: Robert Jeffery). The authors would like to thank Lisa Harnack, Dianne Neumark-Sztainer, Marla Reicks, and Simone French for their expert advice on the layout, content and initial development of the meal screening instrument.
Author details
1School of Nursing, University of Minnesota, 5-160 Weaver-Densford Hall, 308
Harvard Street SE, Minneapolis, MN 55455, USA.2Division of Epidemiology & Community Health, University of Minnesota, 1300 South Second Street, Suite 300, Minneapolis, MN 55454, USA.3Human Development & Family Studies,
University of Wisconsin-Madison, Madison, USA.
Authors’contributions
JF conceptualized the study design, drafted the original screening tool, field tested the tool, requested input from experts in the field, trained staff for data collection, conducted the data analysis, and drafted the manuscript. LL and MS assisted with conceptualizing the study design and developing the screening tool as well as revising the manuscript for critical intellectual content. SM coordinated all data collection, data cleaning and data entry, contributed to protocol/instrument revisions and revised the manuscript for critical intellectual content. AS collected data and contributed to protocol/ instrument revisions. AW contributed to instrument revisions and concept scoring. All authors have given final approval of the final version of the manuscript.
Competing interests
The authors declare that they have no competing interests.
Received: 16 December 2010 Accepted: 7 February 2012 Published: 7 February 2012
References
1. Guthrie JF, Lin BH, Frazao E:Role of food prepared away from home in the American diet, 1977-78 versus 1994-96: changes and consequences.
J Nutr Educ Behav2002,34:140-150.
2. Lin B, Guthrie J, Frazao E:Quality of children’s diets at and away from home: 1994-96.Food Rev1999,22:2-10.
3. Ayala GX, Rogers M, Arredondo EM, Campbell NR, Baquero B, Duerksen SC, Elder JP:Away-from-home food intake and risk for obesity: examining the influence of context.Obesity (Silver Spring)2008,16:1002-1008. 4. Thompson OM, Ballew C, Resnicow K, Must A, Bandini LG, Cyr H, Dietz WH:
Food purchased away from home as a predictor of change in BMI z-score among girls.Int J Obes Relat Metab Disord2004,28:282-289.
5. Downs SM, Arnold A, Marshall D, McCargar LJ, Raine KD, Willows ND:
Associations among the food environment, diet quality and weight status in Cree children in Quebec.Public Health Nutr2009,12:1504-1511. 6. Kant AK, Graubard BI:Eating out in America, 1987-2000: trends and
nutritional correlates.Prev Med2004,38:243-249.
7. U.S. Department of Health and Human Services:Strategic plan for NIH obesity research: a report of the NIH Obesity Research Task ForceBethesda, MD: U.S. Department of Health and Human Services, National Institutes of Health; 2004, NIH Publication No. 04-5493.
8. Bryant M, Stevens J:Measurement of food availability in the home.Nutr Rev2006,64:67-76.
9. Fulkerson JA, Nelson MC, Lytle L, Moe S, Heitzler C, Pasch KE:The validation of a home food inventory.Int J Behav Nutr Phys Act2008,5:55. 10. Gable S, Chang Y, Krull JL:Television watching and frequency of family
meals are predictive of overweight onset and persistence in a national sample of school-aged children.J Am Diet Assoc2007,107:53-61. 11. Boutelle KN, Fulkerson JA, Neumark-Sztainer D, Story M, French SA:Fast
food for family meals: relationships with parent and adolescent food intake, home food availability and weight status.Public Health Nutr2007,
10:16-23.
12. Larson NI, Neumark-Sztainer D, Hannan PJ, Story M:Family meals during adolescence are associated with higher diet quality and healthful meal patterns during young adulthood.J Am Diet Assoc2007,107:1502-1510. 13. Boutelle KN, Birnbaum AS, Lytle LA, Murray DM, Story M:Associations
between perceived family meal environment and parent intake of fruit, vegetables, and fat.J Nutr Educ Behav2003,35:24-29.
14. Videon TM, Manning CK:Influences on adolescent eating patterns: the importance of family meals.J Adolesc Health2003,32:365-373. 15. Taveras EM, Rifas-Shiman SL, Berkey CS, Rockett HR, Field AE, Frazier AL,
Colditz GA, Gillman MW:Family dinner and adolescent overweight.Obes Res2005,13:900-906.
16. Gillman MW, Rifas-Shiman SL, Frazier AL, Rockett HR, Camargo CA Jr, Field AE, Berkey CS, Colditz GA:Family dinner and diet quality among older children and adolescents.Arch Fam Med2000,9:235-240. 17. Utter J, Scragg R, Schaaf D, Mhurchu CN:Relationships between
frequency of family meals. BMI and nutritional aspects of the home food environment among New Zealand adolescents.Int J Behav Nutr Phys Act2008,5:50.
18. Fulkerson JA, Neumark-Sztainer D, Hannan PJ, Story M:Family Meal Frequency and Weight Status Among Adolescents: Cross-sectional and 5-year Longitudinal Associations.Obesity (Silver Spring)2008,16:2529-2934. 19. Sen B:Frequency of family dinner and adolescent body weight status:
evidence from the national longitudinal survey of youth, 1997.Obesity (Silver Spring)2006,14:2266-2276.
20. Briefel RR, Wilson A, Gleason PM:Consumption of low-nutrient, energy-dense foods and beverages at school, home, and other locations among school lunch participants and nonparticipants.J Am Diet Assoc2009,109: S79-90.
21. Sirard JR, Nelson MC, Pereira MA, Lytle LA:Validity and reliability of a home environment inventory for physical activity and media equipment.Int J Behav Nutr Phys Act2008,5:24.
22. Shaw A, Fulton L, Davis C, Hogbin M:Using the food guide pyramid: a resource for nutrition educators..
23. Cronbach LJ:Test validation.InEducational Measurement..2 edition. Edited by: Thorndike RL. Washington, DC: American Council on Education; 1971:. 24. Basiotis PP, Carlson A, Gerrior SA, Juan WY, Lino M:The healthy eating
index: 1999-2000.U.S. Department of Agriculture, Center for Nutrition Policy and Promotion; 2002, Publication No. CNPP-12.
doi:10.1186/1479-5868-9-10
Cite this article as:Fulkersonet al.:Development and validation of a screening instrument to assess the types and quality of foods served at home meals.International Journal of Behavioral Nutrition and Physical