ISSN: 2230-7346 Research Article
Journal of Global Trends in Pharmaceutical Sciences
Vol.2, Issue 4, pp -380-393, Oct-Dec 2011
BIO-ANALYTICAL METHOD DEVELOPMENT AND VALIDATION FOR THE ESTIMATION OF GRISEOFULVIN IN K3EDTA HUMAN PLASMA BY
LC-MS/MS
Venkata Ramakrishna.T*¹, Anbarasi.B², N. Senthil kumar²
1. Department of Pharmaceutical Analysis, JKKMMRF College of Pharmacy, Komarapalayam, Tamil Nadu.
2. Department of Pharmaceutical Chemistry, JKKMMRF College of Pharmacy, Komarapalayam, Tamil Nadu.
*Corresponding author E-mail:[email protected]
ABSTRACT
stream of nitrogen gas at 50°c. Reconstituted the residue with 0.250 ml of mobile phase and vortex. Loaded the sample into auto-injector vials. Injected 15µL onto LC-MS/MS system.
Key Words:Griseofulvin, K3EDTA, Human plasma, Ria vial, Nitrogen gas.
INTRODUCTION:
The bioanalytical methods used to determine the drug and/or its metabolites in the plasma, serum, blood or urine or any other suitable matrix must be well characterized, standardized, fully validated and documented to yield reliable results that can be satisfactorily interpreted. Drug profile:
Griseofulvin is a antifungal-antibiotic. Its chemical name is (2S,61R)-7-Chloro-21,4,6-trimethoxy-61 -methyl-3H,41 H-Spir0(1-benzofuran-2,11-cyclohex(2)ene)-3,4-dione. And its molecular formula is C17H17ClO6 and its molecular weight is 352.77 gm/mol.
Trichophyton. It has no effect on bacteria or other genera of fungi.The drug binds to tubulin, interfering with microtubule function, thus inhibiting mitosis.
Experimental Method
Reagents & Requirements
Griseofulvin, Griseofulvin D3,Formic acid, Acetonitrile, Dichloromethane, Methanol, Diethyl ether, HPLC grade Water, Micro balance, Micro pipette, Glass bottles, Volumetric flask, Vortexer, Deep freezer (-20±5 ), Deep freezer(-70±15°c), Nitrogen evaporator, Refrigerator, SPE Positive pressure, Pipette tips, Surgical gloves, Combitips, Cartridge, RIA vial.
Preparation of Solutions
Griseofulvin into a 5.000 mL volumetric flask and dissolve in methanol. Make up the volume with the same. Prepare the stock for CCs and QCs spiking separately. Calculate the concentration of resulting solutions by considering the purity of Griseofulvin. Label and store the solutions at 2-8ºC.
Preparation of Internal standard stock solution:
Weight and transfer Griseofulvin-d3 working standard equivalent to 2.000 mg of Griseofulvin-d3 into a 2.000 mL volumetric flask and dissolve in acetonitrile. Make up the volume with the same. Calculate the concentration of resulting solution by considering the purity of Griseofulvin-d3. Label and store the solution at 2-8ºC. Then fill the ´Stock Weighing and solution Preparatioǹ form. Dilute the stock solution
with 80% Acetonitrile in water solution as and when required to get a concentration of about 10.000 µ / ml.
Preparation of Reference Standard Solution: Prepare a mixture of 1.000 µg/mL concentration of Griseofulvin and 1.000
µg/mL concentration of ISTD (Griseofulvin-d3) in mobile phase.
Preparation of 0.05% Formic acid Buffer (pH 5.5):
Transfer 585 µL of Formic acid in 1000.000 mL of water and sonicate. Label and store the solution at ambient temperature.
Preparation of Mobile phase:
To 300.000 mL of above 0.05% Formic acid buffer, add 700.000 mL of Acetonitrile mix well and sonicate. Label and store the solution at ambient temperature.
Perparation of 10% Acetonitrile in water solution: To 100.000 mL of acetonitrile, add 900.000 mL of water and sonicate. Label and store the solution at ambient temperature.
Preperation of 80 % Acetonitrile in water solution:
Perparation of 90% Acetonitrile in water solutionL:
To 900.000 mL of acetonitrile, add 100.000 ml of water and sonicate. Label and store the solution at ambient temperature. Preparation of Extraction solvent:
To 200.000 mL of Dichloromethane, add 800.000 mL of Diethyl ether and sonicate. Label and store the solution at ambient temperature.
Preparation of Calibration Curve (CC) Standards:
Preparation of stock dilutions of standard Griseofulvin solution:
Prepared the following stock dilutions of Griseofulvin ranging from 0.400 µg/mL to 60.056 µg/mL with 80 % acetonitrile in water solution using dilutions of main stock solution prepared for calibration curve standards, shown in table 1. Calibration curve (CC) standards:
Table No: 1
Stock Conc. (µg/mL)
Volume of Stock (mL)
Volume of Diluent
(mL)
Final volume
(mL)
Final Conc. (µg/mL)
1000.928 0.120 1.880 2.000 60.056
1000.928 0.080 1.920 2.000 40.037
100.093 0.400 1.600 2.000 20.019
100.093 0.200 1.800 2.000 10.009
100.093 0.100 1.900 2.000 5.005
10.009 0.400 1.600 2.000 2.002
10.009 0.160 1.840 2.000 0.801
10.009 0.080 1.920 2.000 0.400
Spiking of plasma for calibration curve standards:
Prepared the following concentrations of Griseofulvin ranging from 20.000 ng/mL to 3002.800 ng/mL with K3EDTA human
Table No: 2-Preparation of Calibration Curve Standards:
Stock Conc.
(µg/mL) Stock (mL)Volume of Volume of Diluent (mL)
Final volume
(mL)
Final Conc.
(µg/mL) Label
60.056 0.150 2.850 3.000 3002.800 CC8
40,037 0.150 2.850 3.000 2001.850 CC7
20.019 0.150 2.850 3.000 1000.950 CC6
10.009 0.150 2.850 3.000 500.450 CC5
5.005 0.150 2.850 3.000 250.250 CC4
2.002 0.150 2.850 3.000 100.100 CC3
0.801 0.150 2.850 3.000 40.050 CC2
0.400 0.150 2.850 3.000 20.000 CC1
Preparation of Quality Control (QC) samples:
Preparation of stock dilutions of standard Griseofulvin solution:
Prepare the stock dilutions of Griseofulvin ranging from 0.401µg/ml to 50.106µg/ml with 80% acetonitrile in
water solution using dilutions of main stock solution prepared for quality control samples shown in table 3.
Table No: 3-Preparation of Quality control (QC) samples:
Stock Conc.
(µg/mL) Stock (mL)Volume of Diluent (mL)Volume of Final volume (mL) Final Conc.(µg/mL)
1002.118 0.250 4.750 5.000 50.106
1002.118 0.150 4.850 5.000 30.064
100.212 0.300 4.700 5.000 6.013
10.021 0.600 4.400 5.000 1.203
10.021 0.200 40800 5.000 0.401
Spiking of plasma for quality control samples:
Prepare the following concentrations of Griseofulvin ranging from 20.050 ng/mL to 2505.300 ng/mL with K3EDTA human plasma using final concentrations from above table and labeled them as lower limit of quantitation (LLOQ), low
Table No: 4 Preparation of Quality Control (QC) Samples:
Stock Conc.
(µg/mL) Stock (mL)Volume of Volume of Plasma (mL)
Final volume
(mL)
Final Conc.
(ng/mL) Label
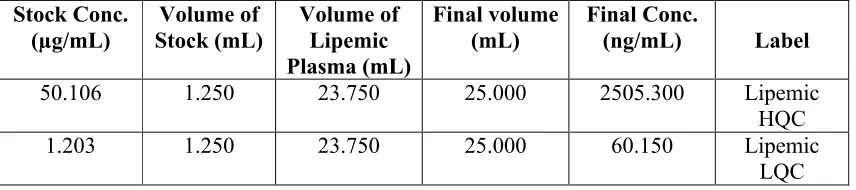
50.106 1.250 23.750 25.000 2505.300 HQC
30.064 1.250 23.750 25.000 1503.200 MQC
6.013 1.250 23.750 25.000 300.650 GMQC
1.203 1.250 23.750 25.000 60.150 LQC
0.401 0.250 4.750 5.000 20.050 LLOQ
Spiking with Haemolytic plasma for quality control samples:
Prepared the following concentrations of Griseofulvin of 60.150 ng/mL and 2505.300 ng/mL with Haemolytic K3EDTA plasma using final
concentrations from the above table and labelled them as Haemolytic LQC and Haemolytic HQC respectively, shown in
table 5.
Table No: 5- Preparation of Quality Control (QC) Samples:
Stock Conc. (µg/mL)
Volume of Stock (mL)
Volume of Haemolytic Plasma (mL)
Final volume
(mL)
Final Conc.
(ng/mL) Label
50.106 1.250 23.750 25.000 2505.300 Haemolytic
HQC
1.203 1.250 23.750 25.000 60.150 Haemolytic
LQC
Spiking of Lipemic plasma for quality control samples:
Table No: 6 Preparation of Quality Control (QC) Samples:
Stock Conc.
(µg/mL) Stock (mL)Volume of Volume of Lipemic Plasma (mL)
Final volume
(mL) Final Conc.(ng/mL) Label
50.106 1.250 23.750 25.000 2505.300 Lipemic
HQC
1.203 1.250 23.750 25.000 60.150 Lipemic
LQC DEVELOPED METHOD:
Biological matrix Human plasma
Anticoagulant K3 EDTA
volume of injection
15µL
Analyte Griseofulvin
Internal standard Griseofulvin –d3 Analytical
technique
Liquid chromatography Detection mode Mass spectrometer
Extraction procedure
Liquid phase extraction Quantitation
method Peak area
Weighing method 1/X2
Chromatographic conditions:
Chromatographic mode LC/MS/MS-API-2000 Mobile phase Formic acid buffer:
Acetonitrile(30:70) Buffer 0.5% formic acid in HPLC water
Column C18
Isocratic/gradient mode Mobile phase flow rate Auto sample temperature
Syringe speed Rinsing volume Column temperature
Injection volume
Isocratic mode 1.000 ml/min
10°c 5µl/sec
600µl 40°c 15µl RETENTION TIMES:
Table 7- DETECTION PARAMETERS
Drug name Griseofulvin Griseofulvin- d3 Parent mass 353.2٭ 356.1٭ Product mass 215.0٭ 168.1 ٭ Table 8- MULTIPLE REACTIONS MONITORING (MRM)
Curtain Gas
(CUR) 20 PSI
Collision Gas (CAD)
4 PSI Nebulizer
Current 2.0
Temperature (TEM)
500OC
GAS-1 40 PSI
GAS-2 50 PSI
Collision Energy (CE)
30 V Entrance
Potential (EP) 10 V
Focusing Potential (FP)
300 V
PARAMETERS Griseofulvin ISTD (Griseofulvin-D3)
Declustering potential (DP)
26 V 30 V
Collision Cell Exit
Potential (CXP) 6 V 5 V
Resolution Q1 : Unit Q3 : Unit DATA COLLECTION AND COMPUTER SYSTEM:
All integrations were performed by Applied Bio systems Analyst® soft ware version 1.4.2. The slopes, intercepts, and
using the ratios of drug/internal standard peak areas of Calibration curve standards.
The concentrations of the unknown sample have to be calculated from the equation using regression analysis of spiked plasma calibration curve standard with 1/x2 as the weighting factor. Y= mx+c
Where,
y = Ratio of Griseofulvin peak area and Griseofulvin-d3
x = concentration of Griseofulvin m = Slope of calibration curve c = y-axis intercept value SAMPLE PROCESSING:
Withdraw blank, calibration curve standards, quality control samples and subject samples from the deep freezer and allow them to thaw. Vortex the thawed samples to ensure complete mixing of
contents. Transfer 0.25ml of human plasma sample in to a Ria vial; add 25µl of Griseofulvin-d3 (approximately 10.000µg/ml). In the blank samples and predose samples ((0.00hr), add 25µl of 80% acetonitrile in water solution .Vortex the samples to ensure mixing of contents completely.
Add 2.500ml of extraction solvent (Dichloromethane: 20:80), place on a shaker for 20 minutes and centrifuge for 10 minutes at 4000rpm at 20°c and transfer the supernatant (organic layer) in to another ria vial. Evaporate this layer under a stream of nitrogen Diethyl ether gas at 50°c. Reconstitute the residue with 0.250 ml of mobile phase and vortex. Load the sample into auto-injector vials. Inject 15µL onto LC-MS/MS system.
VALIDATION AND METHODS:
System suitability 1:
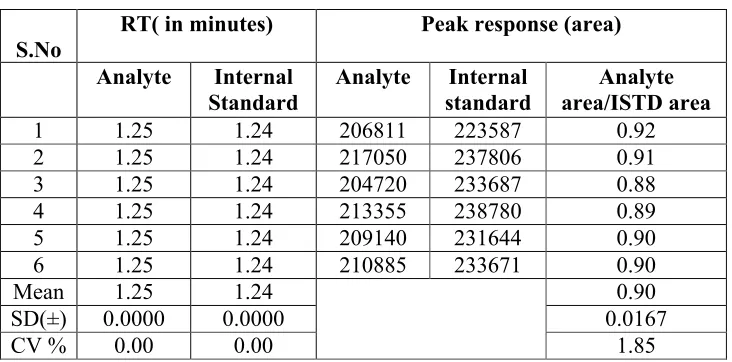
Table No. 9
S.No RT( in minutes) Peak response (area) Analyte Internal
Standard Analyte standardInternal area/ISTD areaAnalyte
1 1.24 1.24 145785 191131 0.76
2 1.25 1.24 146926 200956 0.73
3 1.25 1.24 149663 199737 0.75
4 1.24 1.24 146820 201897 0.73
5 1.25 1.24 146926 204397 0.72
6 1.25 1.24 150701 203280 0.74
Mean 1.25 1.24 0.74
SD(±) 0.0052 0.0000 0.0160
CV % 0.42 0.00 2.17
Table No. 10-System Suitability -2 S.No
RT( in minutes) Peak response (area) Analyte Internal
Standard Analyte standardInternal area/ISTD areaAnalyte
1 1.25 1.24 206811 223587 0.92
2 1.25 1.24 217050 237806 0.91
3 1.25 1.24 204720 233687 0.88
4 1.25 1.24 213355 238780 0.89
5 1.25 1.24 209140 231644 0.90
6 1.25 1.24 210885 233671 0.90
Mean 1.25 1.24 0.90
SD(±) 0.0000 0.0000 0.0167
CV % 0.00 0.00 1.85
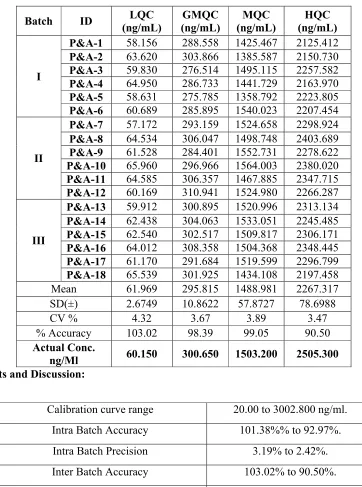
PRECISION AND ACCURACY: The % accuracy observed for inter-batch QC samples was 103.02 %, 98.39%, 99.05 % for LQC, GMQC, MQC and HQC respectively.
The percentage for intra-batch QC
101.26% and 87.34% to 92.97% for LQC,
GMQC, MQC, and HQC respectively. The CV% observed for the inter-batch QC
1.83% to 3.56%, 2.31% to 4.69% and 2.27% to 2.42% for LQC, GMQC, MQC and HQC respectively. In Haemolytic Plasma:
The % accuracy observed for QC samples spiked using Haemolytic plasma was 97.71% and 94.60% for Haemolytic LQC and Haemolytic HQC respectively. The CV% observed for QC samples spiked with Haemolytic plasma was 5.65% and 2.82% for Haemolytic LQC and Li Chromatogram of LQC
Chromatogram of GMQC
1.83% to 3.56%, 2.31% to 4.69% and 2.27% to 2.42% for LQC, GMQC, MQC
The % accuracy observed for QC samples spiked using Haemolytic plasma was 97.71% and 94.60% for Haemolytic LQC and Haemolytic HQC respectively. The CV% observed for QC samples spiked with Haemolytic plasma was 5.65% and 2.82% for Haemolytic LQC and Lipemic
HQC respectively. In Lipemic Plasma:
The % accuracy observed for QC samples spiked using Lipemic plasma was 106.74% and 93.59% for Lipemic LQC and Lipemic HQC respectively. The CV% observed for QC samples spiked with Lipemic plasma was 5.65% a
Haemolytic LQC and Lipemic HQC respectively.
Table No .11-INTER-BATCH PRECISION AND ACCURACY (GLOBAL STATISTICS THREE P&A BATCHES:
Batch ID (ng/mL)LQC (ng/mL)GMQC (ng/mL)MQC (ng/mL)HQC
I
P&A-1 58.156 288.558 1425.467 2125.412 P&A-2 63.620 303.866 1385.587 2150.730 P&A-3 59.830 276.514 1495.115 2257.582 P&A-4 64.950 286.733 1441.729 2163.970 P&A-5 58.631 275.785 1358.792 2223.805 P&A-6 60.689 285.895 1540.023 2207.454
II
P&A-7 57.172 293.159 1524.658 2298.924 P&A-8 64.534 306.047 1498.748 2403.689 P&A-9 61.528 284.401 1552.731 2278.622 P&A-10 65.960 296.966 1564.003 2380.020 P&A-11 64.585 306.357 1467.885 2347.715 P&A-12 60.169 310.941 1524.980 2266.287
III
P&A-13 59.912 300.895 1520.996 2313.134 P&A-14 62.438 304.063 1533.051 2245.485 P&A-15 62.540 302.517 1509.817 2306.171 P&A-16 64.012 308.358 1504.368 2348.445 P&A-17 61.170 291.684 1519.599 2296.799 P&A-18 65.539 301.925 1434.108 2197.458
Mean 61.969 295.815 1488.981 2267.317
SD(±) 2.6749 10.8622 57.8727 78.6988
CV % 4.32 3.67 3.89 3.47
% Accuracy 103.02 98.39 99.05 90.50
Actual Conc.
ng/Ml 60.150 300.650 1503.200 2505.300 Results and Discussion:
Calibration curve range 20.00 to 3002.800 ng/ml. Intra Batch Accuracy 101.38%% to 92.97%.
Intra Batch Precision 3.19% to 2.42%.
Inter Batch Accuracy 103.02% to 90.50%.
Inter Batch Precision 4.32% to 3.47%.
Chromatogram of MQC:
Chromatogram of HQC:
SUMMARY AND CONCLUSION:
In the present study, the method validation and system suitability were performed for the Griseofulvin in K3EDTA human plasma by LC-MS/MS and results obtained were within the acceptance criteria (CV%≤3 for area ratio & CV%≤2 for RT). Based on the results of validation, it can be concluded that the present method is suitable for the estimation of Griseofulvin in K3EDTA human plasma over concentration range of
20.000 ng/ml to 3002.800 ng/mL. The precision and accuracy are very much within the prescribed limits in this concentration range. The drug was found to be very stable to the effect of three freeze-thaw cycles, up to 14.00 hours delay on the Bench-top, up to 20.00 hrs of Wet extract stability. This method is found to be rugged with changes in column and analyst.