INTRODUCTION
Optical lenses suffer from the problem of limited depth of field. According to lens formula, only objects at one particular depth will be truly in focus. Consequently, if one object in the scene is in focus, another object at a different distance from the lens will be out of focus and, thus blurred. The degree of this blurring is affected by a number of factors, including the object distance; the focal length; number of lens, and distance between lens and sensor plane. One approach to achieve images in which information content is improved and all
COMPUTER SCIENCE & TECHNOLOGY
www.computerscijournal.org
June 2012, Vol. 5, No. (1): Pgs. 31-40
An International Open Free Access, Peer Reviewed Research Journal Published By: Oriental Scientific Publishing Co., India.
FPGA-Based Multi-Focus Image Fusion Techniques
M.A. MOHAMED
1and B.M. EL-DEN
21Faculty of Engineering, Mansoura University, Egypt. 2Instructor at ITC Company-Mahala, Egypt.
E-mail: [email protected]; [email protected] (Received: February 12, 2012; Accepted: June 04, 2012)
ABSTRACT
Image fusion is a process which combines the data from two or more source images from the same scene to generate one single image containing more precise details of the scene than any of the source images. Among many image fusion methods like averaging, principle component analysis and various types of Pyramid Transforms, Discrete cosine transform, Discrete Wavelet Transform special frequency and ANN and they are the most common approaches. In this paper multi-focus image is used as a case study. This paper addresses these issues in image fusion: Fused two images by different techniques which present in this research, Quality assessment of fused images with above methods, Comparison of different techniques to determine the best approach and Implement the best technique by using Field Programmable Gate Arrays (FPGA). First a brief review of these techniques is presented and then each fusion method is performed on various images. In addition experimental results are quantitatively evaluated by calculation of root mean square error, entropy; mutual information, standard deviation and peak signal to noise ratio measures for fused images and a comparison is accomplished between these methods. Then we chose the best techniques to implement them by FPGA.
Keywords: Field Programmable Gate Array (FPGA), Discrete Wavelet Transform (DWT), Discrete Cosine Transform (DCT), and Artificial Neural Networks (ANNs).
or the following process [1, 2]. Such objectives could be achieved through creating combined images that are more suitable for human perception and computerized image processing such as augmentation, segmentation, feature extraction, and object recognition. The fused data should provide more complete information than the separate dataset does and increase reliability and accuracy to imperfection. At present, image fusion technology is widely used in various fields. Practical image fusion systems require high-speed processing, the current widespread use of software processing, and use of parallel computers to increase processing speed, but the use of parallel computer systems, there is high cost. This paper presents the image fusion technology using FPGA-based hardware as a design approach. Implementation for different image processing requirements, software designers can modify the FPGA’s. Internal logic functions, FPGA high level of integration, so that the image fusion board more compact layout.
Preprocessing of Image Fusion
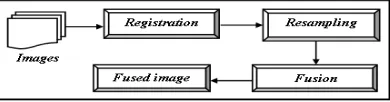
Two images taken in different angle of scene sometimes causes distortion. Most of objects are the same but the shapes change a little. At beginning of fusing images, we have to make sure that each pixel at correlated images has the connection between images in order to fix the problem of distortion; image registration can do this. Two images have same scene can register together using software to connect several control points. After registration, resampling is to adjust each image that about to fuse to the same dimension. After resampling, each image will be of the same size. Several interpolation approaches can be used, to resample the image; the pixel-by-pixel fused approach is used for resampling process. Images with the same size will be easy for fusing process. After the resampling, fusion algorithm is applied. Sometime images transfer
into different domain, sometime haven’t depending on the algorithm. Inverse transfer is necessary if image has been transferred into another domain. The processes described above are denoted by preprocesses of actual fusion. Both steps are important and affect the result of fusion Fig.1. Performance Evaluation of Image Fusion
Five different measures have been used to evaluate the performance of fusion process. These are: (1) information entropy; (2) means-square-error; (3) peak-signal-to-noise ratio; (4) standard-deviation, and (5) mutual-information. Entropy
Entropy is one of the most important quantitative measures in digital image processing; which is defined as the quantification of information content of messages. Although used entropy in communication, it can be also employed as a measure and quantify the information content of digital images. A digital image consists of pixels arranged in rows and columns. Each pixel is defined by its position and by its grey scale level. For an image consists of L grey levels, the entropy is defined as:
( )
( )
∑ − =
=
L i
i P Log i P H
1 2 ...(1)
where P(i) is the probability of each grey scale level.
Root-Mean-Square Error (RMSE)
The root-mean-square error RMSE between the reference image; I and the fused image; F, is defined as:
∑ ∑ −
× =
− =
M
i N
j
j i F j i I N M RMSE
1 1
2
)] , ( ) , ( [ 1
...(2) where i and j denotes the spatial position of pixels, while, M and N are the dimensions of the images.
Peak Signal-to-Noise Ratio (PSNR)
The PSNR is the ratio between the maximum value of an image and the magnitude of background noise and is commonly used as a measure of quality of reconstruction in image fusion. It is defined in terms of the mean-squared error MSE as:
⎟⎟
⎠
⎞
⎜⎜
⎝
⎛
−
=
MSE
PSNR
n 2
10
)
1
2
(
log
10
...(3) where n is the number of bits per pixel of the original image I. RMSE and PSNR are appealing because they are simple to calculate, have clear physical meanings, and are mathematically convenient in the context of optimization, but they are not well match to perceived visual quality [4]. Mutual Information (MI)
Indicates how much information the fused image If conveys about the source images. A higher value of MI indicates that the fused image contains fairly good quantity of information presented in both the source images, The MI for fused image calculating by adding the MI between the fused image and each of the source images.
(
I
I
f) (
I
I
I
f)
I
MI
=
1,
+
2,
...(4)Standard Deviation (SD)
The standard deviation (SD), which is the square root of the variance, reflects the spread in the data. Thus, a high contrast image will have a high variance, and a low contrast image will have a low variance. For a fused image of size N×M, its SD can be estimated by:
( )
(
)
∑ ∑ − ×
=
= =
N
i M
j f
N M m j i C SD
1 1
2
/
, ...(5)
where C(i, j) is the (i, j)th pixel intensity value and
m is the sample mean of all pixel values of the
image.
Image Fusion Techniques
The number of proposed concepts for image fusion is growing rapidly, which indicates ongoing research in this area. Technically, image data recorded by different sensors have to be merged or composed to generate a new representation. Alternatively, data from one sensor are also subject of image fusion. Different multispectral channels are to be considered as different sources, as well as images taken at different times by the same sensor. References for the algorithms worked out in the following are Anderson (1987); Burt (1992); Carper et al. (1990); Chavez et al. (1991); Kathleen and Philip (1994),
Rockinger (1996) and Wald (2002). With respect to the conceptual approach, the proposed techniques averaging, DCT, PCA, DWT, Laplacian pyramid, morphological pyramid, gradient pyramid, spatial frequency and artificial neural networks .The main characteristics of these techniques are discussed in the context of its mathematical formulation.
Simple Approaches Fusion Techniques Fusion Techniques based on Averaging
The simplest way to fuse two images is to take the mean-value of the corresponding pixels. Maybe that for some applications this may be enough, but there will always be one image with poor lighting and thus the quality of an averaged image will obviously decrease. Averaging doesn’t actually provide very good results4.
Principal components analysis
Principal component analysis PCA is a general statistical technique that transforms multivariate data with correlated variables into one with uncorrelated variables. These new variables are obtained as linear combination of the original variables. The implementation process may be summarized as: (i) Images size checking, source images must have the same size; (ii) The input images (images to be fused) are arranged in two column vectors; (iii) The resulting vector has a dimension of n× 2, where n is length of the each image vector; (iv) Compute the eigenvector and eigenvalues for this resulting vector are computed and the eigenvectors corresponding to the larger eigenvalue obtained, and (v) The normalized components are computed from the obtained eigenvector. The fused image is:
( )
x y PI( )
x y PI( )
x yIf , = 1 1 , + 2 2 , ...(6) where P1 and P2 are the normalized components and its equal to P1=V(1) Σ and P2=V(2) Σ where V is eigenvector.
Pyramid Transform Techniques
Laplacian Pyramid (GP)
LP is derived from the GP [3], which is a multiscale representation obtained through a recursive reduction. The first step in GP coding is to lowpass filter the original image I to obtain image G1. G1 is a reduced version of I in that both resolution and sample density are decreased. In a similar way G2 is a reduced version of G1, and so on. Hence, to make a fusion by flowing these steps: (i) Generate GP; (ii) GP interpolation; (iii) Laplacian Pyramid decomposition, and (iv) Laplacian Pyramid reconstruction. Fusion is performed in the Laplacian Pyramid domain by constructing a fused pyramid. The pyramid coefficient (or hyperpixel) at each location in the fused pyramid is obtained by selecting the hyperpixel of the sensor pyramid that has the largest absolute value. Let LA and LB be the Laplacian Pyramids of two images A and B .With LF the fused pyramid is denoted which is determined by ( ) ( ) ( ) ( ) ( ) ⎪⎩ ⎪ ⎨
⎧ → >
= otherwise j i L j i L j i L if j i L j i L K B K A K A K A K F , , , , , ...(7)
where K is the level of the pyramid and (i, j) denotes a hyperpixel at that level.
Morphological pyramids
The image at any level L is created by applying Morphological filtering with a 3×3 structuring element to the image level (L-1) followed by down-sampling the filtered image with d=2 .
Gradient pyramids
The fusion process in Gradient Pyramid5 is similar process to Laplacian Pyramidal operation. By successively filtering and down sampling, an image pyramid that has the original image as the pyramid base with successive levels that are low-pass filtered and down sampled versions of the level below is generated.
Discrete Cosine Transform Techniques This section studies image fusion in frequency domain based on the DCT transform. An image fusion technique is present based on average measure defined in the DCT domain. An improved version of direct DCT image fusion is obtained from the DCT representation of the fused
image by dividing images into blocks then calculates the DCT representations and taking the average of all the DCT representations for corresponding blocks. Finally taken the inverse discrete cosine transform to reconstruct the fused image. Actually, this image fusion technique is called the DCT + average; modified or “improved” DCT technique.
Discrete Wavelet Transform Techniques DWT is becoming one of the standard tools for image fusion; DWT is computed by successive lowpass and highpass filtering of digital images; which is called the Mallat algorithm or Mallat-tree decomposition. Its significance is in the manner it connects the continuous-time multiresolution to discrete-time filters. The principle of image fusion using wavelets is to merge the wavelet decompositions7] of the two original images using fusion methods applied to approximations coefficients and details coefficients. The following two examples examine the process of image fusion to merges two different images leading to a new image: (1) Load two original images Fig.(3.1.a,b); (2) Fuse the two images from wavelet decompositions at level 5; (3) Using db2 by taking two different fusion methods; Fusion by taking the mean for both approximations and details Fig.(3.c), and (4) Fusion by taking the maximum for approximations and the minimum for the details Fig.(2.d).
Spatial Frequency Techniques Spatial frequency (SF)
Spatial frequency is used to measure the overall activity level of an image [8]. For an M×N image F, with the gray value at pixel position ð(m, n) denoted by F(m, n), its spatial frequency is defined as
2 2
CF RF
SF= + ...(8)
The basic algorithm may be written as: (i) Decompose the source images into blocks of size M×N; (ii) Compute the SF for each block; (iii) Compare the SF of two corresponding blocks Ai and Bi, and construct the ith block Fi of the fused image as
( )
⎪ ⎪ ⎩ ⎪⎪ ⎨ ⎧
+
− <
+ > =
otherwise B A
TH SF SF if SF
TH SF SF if SF
Z
i i
B i A i B
i
B i A i A
i i
2 /
...(10)
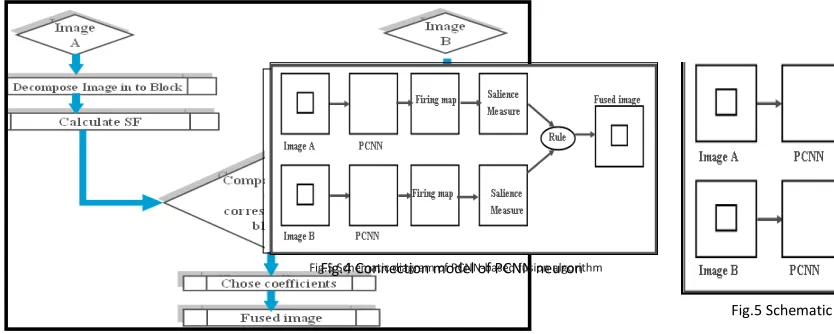
where TH is the threshold, and (iv) Verify and correct the fusion result in step 3 with saliency checking. In this case the aim of this process is to avoid isolated blocks the process is illustrated in flow chart Fig.3.
Fig.2 (a, b) original image (c) Fusion by taking the mean for both approximations and details; (d) fusion by taking the maximum for approximations and the minimum for the details
(c) (d)
(a)
Blurring
(b) Blurring
Fig.3 Flow chart of the technique with spatial frequency as a parameter of clarity of images
Fig. 5. Schematic diagram of PCNN-based fusion algorithm Fig. 4. Connection model of PCNN neuron
Fig.4 Connection model of PCNN neuron
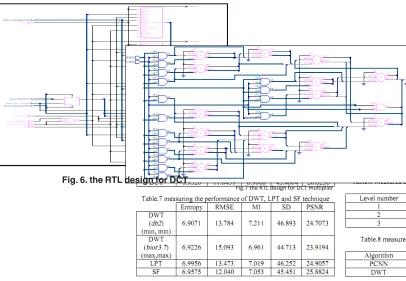
Fig.7 the RTL design for DCT multiplier
Fig. 6. the RTL design for DCT
Fig.9 the RTL Fig.8 the RTL design for 2D‐DWT
Fig.10 Layout for PCNN RTL design
Fig.8 the RTL design for 2D-DWT Fig.9 the RTL design for LUT-IDWT
Fig.10 Layout for PCNN RTL design
(a)
(c)
(a) (b)
(c) (d)
(a) Focus (b)
Focus (a)
(c)
(a) Focus Focus
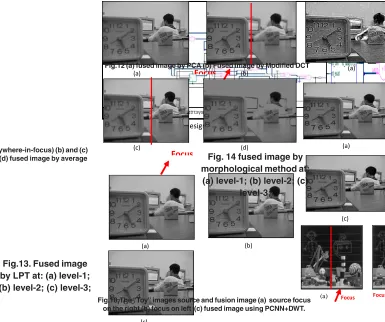
Fig.11 (a) reference image (everywhere-in-focus) (b) and (c) Blurred images in left and right (d) fused image by average
Fig.12 (a) fused image by PCA (b) Fused image by Modified DCT
Fig. 14 fused image by morphological method at:
(a) level-1; (b) level-2; (c) level-3;
Fig.13. Fused image by LPT at: (a) level-1; (b) level-2; (c) level-3;
Fig.15 Fused images by gradient pyramid
at: (a) level-1; (b) level-2; (c) level-3
Fig.16 The ''Lab'' images fusion results. (a), (b) Fused image using DWT (c) fused image using
LPT. (c) Fused image using SF
Fig. 17 (a, and b) Blurred images in left and right; (c, and d) Fused image by DWT at level-1, fused image by LPT at level 1(e, and f) Fused image by DWT at level-2, fused image by LPT at level-2 (g,
and h) Fused image by DWT at level-3, fused image by LPT at level-3
(c)
(a) (b)
(c) (d)
(a) (b)
(e) (f)
Focus
Focus (a) (b) (c)
(g)
Artificial neural networks Techniques
PCNN is a feedback network and each PCNN neuron consists of three parts: the receptive field, the modulation field, and the pulse generator [9]. PCNN in image fusion is a single layer pulse coupled neural cells with a two-dimensional connection as shown in Fig.4 [10, 11]. In this section, image fusion method based on PCNN network is discussed. The implementation is computationally simple and can be realized in real-time. Fig.5 shows a schematic diagram of the proposed image fusion method.
Image Fusion Algorithm Based on PCNN PCNN in wavelet domain is utilized as follows: Step 1: Source images are decomposed by DWT
at the J-th scale, for obtaining sub-images at the J-th scale.
Step 2: Each scale DWT coefficients are input to the neurons. There exists a one-to-one
correspondence between the coefficients and the network neurons. Each neural cell is connected with neighboring neural cells in linking range, typically within 3×3(or 5×5) range.
Step 3: The output of each neuron is calculated by Eqs.(12-16), [12,13], which results in two states, namely firing and non-firing. Then the sum of neuron firing times is counted as in the equation (17).
( )
kij k
ij n I
F =
...(12)
( )
= − k(
−)
+ L∑pq ijpq pq(
−)
ij k
ij n e L n V W Y n
L L 1 1
,
α
(13)
( )
n F( )
n(
L( )
n)
Uijk = ijk ∗1+
β
kij ...(14)( )
n =e− ijk(
n−1)
+VYijk(
n−1)
k
ij L θ
α
θ
θ
...(15)( )
( )
( )
⎪⎩ ⎪ ⎨
⎧ >
=
otherwise ,
n n
U if n
Y
k ij k
ij k
ij
0 :
1 θ
In Eqs.(12-16), the feeding input Fijk(n) is equal to the normalized DWT coefficient Iijk corresponding to a pixel in sub-images in wavelet domain, and the linking input Iijk(n) equals to the sum of neurons firing times in linking range. Wij,pq are the synaptic gain strength, βL is the decay constants. VL and V¸ are the amplitude gain. β is the linking strength. Uijk(n) is total internal activity. θijk(n) is the threshold. k denotes the k-th sub-image in wavelet domain. Subscripts i, j denote thelocation of pixel is (i, j) in sub-image and p, q are the size of linking rang in PCNN. If Uijk(n) is larger than θ ijk(n), then the neuron will generate a pulse Yijk(n)=1, also called one firing times. In fact, sum of Yijk(n) in n iteration is often defined as Eq.(16) and used to represent image information. Rather than analyze Yijk(n), one often analyze T
ij
k(n) instead. T ij
k(n), corresponding to one sub-image, consists firing map whose size is equal to the sub-image and value of each pixel in firing map is equal to value of Tijk(n).
( )
n T(
n)
Y( )
nT ijk
k ij k
ij = −1 + ...(17) FPGA Implementation of Image Fusion
The FPGA is an integrated circuit that contains many identical logic cells that can be viewed as standard components. Each logic cell can independently take on any one of a limited set of personalities. The individual cells are interconnected by a matrix of wires and programmable switches. A user’s design is implemented by specifying the simple logic function for each cell and selectively closing the switches in the interconnect matrix. FPGAs are becoming a critical part of every system design. Many vendors offer many different architectures and processes. The system designed consists of the hardware implementation of the DCT, DWT and PCNN-based fusion algorithm the FPGA performs wavelet transforms, fusion, and reverse wavelet transforms of the input images. Fig.(6-10) show simple designs of image fusion based on DCT, DWT and PCNN-based that wrote by VHDL code. Works are ongoing to design the image fusion modules and the architecture design for these techniques has been implemented on a Xilinx Spartan-3AN starter kit.
RESULTS
The performance of all discussed image fusion techniques has been examined using sets of images; all taken by digital camera (1) “lab” of size 640×480; (2) “Pepsi” of size 512×512, and (3) “Toy” of size 512×512. The objects in Pepsi and Toy images are placed in different distances, thus one object in each image is focused and the other one is blurred. Besides the well-focused image “lab” is used to generate a pair of blurred source images. To perform the blurring process on “Lab” a rotationally symmetric Gaussian low pass filter is used. One object in each image is blurred. Fusion methods are then employed to fuse each pair of the three sets of images. The source images and fusion results for different decomposition levels are illustrated. Fig.11 and 12 shows the results of fused images by Averaging, Principle Component Analysis (PCA) and Discrete Cosine Transform (DCT) techniques. Fig.13-15 shows the results of the fused images by using Pyramid Transform techniques in three decomposition level. Fig.16 and 17 show comparing the results of the fused images by using DWT, LPT, SF techniques. Fig.18 shows the result of image fusion by using PCNN in wavelet domain. The performance indices indicate that the image fusion technique based n DWT provides the best results among all discussed techniques. Experimental results show that the fusion algorithm is faster than the wavelet based image fusion technique when the images to be saved or transmitted in JPEG format. There is no difference in visual quality between the fused image obtained by this algorithm and that obtained by the wavelet transform based image fusion technique.
CONCLUSION
psycho visual tests were carried out, where a group of individuals express their subjective preferences between couples of images obtained with different fusion methods. However, the results given by the
tests were quite uneven, and no clearly conclusion could be obtained. The implemented algorithms; in the future, have to be implemented using FPGA to speed up the performance of fusion process.
1. R. Lundqvist; “Atlas-based fusion of medical brain images: methods and applications,” PhD dissertation; Uppsala University (Sweden); (2001).
2. Lehigh University, http:// w w w . e c e . l e h i g h . e d u / S P C R L / I F / image_fusion.htm.
3. J.G. Liu, “Evaluation of Landsat-7 ETM+ Panchromatic Band for Image Fusion with Multi-spectral Bands,” Natural Resources Research, 9(4), 269-276 (2000).
4. A. Morales, T. Charta, S. Ko, ‘‘Morphological pyramids with alternating sequential filters’’, IEEE Trans. Image Processing, 4, 965-977, (1995).
5. O. Rockinger, T. Fechner, “Pixel-Level Image Fusion: The Case of Image Sequences”, Proceedings SPIE, 3374, 378-388, (1998). 6. H. Li, B.S. Manjunath, S.K. Mitra, “Multisensor image fusion using the wavelet transformation’’, Graph Models Image Process. (57), 235–245, (1995).
7. S. Mallat, “A theory for multiresolution signal decomposition: The wavelet representation,” IEEE Trans. Pattern Anal. Machine Intell. 11, 674-693, (1989).
REFERENCES
8. A.M. Eskicioglu, P.S Fisher, ‘‘Image quality measures and their performance’’. IEEE Trans. Comm. 43(12), 2959–2965, (1995). 9. J.L. Johnson, M.L Padgett, “PCNN models and applications,” IEEE Trans. Neural Networks, Vol.10, pp. 480-498, 1999. 10. R.P. Broussard, S.K. Rogers, M.E. Oxley, et
al, “Physiologically motivated image fusion for object detection using a pulse coupled neural network,” IEEE Trans. Neural Networks, 10, 554-563, (1999).
11. Y. Jingwen, Q. Xiaobo, ‘‘Beyond Wavelets and Its Applications’’, 1st Ed, Ding Fuzhi, Ed. Beijing, China: National Defense Industry Press, (2008).
12. B. Xu, Z. Chen, “A multisensor image fusion algorithm based on PCNN”, in Proc. of the Fifth World Congress on Intelligent Control and Automation- WCICA’ 04, 4, 3679-3682, (2004).