COMPUTER SCIENCE & TECHNOLOGY
www.computerscijournal.org
June 2017, Vol. 10, No. (2): Pgs. 282-290 An International Open Free Access, Peer Reviewed Research Journal
Published By: Oriental Scientific Publishing Co., India.
Enhancing the Classification Accuracy of Noisy Dataset
by Fusing Correlation Based Feature Selection With
K-Nearest Neighbour
SAMIR KUMAR SINGHA,
SYED IMTIAz HASSAN*
Department of Computer Science & Engineering, Jamia Hamdard, New Delhi, India Corresponding author e-mail: [email protected]
http://dx.doi.org/10.13005/ojcst/10.02.05
(Received: May 02, 2017; Accepted: May 11, 2017)
ABSTRACT
The performance of data mining and machine learning tasks can be significantly degraded due to the presence of noisy, irrelevant and high dimensional data containing large number of features. A large amount of real world data consist of noise or missing values. While collecting data, there may be many irrelevant features that are collected by the storage repositories. These redundant and irrelevant feature values distorts the classification principle and simultaneously increases calculations overhead and decreases the prediction ability of the classifier. The high-dimensionality of such datasets possesses major bottleneck in the field of data mining, statistics, machine learning. Among several methods of dimensionality reduction, attribute or feature selection technique is often used in dimensionality reduction. Since the k-NN algorithm is sensitive to irrelevant attributes therefore its performance degrades significantly when a dataset contains missing values or noisy data. However, this weakness of the k-NN algorithm can be minimized when combined with the other feature selection techniques. In this research we combine the Correlation based Feature Selection (CFS) with k-Nearest Neighbour (k-NN) Classification algorithm to find better result in classification when the dataset contains missing values or noisy data. The reduced attribute set decreases the time required for classification. The research shows that when dimensionality reduction is done using CFS and classified with k-NN algorithm, dataset with nil or very less noise may have negative impact in the classification accuracy, when compared with classification accuracy of k-NN algorithm alone. When additional noise is introduced to these datasets, the performance of k-NN degrades significantly. When these noisy datasets are classified using CFS and k-NN together, the percentage in classification accuracy is improved.
Keywords: k-Nearest Neighbour, Correlation based feature selection, Attribute Selection, Missing Values, Dimensionality Reduction.
INTRODUCTION
Data mining is a process of extracting knowledge from enormous data. Classification is
classes. These models are called classifiers, which predicts categorical class1 labels.
Most of the real world data sources has to deal with the unavoidable problem of incomplete data2.To improve the data quality data may first be
preprocessed and the refined data may be then used for further data mining process. There are several data preprocessing techniques3. Data cleaning
is the process of removing noise and correct inconsistencies in data. Dimensionality reduction is a technique in which a reduced or compressed dataset is obtained by reducing the attribute set. The resulting dataset is a representation of the original dataset. Data compression techniques includes Wavelet Transforms and Principle Component Analysis , Attribute Subset selection, in which irrelevant attributes are removed, and attribute construction, where a new attribute is constructed from two or more attributes and usually is more useful than the original attributes.
Analysis of high-dimensional data for knowledge discovery does not always requires all the attributes to understand the underlying interest on the knowledge The analysis of .high-dimensional datasets thus augment the requirement of new theoretical developments4. Though predictive
models with high accuracy can be constructed with high-dimensional data using computationally expensive methods5, reduction in the dimension of
the original data may be of the concern of many application. There are several methods of handling missing data6, from which appropriate method may
be chosen, depending upon circumstances of each of the case.
The process of identifying and removing irrelevant and redundant information is known as attribute subset selection. Here a minimum subset of all attributes in the original dataset are selected such a way that the probability distribution of the ensuing classes is as close as possible to the original distribution. Mining on a dataset with reduced attributes has extra advantages. First, mining on reduced attribute set requires less computation time as compared to the dataset with original attribute set. Secondly, It makes the pattern easier to understand by reducing the attribute set in the discovered pattern. To find the optimal subset of attributes an exhaustive search is definitely expansive especially when number of attributes and the number of data classes increases. Therefore, heuristic methods are commonly used for attribute subset selection. These methods are typically greedy. They always make what looks to be the best choice at the time while searching through attribute space.
Memory-based learning is a type of learning algorithms that match a new test instances with training instances, which have been stored in memory, instead of performing explicit generalization. Since these type of learning constructs hypotheses directly from the training instances, therefore it is called instance based learning. The advantage memory-based learning over other methods of machine learning is its capability to adapt its model to previously unseen data. A learning method is termed “unstable” if small changes in the training-test set split can result in large changes in the resulting classifier7. The disadvantage of
instance-based classifiers is their large computational time for classification. Therefore a reduced attribute set may significantly improve the classification time for an instance based learning. Hence, determining which input features should be used for modelling becomes an key issue in the process because it could improve the classification accuracy and reduce the classification time 8.
K-Nearest Neighbour algorithm is a simple example of an instance-based learning algorithm. When trying to solve new problems, people often look at solutions to similar problems that they have previously solved9. The same principle is used in
k-nearest neighbour classification technique. It determines an instance is to be placed in which class by examining, the ‘k’ in k-nearest neighbour, which is the most similar cases or neighbours. It counts the number of instances for each class, and assigns the new instance to the same class to
which most of its neighbours belong. The sensitivity of k-NN to irrelevant attributes degrades the classification accuracy significantly when a dataset contains missing values or noisy data10.
Though there are several different techniques for attribute selection and classification there are few which are used together to improve classification accuracy. Correlation-based Feature Selection11 for machine learning originally proposed
by Mark A. Hall is one of the feature selection
Table 1: Classification of initial dataset with k-NN and CFS + k-NN
Dataset No. of Reduction Missing Correctly Correctly % improvement
(%) Instances in Values Classified classified in
Missing Attribute (%) instances instance with Accuracy
with k-NN (%) CFS + k-NN (%)
splice 3190 62.91 0 74.68 81.16 6.49
haberman 306 25 0 68.31 71.9 3.6
solar-flare_1 323 69.24 0 96.29 97.53 1.24
solar-flare_2 1066 76.93 0 99.25 99.54 0.29
mfeat-pixel 2000 54.36 0 96.15 96.05 -0.1
credit-a 690 50 0.34 81.16 80.87 -0.28
breast-cancer 286 40 0.32 72.38 71.68 -0.69
soybean 683 30.56 0.49 91.22 89.76 -1.46
credit-g 1000 80.96 0 72 70.4 -1.59
molecular- 106 96.62 0 36.8 32.08 -4.71
biology promoters
Fig. 2: Comparison of percentage of correctly classified instances with k-NN algorithm and CFS+k-NN Algorithm and corresponding improvement/ degradation in
technique that can be combined with k-NN to achieve better accuracy of classification of the dataset containing missing values and large number features.
Methodology/ Experiments
Classification accuracy is defined as the percentage of test tuples correctly classified by the algorithm. The error rate of an algorithm is one minus the accuracy. Measuring accuracy on a test set of tuples is better than using the training set
because tuples in the test set have not been used to induce concept descriptions. Using the training set to measure accuracy will typically provide an optimistically biased estimate, especially if the learning algorithm overfits the training data.
Data sets for analysis may contain hundreds of attributes, many of which may irrelevant for mining task. Mining the useful information12
from the huge dataset is a complex task. UCI repository13for machine learning consists of large
Table 2: Classification of noisy dataset with k-NN and CFS + k-NN when additional noise is introduced to initial dataset
Dataset No. of Reduction Missing Correctly Correctly Improvement
Instances in Attribute Values Classified classified in
(%) (%) instances instance with Accuracy
with k-NN (%) CFS + k-NN (%) (%)
splice-Noisy 3190 87.1 0.06 55.68 64.08 8.41
haberman-Noisy 306 25 0.33 60.79 67.65 6.87
solar-flare_1-Noisy 323 69.24 0.22 47.68 53.87 6.2
solar-flare_2-Noisy 1066 84.62 0.32 34.81 42.22 7.42
mfeat-pixel-Noisy 2000 53.53 0.03 70.9 71.05 0.15
credit-a-Noisy 690 62.5 0.46 73.48 75.95 2.47
breast-cancer-Noisy 286 40 0.63 47.21 54.9 7.7
soybean-Noisy 683 52.78 0.58 39.24 43.2 3.96
credit-g-Noisy 1000 71.43 0.13 53.3 57.5 4.21
molecular-biology 96.62 0.08 32.08 40.57 8.5
_106
promoters-Noisy
set of datasets. Various datasets are used to test the proposed algorithm. Since, the k-NN algorithm is sensitive to noisy data or missing values, dataset are chosen carefully which either contains no missing values or missing values with very small percentage of total values in the dataset. Classification is then performed each of the dataset using k-NN classification algorithm and results are recorded. The Correlation based feature selection used to select the relevant attribute for each dataset and to remove the unwanted attributes from the dataset. The resulted instance of each dataset with reduced attribute set is then classified again using k-NN classification algorithm.
To show that the k-NN algorithm is sensitive to noise, each dataset is then introduced with an additional amount of missing values in order to create noise in the datasets used for the experiment. The resulted noisy dataset then again classified with k-NN algorithm. The noisy datasets are then preprocessed using CFS algorithm in order to achieve the reduced attribute set and then again classified using k-NN algorithm to show percentage improvement in each dataset when compared with the improvement in accuracy percentage of correctly classified instances in initial datasets.
Weka14 is a popular open source Data
mining tools implemented in java. The relevant
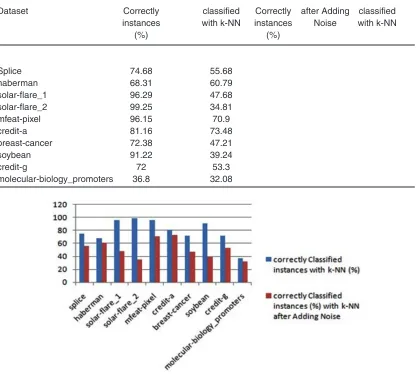
Table 3: Classification accuracy of initial dataset and noisy dataset with k-NN
Dataset Correctly classified Correctly after Adding classified
instances with k-NN instances Noise with k-NN
(%) (%)
Splice 74.68 55.68
haberman 68.31 60.79
solar-flare_1 96.29 47.68
solar-flare_2 99.25 34.81
mfeat-pixel 96.15 70.9
credit-a 81.16 73.48
breast-cancer 72.38 47.21
soybean 91.22 39.24
credit-g 72 53.3
molecular-biology_promoters 36.8 32.08
Table 4: Percentage of missing values and percentage improvement in correctly classified instances in initial dataset and noisy dataset
Dataset Missing Missing % improvement % improvement in
Values (%) Values (%) in Accuracy Accuracy after
in Initial After Adding in initial Adding
Dataset Noise dataset Noise
splice 0 0.06 6.49 8.41
haberman 0 0.33 3.6 6.87
solar-flare_1 0 0.22 1.24 6.2
solar-flare_2 0 0.32 0.29 7.42
mfeat-pixel 0 0.03 -0.1 0.15
credit-a 0.34 0.46 -0.28 2.47
breast-cancer 0.32 0.63 -0.69 7.7
soybean 0.49 0.58 -1.46 3.96
credit-g 0 0.13 -1.59 4.21
molecular-biology 0 0.08 -4.71 8.5
_promoters
Fig. 5: Comparison of improvement in accuracy in initial datasets with dataset containing additional noise
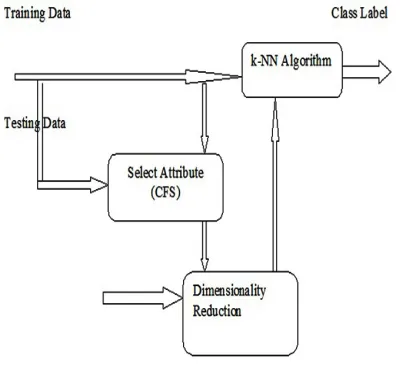
classes of Weka source code is used in Java for experiment. The process uses 10-fold cross validation for training and predicting class label of each dataset used in the experiment.
The process uses both CFS and KNN together to predict the class labels. The process is depicted below:
The process can be summarized as follows: Step 1: Select a dataset with no or minimum missing values.
Step 2: Find the accuracy of k-NN classifier for the given dataset.
Step 3: Select the attributes using CFS algorithm.
Step 4: Remove the remaining attributes from all the instances.
Step 5: Classify the dataset with reduced set of attributes using k-NN classifier. Step 6: Record the result of k-NN classifier with reduces set of attributes.
Step 8: Repeat Step 2 through 6 for all datasets
Step 9: Evaluate Accuracy Improvement from initial datasets and noisy Datasets. Let,
NA = Total number of attributes in a dataset. SA = Total number of selected Attributes. NI = Number of Instances in the dataset. Cknn = Correctly classified Instances with k-NN
CCFS+kNN = Correctly classified Instances with
CFS + k-NN
Therefore,
Total Number of values in the dataset, (Tv.) = NA * NI
...(1)
and, Percentage of Reduction in Attribute PRA = (NA – SA)*100 / NA
...(2)
Let, Mv= Number of Missing Values in the dataset and
PMV = Percentage of Missing values in the Dataset
Percentage of Missing values in the Dataset can be calculated as,
PMV = MV *100/Tv
...(3)
Improvement in accuracy in(in %)
IA = Cknn - CCFS+kNN
…(4)
RESULTS AND DISCUSSIONS
The performance of our proposed approach has been tested with 10 different types of dataset with no or minimal level of missing values in each dataset. Each of the dataset and their percentage of corresponding missing values in the instances are summarized in Table 1. Feature selection can reduce the number of training cases because fewer features equates with fewer distinct instances (especially when features are nominal). Speed of the algorithm can be increased significantly if
number of training cased needed is reduced while maintain and acceptable rate of errors. For CFS based attribute selection greedy Stepwise Search
15 algorithm with backward search is used and for
k-NN, value of k is set to 1. The result so obtained is summarized in Table 1.
The graph presented below in Figure 2 shows that the improvement in accuracy is very less or even negative when only k-NN and k-NN is used with CFS, in the datasets with no noise or very minimal noise. The best case of improvement in accuracy is 6.49 in “splice” dataset whereas in the worst case the improvement in accuracy is negative, that is, -4.71% in case of “molecular-biology promoters” dataset. The fact is also evident from Table 1.
When additional noise is introduced to each of the dataset it is observed that in all the cases the performance of k-NN algorithm is degraded significantly. When these noisy dataset are classified using CFS and k-NN together, in all of the cases, the CFS and k-NN together shows the improvement in percentage of classification accuracy. The comparison of percentage of correctly classified instances of each dataset when classified only with k-NN and CFS and k-NN together is presented in Table 2 and Figure 3.
Table 3 compares the percentage correctly classified instances only with k-NN and CFS and k-NN together. The graph in Figure. 4 composed from Table 3 shows that there is a significant reduction in performance of k-NN when additional noise is introduced to the initial dataset.
When compared the improvement in percentage of classification of initial datasets and noisy datasets it is found that each of the dataset shows better improvement in percentage of correctly classified instances in noisy datasets. The results for each dataset are compared in Table 4 and in Figure 5.
CONCLUSION
been suggested for the construction of ensemble of classifiers. If we are only concerned about the best possible classification accuracy only, it might be difficult or almost impossible to find a single classifier that performs as well as a good ensemble of classifiers. Further, presence of noise or missing values degrades the performance of classifiers. However, when the classification algorithm is combined with the appropriate feature selection tool it can improve the classification accuracy significantly in noisy datasets. In this research we combined Correlation based Feature Selection Technique and k-Nearest Neighbor algorithm toimprove the classification accuracy when dataset contains missing values. The best case in this research is “splice” dataset where classification is improved 8.49 % when CFS is applied with k-NN, and in the worst case of
“molecular-biology-promoters” dataset the improvement in accuracy is negative by - 4.79% before adding additional noise. When additional noise are introduced to all these datasets and classified using CFS and k-NN together the improvement in accuracy is positive in all the cases. In the previous worst case of “molecular-biology-promoters” dataset which was initially without missing values, when additional noise introduced has also shown the improvement in accuracy from -4.71 to 8.5%. The k-NN algorithm having the weakness of sensitivity to the missing values is shown in this research (Refer Table 3 and Figure 4). In each of the noisy dataset the classification accuracy is improved when CFS and k-NN algorithm is used together for classification. The objective of utilizing the strengths of one method (CFS) to complement the weaknesses of another (k-NN) is thus achieved in this research.
REFERENCES
1. Syed Imtiyaz Hassan, 2017, “Designing a flexible system for automatic detection of categorical student sentiment polarity using machine learning”, International Journal of u- and e- Service, Science and Technology, vol. 10, issue.3, Mar 2017, ISSN: 2005-4246. 2. P. Langley and S. Sage, 1994, Oblivious
decision trees and abstract cases, In Working Notes of the AAAI-94 Workshop on Case-Based Reasoning, Seattle, W.A, AAAI Press.
3. Jiawei Han, Micheline Kamber and Jian Pei, 2012, Data Mining Concept and Techniques.3rd ed. Morgan Kaufmann
Publishers,201,.p. 99-105.
4. D.L. Donoho, 2011, High-dimensional data analysis: The curses and blessings of dimensionality. Lecture delivered at the “Mathematical Challenges of the 21st Century” conference of The American Math. Society, Los Angeles, August 6-11. Available at http:// statweb.stanford.edu/~donoho/Lectures/ AMS2000/ MathChallengeSlides2*2.pdf. 5. L. Breiman, Random forests, 2001, Technical
report, Department of Statistics, University of California.
6. Batista g, Monard MC, 2003, An analysis of four missing data treatment methods
for supervised learning. Appl Artif Intell 17:519–533
7. Breiman L, 1996, Bagging predictors. Mach Learn 24:123–140
8. Yu L, Liu H, 2004, Efficient feature selection via analysis of relevance and redundancy. JMLR 5:1205–1224.
9. g.Kesavaraj , Dr.S.Sukumaran, 2013, A Study On Classification Techniques in Data Mining, Fourth International Conference on Computing, Communications and Networking Technologies (ICCCNT), DOI :10.1109/ICCCNT.2013.6726842
10. S.B. Kotsiantis, I. D. Zaharakis, P. E . Pintelas, 2006, Machine learning: A review of classification and combining techniques. DOI: 10.1007/s10462-007-9052.
11. Mark A. Hall, 1999, Correlation-based Feature Selection for Machine Learning, Ph. D. Dissertation, The University of Waikato, New Zealand.
13. UCI Machine Learning Repository, Available at http://mlr.cs.umass.edu/ml/datasets.html, accessed Sep 16.
14. Weka Documentation, Available at www. cs.waikato.ac.nz, accessed Sep 16.