Novel reverse phase HPLC method development and validation of quetiapine fumerate in bulk and tablet dosage form
5
0
0
Full text
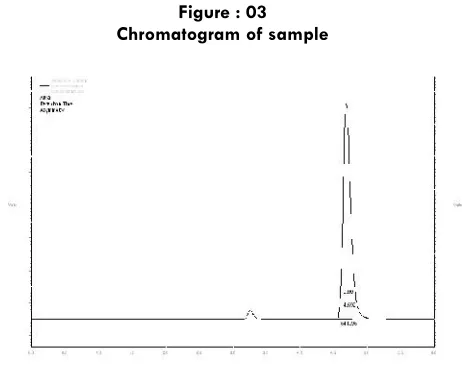
(2) 96. Materials and Methods. Chemicals and Reagents Milli-Q-water, Ortho Phosphoric Acid & Potassium Dihydrogen Phosphate (AR Grade) and Acetonitrile & Methanol (HPLC Grade) were used. Instrumentation The LC system, used for the method development and validation was from Shimadzu LC-2010CHT series consists quaternary gradient pump, auto sampler, column oven and PDA detector. The out output signal was monitored and processed using CLASS-VP software on Pentium computer. Preparation of mobile phase, standard and sample solutions of Quetiapine fumerate Mobile phase A mixture of 50 volume of Buffer, 40 volume of Acetonitrile (HPLC grade) and 10 volumes of methanol was prepared. The mobile phase was sonicated for 10min to remove gases. Buffer preparation 8g of potassium dihydrogen was weighed and dissolved in 100ml of water and volume was made up to 1000ml with water. Adjust the pH to 3.0 0.05 using dilute Ortho phosphoric acid. The buffer was filtered through 0.45mc filters to remove all fine particles and gases. Standard solution of Quetiapine fumerate 10mg of Quetiapine fumerate was dissolved into 10ml of diluent to get 1mg/ml solution; sonic ate for 5 min and mix. Sample solution of Quetiapine fumerate Tablet sample labelcliam 200mg. the average weight was determined with 20 tablets, which were grounded until fine powder. Accurately weighed amount of powder equivalent to 10mg (20.23mg) of Quetiapine fumerate was quantitatively transferred to 10 ml of calibrated flask with the aid of diluent. From the above solution 0.02ml was transferred to 10ml calibrated flask and volumes made up to the mark with the aid of diluent and sonicate for 10min and filtered. Diluent Prepared a mixture of buffer: Acetonitrile: Methanol in the ratio of 50: 40: 10 which was used as diluent for dilution of standard stock solution. Chromatographic conditions Instrument : Shimadzu pump LC – 2010HT Detector : PDA detector Column : Phenomix Stainless Steel C18 Column (250 X 4.6 mm, 5µ) packed with ODS chemically bounded porous silica particles. Temperature : 40oC Flow rate : 0.8ml/min Wave length : 247nm Runtime : 7 min Sample size : 20l. Int. J. Pharm & Ind. Res. Vol - 01. Diluent (50: 40:10) Sample retention time. : Buffer: Acetonitrile: Methanol : 4.69 ± 0.06 min. Method validation [12] T he proposed method was validated as per ICH guidelines. The drug solutions were prepared as Per the earlier adopted procedure given in the experiment. Linearity study Linearity was performed by taking from stock solution aliquots of 0.01, 0.02, 0.03, 0.04 and 0.05 ml were taken in 10ml volumetric flasks and diluted upto the mark with mobile phase such that the final concentration of Quetiapine fumarate in the range of 1-5 μg/ml. Volume of 20 μl of each sample was injected in five times for each concentration level and calibration curve was constructed by plotting the peak area versus the drug concentration. The observations and calibration curve is shown in Table 1, Fig.1. Assay Assay was performed by accurately weighed amount of powder equivalent to 20.23mg of Quetiapine fumerate was quantitatively transferred to 10 ml of calibrated flask with the aid of diluent. The volume was made up to mark, sonicate for 10min. From the stock solution aliquot of 0.02 was taken in 10ml volumetric flasks and diluted upto the mark with mobile phase and filtered, such that the final concentration of Quetiapine Fumarate was 2μg/ml.The chromatogram was shown in figure-3. Table-2. Accuracy as recovery It was done by recovery study. Sample solutions were prepared by spiking at about 50 %, 100% and 150 % of specification limit to Placebo and analyzed by the proposed HPLC method. Results are shown in Table-3. System precision Precision is the measure of how close the data values are to each other for a number of measurements under the same analytical conditions. Standard solution of (1μg/ml) were prepared as per test method and injected for 5times. Results are shown in Table -4. Method precision Three samples were Prepared and analyzed as per the test method on 3 different days and calculated the % RSD for Assay of five preparations. Results are shown in Table-5. Limit of detection and limit of quantitation The parameters LOD and LOQ were determined on the basis of response and slope of the regression equation. Results are shown in Table-6. Specificity parameters The specificity of the method was predicted by preparing diluent, sample and excipients as placebo sample and injected into the HPLC system. The results were calculated shown in table-7.. Issue - 02. Apr - Jun 2011.
(3) 97. Results and discussion. Figure : 01 Linearity of Quetiapine Fumarate. Quetiapine Fumarate indicated for the treatment of schizophrenia. Fig-2 shows typical chromatograms of Quetiapine Fumarate. The retention time of Quetiapine Fumarate was 4.69min. The calibration curve was linear over the range 1 - 5 μg/ml for the determination of Quetiapine Fumarate. The linearity of method was statistically confirmed. The correlation coefficients (r 2) for calibration curves were not less than 0.999. The LOD and LOQ values of Quetiapine Fumarate were found to be 0.0167μg/ml and 0.0506 μg/ml respectively. The Precision of the method was determined by repeatability (intra-day) and intermediate precision (inter-day). Precision was expressed as the RSD of the results. The values obtained for the precision studies presented (Table 4, 5), indicates good repeatability and low inter day variability. The analytical recovery at three different concentrations of Quetiapine Fumarate was determined and the recovery results are in the range of 98-102% .Therefore proposed validated method was successfully applied to determine Quetiapine Fumarate in tablet dosage form.. 200 mg. 4 6. % Recovery *. Amount Recovere d* in µg. Amount added in µg. Sample conc., (µg) 10. %RSD. The authors are grateful to the Management of school of pharmaceutical sciences, VELS University, Chennai, for their continuous support and encouragement and for providing the necessary facilities.. 2.05. 2. Average recovery (%). Acknowledgements. Table: 3 Accuracy Label claim. For the determination of Quetiapine Fumarate, the proposed HPLC method was found to be superior due to high percentage recovery which shows that the method was free from interference of excipients used in the formulations. The results of the study indicate that the proposed HPLC method of analysis can be used in quality control department with respect to routine analysis for the assay of the tablets containing Quetiapine Fumarate.. 100.64. 1.91. 102.5. 4.03. 100.75. 5.92. 98.66. Table: 4 System precision. Table: 1 Linearity Concentration (μg/ml). Peak Area. Inject. Peak. 1. 272206. ions. Area. 2. 540163. 1. 540163. 3. 806202. 2. 545475. 4. 1062866. 3. 545758. 5. 1329391. 4. 543037. 5. 545307. Mean. 543948. Table: 2 Assay Formulation Quetipin. Labeled amount (mg) 200. Amount found *(mg) 198.92. Int. J. Pharm & Ind. Res. %Amount found. %RSD. S.D. 2377.54. 99.83. 0.285. %R.S.D. 0.437. Vol - 01. Issue - 02. Apr - Jun 2011.
(4) 98 Table: 5 Method precision S.NO. INTER DAY. Concentration µg/ml. Figure : 03 Chromatogram of sample. INTRADAY. S.D. %RSD. S.D. %RSD. 1. 1. 1245.94. 0.459. 1734.81. 0.63. 2. 3. 1694.06. 0.21. 5666.9. 0.70. 3. 5. 2430.10. 0.18. 3064.8. 0.23. Table: 6 Characteristics of HPLC method Parameters Determined. Obtained Value. Linearity range(μg/ml). 1-5. Slope. 2637.07. Intercept. 11043.7. Regression Coefficient(r2). 0.999. LOD(μg /ml). 0.0167. LOQ(μg /ml). 0.0506. References 1. 2. 3.. 4.. Table: 7 Specificty Parameter of Quetiapine Fumerate Component. Observation. 5.. No interference Diluent. at RT of analyte peak. No interference. Placebo. 6.. at RT of analyte peak.. 7.. Figure : 02 Chromatogram of standard. 8.. 9.. Int. J. Pharm & Ind. Res. Vol - 01. http://www.drugs.com/mmx/quetiapine.html http://www.drugbank.ca/drugs/DB01224 Radha Krishna S, Rao B.M, Someswara Rao N, A simple and accurate reverse phase liquid chromatographic method was developed for the of related substance and degradants of Quetiapine Fumarate bulk drug. Rasayan J. Chem 2008,1,3, 466-474. Nikam D.S, Bagade S.B., A simple, fast and reliable derivative Spectrophotometric methods were developed for determination of Quetiapine fumarate in pharmaceutical formulation. Second order derivative ultraviolet Spectrophotometric methods were developed. International Journal of ChemTech Research, 2009, 1(4), 898-904. Dhaneshwar S.R, Patre N.G, A sensitive, selective, precise, and stability-indicating HPTLC method for quantitative analysis of quetiapine fumarate both as the bulk drug and in formulations has been established and validated. Bio medical chromatography, 2008, 22, 1043-1055. Sanjay A Jadhav, Shashikant B Landge, A rapid and sensitive gas chromatographic method using flame ionization detection (GC–FID) has been developed and validated for five processes related non-chromophoric impurities. Chromatographia, 2006, 71, 11-12. Ramakrishna Nirogi, Gopinadh Bhyrapuneni, A sensitive high-performance liquid chromatography-tandem mass spectrometry method was developed and validated for the quantification of quetiapine in rat plasma. Bio medical chromatography, 2008, 22, 1043-1055. Soma Raju V, A simple, sensitive isocratic rapid resolution liquid chromatographic assay method has been developed for the quantitative determination of quetiapine hemifumarate in bulk active pharmaceutical ingredient. Chromatographia, 2007, 70, 3-4. Patricia C. Davis Orlando Bravo, Mark Gehrke, Pharmacokinetic measurement of the psychotropic compound quetiapine and four related metabolites in human plasma was conducted using a sensitive and specific liquid–chromatography tandem mass Issue - 02. Apr - Jun 2011.
(5) 99 spectrometry (LC–MS/MS). Journal of pharmaceutical and biomedical analysis, 2010, 51, 1113-1119. 10. Vincenzo Pucci, Roberto Mandrioli, Two different analytical methods for the quality control of quetiapine in commercial formulations have been developed and compared. Journal of pharmaceutical and biomedical analysis, 2003, 32, 1037-1044.. Int. J. Pharm & Ind. Res. Vol - 01. 11. Lawrence J. Albers, Roberto Merli, An original HPLC and UV method has been developed for the simultaneous determination of the atypical antipsychotic quetiapine and the geometric isomers of the second-generation antidepressant fluvoxamine. Journal of chromatography 2006, 8, 227-233. 12. Code Q2A, 1995 Text on Validation of analytical methods ICH harmonized tripartite guidelines.. Issue - 02. Apr - Jun 2011.
(6)
Figure

Related documents
RLPM can treat levator plate sagging, perineal descent and all the symptoms associated with this defect (stress uri- nary incontinence, frequency, urgency, dysuria, anal
The present review examines whether psychological preparation (procedural information, sensory information, cognitive intervention, relaxation, hypnosis and
This project consists of three phases: (1) developing measurable, prioritized point-of-care criteria for effective PACT coordination, to be accomplished using ProMES (detailed
Previous studies have demonstrated an increase in food intake as a result of increases in reported stress [5,40], but have failed to focus on the specific nutrients that
Participants of the present study had to be generally healthy (absence of coronary heart disease, hypertension, diabetes; dyslipide- mia), overweight or obese (defined by a body
This study aimed to develop and pilot test an educa- tional video containing information regarding the in- formed consent process for trauma patients undergoing surgery, develop
Corroborating their strong desire to ensure patients were informed were HCPs concerns that the ever- increasing mainstream specialities now ordering genetic tests might not grasp
suis cells were detected on PAECs incubated with the negative control preparation (Figure 5d).. To assess whether the presence
