Hydrol. Earth Syst. Sci., 15, 1909–1919, 2011 www.hydrol-earth-syst-sci.net/15/1909/2011/ doi:10.5194/hess-15-1909-2011
© Author(s) 2011. CC Attribution 3.0 License.
Hydrology and
Earth System
Sciences
Hydropedological insights when considering catchment classification
J. Bouma1, P. Droogers2, M. P. W. Sonneveld3, C. J. Ritsema4,5, J. E. Hunink2, W. W. Immerzeel2, and S. Kauffman6
1em.Professor of soil science, Wageningen University, The Netherlands 2FutureWater, Wageningen, The Netherlands
3Land Dynamics Group, Wageningen University, The Netherlands 4Alterra, Wageningen, The Netherlands
5Land Degradation and Development Group, Wageningen University, The Netherlands 6ISRIC Wageningen, The Netherlands
Received: 25 January 2011 – Published in Hydrol. Earth Syst. Sci. Discuss.: 28 February 2011 Revised: 9 May 2011 – Accepted: 7 May 2011 – Published: 22 June 2011
Abstract. Soil classification systems are analysed to explore the potential of developing classification systems for catch-ments. Soil classifications are useful to create systematic order in the overwhelming quantity of different soils in the world and to extrapolate data available for a given soil type to soils elsewhere with identical classifications. This principle also applies to catchments. However, to be useful, soil clas-sifications have to be based on permanent characteristics as formed by the soil forming factors over often very long peri-ods of time. When defining permanent catchment character-istics, discharge data would therefore appear to be less suit-able. But permanent soil characteristics do not necessarily match with characteristics and parameters needed for func-tional soil characterization focusing, for example, on catch-ment hydrology. Hydropedology has made contributions to-wards the required functional characterization of soils as is illustrated for three recent hydrological catchment studies. However, much still needs to be learned about the physical behaviour of anisotropic, heterogeneous soils with varying soil structures during the year and about spatial and temporal variability. The suggestion is made therefore to first focus on improving simulation of catchment hydrology, possibly incorporating hydropedological expertise, before embarking on a catchment classification effort which involves major in-put of time and involves the risk of distraction. In doing so, we suggest to also define other characteristics for catchment performance than the traditionally measured discharge rates. Such characteristics may well be derived from societal issues being studied, as is illustrated for the Green Water Credits program.
Correspondence to: J. Bouma
1 Introduction
2 Soil classification
Classification can be justified as a scientific activity follow-ing different lines of reasonfollow-ing, to be illustrated here for soil science:
i. The scientific approach, where basic curiosity is the pri-mary driving force and where applications are not seen as an objective. Focus is on soils as they are formed in space and time under interacting soil forming fac-tors: parent material, climate, topography and biota, in-cluding humans. Some have regarded it as the primary purpose of soil classification to discover scientific laws (Smith, 1965). Others have even claimed that classifica-tion is the most important activity for science in general (Gerasimov, 1964);
ii. Creating the possibility to extrapolate knowledge ob-tained by measurements in a certain soil classification unit to another unit elsewhere for which no informa-tion is available except its identical classificainforma-tion. For-mally, in the US system of Soil Taxonomy (Soil Survey Staff, 1999) the lowest level of the soil series serves as a major vehicle to transfer soil information and research knowledge from one soil area to another. Soil series are classes of soil bodies (polypedons) that have limits and ranges more restrictive than all higher taxa (Soil Survey Staff, 1999). Thus, classification can be effective to ex-trapolate knowledge involving a substantial cut in cost because without classification any new soil observation would present a new challenge requiring a complete set of new measurements;
iii. Classification schemes require definition of soil charac-teristics to be applied as differentiating or diagnostic cri-teria at different levels in the scheme. Soils vary widely in the field, even at short distances. Discussing classifi-cation schemes requires standardization of procedures, separating what are considered to be major reflections of the soil forming factors from the minor ones. Standard-ization also involves selection of specific indicators, to be measured with methods that are accessible and not too costly. This discussion and selection process pro-vides a useful structure, focus and guideline for an oth-erwise overwhelming confrontation with the variation encountered in the field (i).
iv. Following point (iii), classification can also provide im-portant input into planning of soil research. Research should preferably be focused on major and not minor ef-fects of the soil forming factors and their measurement in space and time. As researchers, we want environmen-tal policies to take account for spatial variability in the best possible way. Therefore, we should supply policy makers and planners with standardisations that are un-derstandable and include the most relevant variability of our subject, and:
v. Communication to land users and politicians is signifi-cantly enhanced when soils have a name. In the USA, the lowest level of soil classification, the soil series, has been named after localities where they occur. An Antigo silt loam, for example, occurs near the city of Antigo in Wisconsin and this inspires local ownership. Many States in the USA have State Soils and a monolith of that particular soil can often be found in the halls of the State Capitol. In other countries, such as the Nether-lands, soil classifications are strongly based on local farmers knowledge and field names. This facilitates the adoption of these terms by interested citizens. An ad-ditional advantage is that soils are usually beautiful in terms of color patterns. This not only inspires artists but also contributes to effective communication. But what is being communicated? Beauty is a legitimate focal point but has a limited significance when focusing on the solution of pressing land use or water management problems. Communicating a soil name, as such, has limited appeal as well, the more so because soil names at higher levels than the soil series can become rather complicated, transmitting information only to experts (e.g. “very fine, mixed, mesic, Typic Haplaquod” fol-lowing Soil Survey Staff, 1999). The real value for so-ciety is to be derived from information about expected soil behaviour that is attached to a given classification unit. However, as stated above, the soil forming factors and associated processes that have resulted in the mor-phology of a given soil profile do not necessarily repre-sent actual physical, chemical and biological processes that determine soil behaviour. A functional analysis is therefore needed to “translate” properties of a given soil type into actual dynamic processes determining soil be-haviour (see also e.g. Bouma, 1989; Stolte et al., 1996, 2003; Hessel, 2003; Bouma et al., 2011).
To facilitate application of classification schemes, mod-ern classification systems such as Soil Taxonomy (Soil Sur-vey Staff, 1999) and the World Reference Base for Soil Resources (FAO, 2006) and many other national systems not discussed here, emphasize use of visible, morphomet-ric features when classifying soils. In other words, a trained soil scientist should be able to classify soils in the field on the basis of visual observations without immediately requir-ing elaborate chemical or mineralogical analyses. They are needed later, of course, to document soil properties and dif-ferentiating characteristics for classification. This is an at-tractive aspect of modern soil classification as it strongly in-creases operational efficiency.
J. Bouma et al.: Hydropedological insights when considering catchment classification 1911
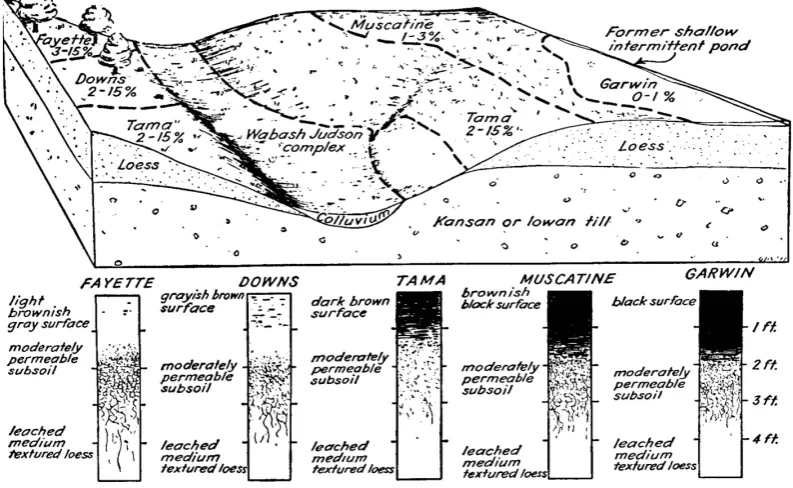
Fig. 1. Block diagram of soils in an Iowa catchment, USA, showing characteristic differences of soil types on the plateaus, the slopes and the valleys and demonstrating the importance of the soil forming factors parent material and topography.
by themselves and are therefore relatively easy subjects for classification. Soil classification is based on definition of ar-tificial and conceptual “pedons” and “polypedons” with an arbitrary surface area of several square meters and a depth to which the pedogenetic processes extend and are in practice defined by a boring or a soil pit. In classification, a distinc-tion is made between central concepts that reflect the ideal characteristics of the class and intergrades that belong to a class but grade into another class. More recent approaches have captured this using fuzzy techniques, also for land eval-uation purposes (e.g. Sonneveld et al., 2010). Also multiple measurements of moisture retention and hydraulic conduc-tivity have been made within large mapping units providing average curves but also standard deviations (Bouma, 1989), allowing Monte-Carlo simulations to express spatial variabil-ity. This allows, in principle, to present data-bands rather than curves.
In conclusion: pedons and polypedons cannot be observed as discrete entities. Catchment areas are usually better de-fined as spatial units but they are not discrete entities either. This creates specific problems for classification.
(ii) Classification is focusing on permanent soil features that have formed under influence of the soil forming factors over periods of hundreds to thousands of years. Soil classi-fication defines “the house” and not its inhabitants and their movements in and out of the house! Acts of soil manage-ment, such as plowing, should not change a given classifica-tion as this would reduce its usefulness. This aspect often re-sults in misunderstandings by users of soil information who
better described by soil structure of surface soil as affected by soil management rather than by its texture. They also showed that soil structure at any given location also changed signifi-cantly during the year. This demonstrates the complexity of characterizing infiltration processes in soils under field con-ditions. In conclusion: permanent soil features are needed for soil classifications but they may not adequately reflect actual hydraulic behaviour. This requires additional data related to dynamic processes. Analogous to this, the classification of catchments cannot be based on only permanent characteris-tics but should also not be solely based on widely available discharge data. Note that the important effects of land use are not considered in formal soil classifications whereas the authors believe that incorporating land use effects improves both the functional characterisation of soils as well as catch-ments.
(iii) Soil classification has most often been used to serve as a basis for the legends of soil maps that show the occurrence of different types of soil in a landscape. This can be done at different spatial scales. Conceptual three-dimensional mod-els (Figs. 1 and 2) are used to illustrate the relationships between the occurrences of different types of soil in differ-ent parts of the landscape. Originally, soil surveyors walked through the fields, making an occasional boring while draw-ing boundaries between adjacent soil types on the basis of topographical or other observed differences, thereby defin-ing “representative” soils for each map unit. The mappdefin-ing units were assumed to contain at least 70 % of the “represen-tative” soil but this was not documented and the percentage was often much lower (e.g. Kuilenburg et al., 1982). Still, from a functional point of view mapping units can be more homogeneous. Currently, techniques are used to better ex-press spatial variability by making statistically-defined mul-tiple measurements, using remote and proximal sensing, dig-ital mapping techniques, fuzzy set theory and geostatistics to translate point data to area data, including estimates of map purity and variability. The new research field of digital soil mapping offers new possibilities to express soil variability in space and time, not considering soil classification but with a focus on soil and landscape properties and features (e.g. La-gacherie, 2008). As we focus on the possible role of soil clas-sification, digital soil mapping will not further be discussed. Map legends also include broad descriptions of soil water regimes in terms of: well, moderately well, poorly and very poorly drained, indicating increasing wetness. These qual-itative, empirical statements are, of course, not adequate to feed modern simulation models for water regimes of catch-ments but they are a start and are valuable when compared with no information at all. In conclusion: soil maps suggest to the uninitiated observer occurrence of adjacent homoge-neous areas of soils in a given catchment. This is not cor-rect but techniques are available to express internal variabili-ties. Unfortunately, (costly) variability studies do not receive much emphasis in soil studies at this time.
3 Hydropedology
One of the objectives of hydropedology (Lin et al., 2006; Bouma, 2006) is to combine field expertise of soil scientists mapping soils (pedologists) with process knowledge of soil physicists and hydrologists, combining the best of the two scientific fields. Widely used pedotransfer functions have been proposed to “translate” static soil properties needed for classification into dynamic properties to be used for simulat-ing soil water regimes in soils and catchment areas (Bouma, 1989; Pachepsky and Rawls, 2004). These functions are an early expression of hydropedology and use soil properties from soil survey, such as texture, organic matter content and bulk density and relate those data by regression to parame-ters for dynamic simulation, such as moisture retention and hydraulic conductivity. Indiscriminate use of pedotransfer functions can, however, yield poor results as they only re-flect measurements of a limited range of soils which may not relate to the soils to be characterized. But pedological data can be much more useful beyond the context of pedotrans-fer functions which is increasingly recognized as the limita-tions of standard flow theory, in essence assuming soils to be isotropic and homogeneous, become painfully clear (Beven, 2006). Hydropedology studies have used modern soil phys-ical methods and theory to characterize flow regimes under natural, heterogeneous soil conditions with the objective to obtain flow parameters and boundary conditions for flow sys-tems that are more in agreement with heterogeneous condi-tions in the field. Detailed reports are provided elsewhere but relate to: (i) the effect of sample volume on measurement of the hydraulic conductivity in structured soils (Bouma, 1992) (i, ii) bypass flow (sometimes also called: “preferen-tial flow”), which is the rapid vertical movement of free wa-ter through vertical macropores in an unsaturated soil ma-trix (Bouma, 1981; Booltink and Bouma, 2002); (iiii) inter-nal catchment, which is accumulation of free water in dead-end macropores after bypass flow (Stiphout et al., 1987) and (iv) soil hydrophobicity, leading to unexpected surface runoff and rapid transport of water through preferential flow paths (Ritsema et al., 1993, 2005). Many other studies have been made on water movement in heterogeneous soils with macro-pores but they were usually not related to soil morphology and soil classification which is the theme of this paper.
J. Bouma et al.: Hydropedological insights when considering catchment classification 1913
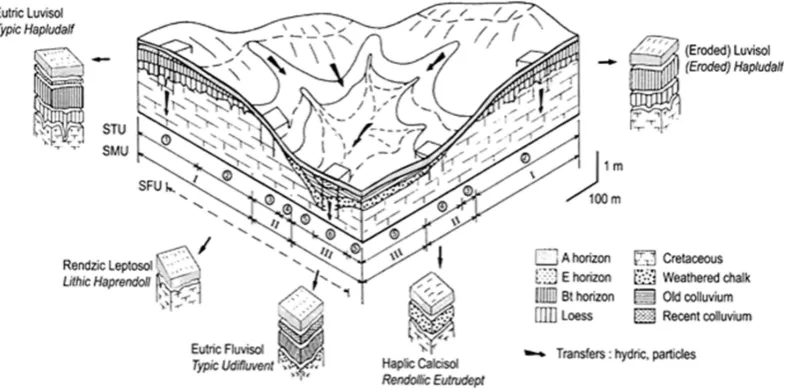
Fig. 2. Block diagram from the basin of Paris, illustrating the occurrence of different types of soil at different positions in the landscape. This diagram includes limestone bedrock, deep soils on the plateaus, thin ones on the slope and deep ones in the valleys. Streamlines of surface flow of water are determined by infiltration rates at the surface and by topography.
to unexpected landslides as free water accumulates at a given depth. Simulation models can easily be modified to take the mentioned processes into account by using morphological data from soil survey to redefine boundary conditions of the flow system (e.g. Hoogmoed and Bouma, 1980; Bouma et al., 1982, 1983). These simulations assume that water only moves into vertical, continuous macropores at the soil face when the infiltrative capacity of the adjacent soil sur-face is inadequate to accept the applied water at the given rate during a given time period. So, in fact, infiltration into the soil matrix next to the macropores is described with stan-dard flow theory while continuous macropores create the op-portunity for bypass flow where free water can reach rela-tively great depth in a short time. To calculate infiltration into soil surfaces with macropores, exact measurements of hydraulic conductivities are needed at pressure heads close to saturation. The crust test is particularly suitable for such measurements (Bouma, 1982). Bouma and Dekker (1978), using blue dyes, demonstrated bypass flow in the field in a dry clay soil with vertical shrinkage cracks and many more field experiments have been reported in literature showing identical phenomena (e.g. review by Van Schaik, 2009). An-other example shows that simulation of downward transport of a conservative tracer through a water repellent sandy field soil is significantly underestimated when using a traditional piston-based model approach (Ritsema et al., 2005). Only through adequate description of the dynamic formation and disappearance of preferential flow paths, reasonable model results could be achieved (Ritsema et al., 2005, Kramers et al., 2005). Clue is that hysteresis in the water retention char-acteristics should be accounted for in describing and model-ing flow and transport (Ritsema et al., 1998a; Ritsema and
Dekker, 2000). The formation, disappearance and reoccur-rence of preferential flow paths during weather sequences with dry and wet periods have been monitored in detail in the field using advanced automated TDR devices (Ritsema et al., 1998b). Results indicate that preferential flow paths are quickly formed during single rain events, and disappear soon after rainfall ceases. During successive rain events, preferen-tial flow paths reoccur at the same places, indicating that the position of these flow paths are fixed in space, and, among other factors, are determined by the wetting history (Ritsema et al., 1998b). This, in turn, might lead to the generation of soil heterogeneity in the long-term (Ritsema and Dekker, 1996). Recently, dynamic animations of infiltrating water through water repellent field soils have been constructed on basis of extensive field data (Oostindie et al., 2011) and by using software specifically designed for this purpose (Wes-seling et al., 2008). These animations clearly show that water infiltration in homogeneous sandy soils prone to hydropho-bic behaviour is far from uniform, and much more complex than earlier thought.
4 Examples of using the hydropedological approach for simulating water movement in catchments
4.1 Introduction
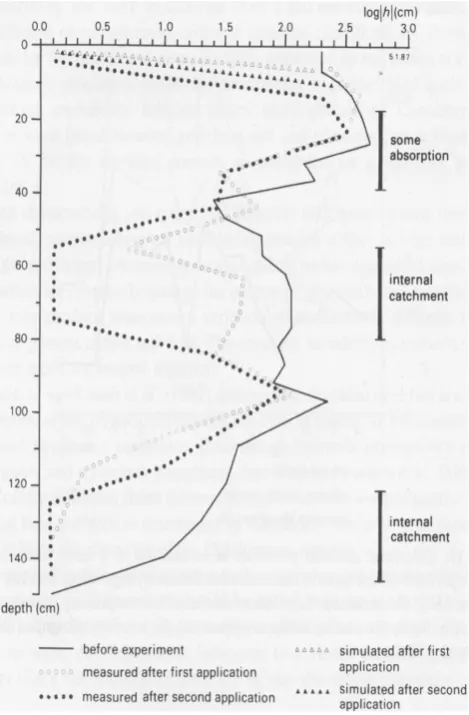
Fig. 3. Field- measured bypass flow and internal catchment in a silt loam soil with vertical macropores, demonstrating rapid wetting at around 60 cm and 140 cm depth (from van Stiphout et al., 1987).
information when simulating water regimes of catchments at different spatial scales.
The first study (Hunink et al., 2009) describes water regimes in the Upper Tana Basin in Kenya, an area of 17420 km square. The second one (van Schaik, 2009) dis-cusses the effect of bypass flow on infiltration patterns in a catchment of 1 km square, as a recent example of a hydrope-dological field study. The third example (Immerzeel et al., 2009) illustrates that hydropedological processes, assessed with modern remote sensing techniques, can provide impor-tant validation data for models simulating water regimes in catchments.
4.2 The Upper Tana basin study, Kenya
Hunink et al. (2009) characterized water regimes in a large watershed with the specific objective to develop a procedure that supports so-called Green Water Credits – an investment facility for upstream farmers to improve their soil and water
management which is targeted at increasing rainwater infil-tration and storage in the soil and reducing evaporation from the soil. This will feed the underlying aquifer and combat surface runoff and erosion. Both effects are beneficial for downstream water users. The Green Water Credits invest-ment facility is backed up by public and private partners. The latter are in particular the downstream water users as they benefit from upstream catchment management by rain-fed agriculturalists. The project is part of a general ten-dency in policy circles, also in the European Union, to sup-port farmers financially for so-called ecosystem services that used to be a side effect only of their commercial operations in dairy or arable farms. Payment of ecosystem services pro-vides an extra inducement for farmers to improve their soil management and requires proper hydropedological informa-tion and distributed analysis tools.
The use of Hydrological Response Units (HRUs) was found particularly useful for this type of study, as they al-low splitting up the model domain in unique combinations of topography, soil and land use, preserving the spatial dis-tribution of soils. The area contained 2226 HRU’s. How-ever, procedures used are empirical, based on expert judge-ment and no indication is provided on internal variability of HRU’s. The distributed hydrological model SWAT (Neitsch et al., 2002) was used to quantify water fluxes in the HRU’s. The study made use of large datasets based on public domain (Upper Tana SOTER, AfricCover, FEWS-NET) as well as locally sourced climate, soil and land use data sets. A com-plete description of these datasets can be found elsewhere (Hunink et al., 2009). Missing entries of the soil parameteri-zation are obtained by pedotransfer functions (van Engelen et al., 2005). Soil classification follows the Revised Legend of the Soil Map of the World (FAO, 2006). The area contained 68 soil types. The Upper Tana SOTER database includes the total available water capacity of the soil (simply expressed as water held between “field capacity” and “wilting point”) and rootable depth. An important missing factor is the saturated hydraulic conductivity (Ksat) that should preferably be mea-sured because it is highly variable and very small continuous soil pores can conduct large quantities of water (e.g. Bouma, 1992). But many measurements that would be needed for very large areas are not possible and pedotransferfunctions have been proposed, based on a statistical analysis of 350 measured Ksat values of various soils (Jabro, 1992). The dataset used here certainly contains questionable data ob-tained from small cores using the constant-head method that does not consider sample volume (Dane and Topp, 2002). The WOCAT land management database (WOCAT, 2007) was used to define appropriate management procedures to avoid soil degradation and erosion and to enhance infiltration and crop transpiration. Procedures were specifically defined for African conditions.
J. Bouma et al.: Hydropedological insights when considering catchment classification 1915
Fig. 4. Actual transpiration in Upper Tana, Kenya (mm per year).
available allowing calibration and validation of any model focused on calculating discharges. However, because of so-cietal questions raised in the Green Water Credits program, the role of soils in this study had to be much broader in terms of being the main driver for soil evaporation, crop evapotran-spiration, recharge to groundwater and erosion, all of which have different values at different locations in the catchment and all represent important properties of the catchment. Still, because of lack of alternatives, this SWAT modeling exercise was traditionally calibrated and validated with measured dis-charges at two locations (Hunink et al., 2009). Additional validation with remote sensing data, allowing, for example, an assessment of calculated evapotranspiration rates in the catchment, would have been attractive and is being investi-gated (e.g., Immerzeel and Droogers, 2008; Droogers and Kite, 2002).
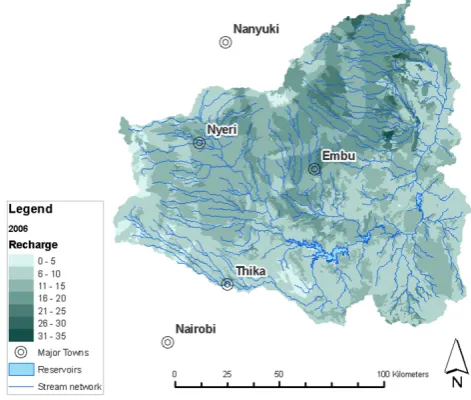
A typical result of this study is shown in Fig. 4, indicating the calculated total transpiration by plants, which is equiva-lent to the amount of “green water”. Transpiration is a func-tion of various integrated processes based on soils, land cover and land management. An important sustainability charac-teristic is the amount of water that is actually recharging the groundwater. Calculations show that this calculated recharge is spatially quite variable (Fig. 5).
[image:7.595.50.285.73.265.2]The ultimate objective of this study was to explore alter-natives in management to increase the quantity of green wa-ter and wawa-ter recharge. Explorative results of one particu-lar adaptation strategy, implementation of contour strips, are shown in Fig. 6. It was assumed that these contour strips were implemented on all agricultural lands and the study ex-plored what the impact would be in changes in groundwater recharge. The resulting map (Fig. 6) is now being used in Kenya for planning implementation of these contour strips but only in areas where this measure is expected to be most
Fig. 5. Groundwater recharge in Upper Tana, Kenya (mm per year).
Fig. 6. Spatial distribution of relative increase in groundwater recharge for the contour strips scenario in Upper Tana, Kenya.
effective, considering the patterns of Fig. 6. This will re-sult in a substantial reduction in costs as compared with con-structing contour strips in the entire area and may serve as a nice illustration of the hydropedology approach at work.
This study demonstrates the use of soil maps and asso-ciated information for the modeling exercise. Of particular interest is the demand-driven character of the exercise fo-cusing on an innovative application, the Green Water Credit facility, which has drawn major interest in the policy arena (see:www.greenwatercredits.org).
[image:7.595.311.546.309.506.2]of the HRU’s, used in the SWAT simulations. Just extrapo-lating point data for “representative” profiles to large areas of land represents a gross simplification ignoring variabili-ties involved. Still, a refusal to run a program such as this on scientific grounds would lead to a political free-for-all in practice, not guided by any information. This would be hard to justify but it is important to point out that this work repre-sents a first effort which is essentially based on expert knowl-edge and that efforts to better express variability, errors and limitations involved are crucial and in progress. Any sugges-tion at this point in time that a proven standard procedure is being followed would be misleading at best.
4.3 Spatial variability of infiltration
Van Schaik (2009) studied spatial variability of infiltration patterns in a small watershed in the Dehasa study area (near Extramadura) in a semi-arid Spanish environment. Her study is one of the first to upscale phenomena of bypass flow (called preferential flow by the author) from the individual soil to a larger land area. A standardized shower was ap-plied at 18 locations using water with a blue dye. Soils were excavated to observe patterns of infiltration indicating that bypass flow was prominent, particularly at the hilltops, while it was lower at the slopes and in the valley. Bypass flow was characterized by the depth of the uniform wetting front, the totally stained area, the maximum depth of the stains and the fraction of preferential flow as related to total flow. Regres-sion analysis showed that four site-specific variables (vegeta-tion, soil texture, slope and location in the landscape) could explain 50–66 % of bypass values obtained. This is still a relatively low score indicating the need for further field stud-ies. Still, different subareas could be distinguished in the catchment, each with characteristically different infiltration properties. Multiple measurements allowed an estimate of internal variability within each of the subareas. The study demonstrates the relevance of bypass flow when simulating water regimes in catchments. Moreover, when using the sim-ple: ”tipping bucket” flow model based on the static “field capacity” and “wilting point” concepts, bypass flow, as mea-sured here, can be handled well by assuming that bypass wa-ter moves right into the subsoil beyond the rootzone. So far, also in the Hunink et al. (2009) study, the implicit assump-tion is made that soils are homogeneous and isotropic, which they are not. Much work is still needed to move beyond the concepts of homogeneity and isotropy and hydropedological expertise can be helpful here.
4.4 Applying the Hydropedology approach to enhance model performance
It is common practice in hydrology to calibrate a hydrolog-ical model using a few discharge gauges near the outlet of a catchment. Model parameters are adapted until a satis-factory relation between observed and modelled discharge is
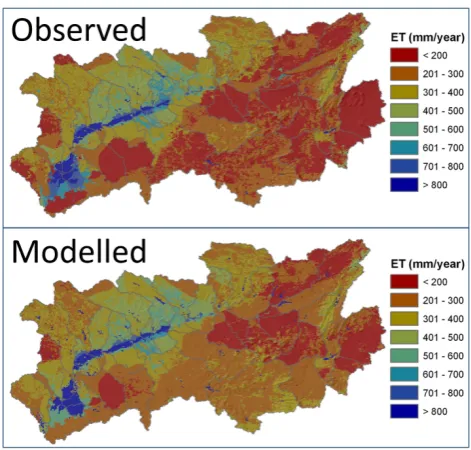
obtained. Although calibration results may seem statistically significant at a high degree of confidence this is not a guar-antee that the entire model is a correct representation of real conditions in the catchment. Process-based distributed hy-drological models usually combine high spatial heterogene-ity with a large number of model parameters and this may result in the equifinality problem, e.g. multiple parameter combinations yield the same result. The main problem is, however, that a good comparison between observed and sim-ulated discharge does not ensure that other processes, such as evapotranspiration, crop growth, groundwater recharge are correctly represented. The right result may be obtained for the wrong reason. A promising potential solution for these problems in model calibration is the use of spatially dis-tributed actual evapotranspiration (ETact) as a readily avail-able data source. Immerzeel et al. (2009) tested this approach for the Guadalquivir basin in southern Spain of 57 000 km2 (Fig. 7) using a time series of MODIS- based ETact maps based on the SEBAL algorithm (Bastiaanssen et al., 2005) and the Soil and Water Assessment Tool (SWAT; Neitsch, 2002). Figure 8 shows the spatial patterns of actual evap-otranspiration at HRU level for observed values using Re-mote Sensing (SEBAL) and the model (SWAT). The spatial patterns are depicted very well by SWAT. The Guadalquivir valley, where most irrigated agriculture is found, is clearly shown and no large spatial biases can be identified. The scatterplot in Fig. 9 shows good agreement between mea-sured and calculated ET’s as expressed by r-square of 0.94. A limited number of deviating values are shown, indicating that observations and model do not always match. However, these values are associated with special conditions which can be explained. Values in ellipse A are in the model classified as open water but occur in reality in dried areas following low rainfall conditions. Values in ellipse B are located in the rice paddy area and have an extremely high ETact. For these ar-eas the soil available water capacity as specified in the model is probably too low to achieve a similar ETact as observed. Ellipse C contains only two values that are most likely mis-classified as irrigated agriculture, while in ellipse D irrigated agriculture was erroneously classified as rangeland. For the values in ellipse E the deviations are probably due to an un-derestimation of plant stress factors (nutrients, soil, pests and diseases).
J. Bouma et al.: Hydropedological insights when considering catchment classification 1917
[image:9.595.50.287.65.239.2]Fig. 7. Study area Guadalquivir in Southern Spain.
Fig. 8. Observed (top) and modelled (bottom) actual evapotranspi-ration from October 2004 to September 2005 at HRU level.
5 Implications for catchment classification
First, the question should be answered which function, if any, catchment classification can and should play in the overall re-search programs on catchment hydrology. This is, of course, for the profession to decide but the five functions, discussed above for soil science, would probably also be relevant for catchment hydrology. But following the experiences pro-vided by developing soil classification, this would require the definition of permanent characteristics of the catchment to be used as differentiating characteristics for the different cate-gories of any classification scheme. One could think of, for example, geology, soils, topography, relief, degree of
branch-Fig. 9. Comparison observed (SEBAL) and modelled (SWAT) cal-ibration results. Ellipses A to E show areas where model differs from observations.
ing of surface flow channels and climate. Considering soils, names of classification units may appear mysterious for non soil scientists. However, certain permanent soil characteris-tics, such as texture, thickness of surface horizons or depth to slowly permeable subsurface horizons, and – less permanent-the organic matter content can be shown for a given region as single value maps that can rapidly be generated by Geograph-ical Information Systems when appropriate soil maps and databases are available (see case-study Tana Basin, Kenya, presented above). This direct type of soil information can be helpful when developing classification schemes for catch-ments.
Soil Taxonomy (Soil Survey Staff, 1999) distinguishes Soil Orders, Suborders, Groups, Subgroups, Families and Series, each one with differentiating characteristics of de-creasing significance for each lower classification category. Reaching agreement on a final soil classification scheme has taken at least forty years of intense discussions in the pe-riod 1960–2000 and an investment of an immense amount of energy by the pedology community. The question may be raised whether this time was well spent or if more empha-sis on functional soil characterization would have been more profitable for the profession? Catchment hydrologists would be well advised to reflect on this question as embarking on a serious classification effort will involve a substantial effort.
[image:9.595.49.285.277.502.2]more in terms of a dynamic property as a function of different boundary conditions than as a differentiating characteristic for catchment classification. Comparable discharges may re-sult from different weather conditions or different processes in various catchments. Also, and more importantly, a classifi-cation based on current discharges will not be valuable when trying to predict catchment behaviour under changed condi-tions of climate or land-use change, which represent the real problems of the future.
In view of the difficulties still encountered when simulat-ing water regimes in catchments and considersimulat-ing the major investment needed to develop a widely accepted classifica-tion scheme, it would perhaps be wiser at this point in time to focus energy on first trying to improve simulation results of watershed hydrology before developing catchment classifica-tion schemes. As discussed, incorporating hydropedological data to improve the characterization of the unsaturated zone may help. Also, it would be advisable to broaden the tradi-tional focus on catchment discharge as a differentiating char-acteristic by paying more attention to other features that arise from societal concerns. The Green Water Credits example of Kenya, presented above, illustrates, for example, an inno-vative approach presenting a new differentiating catchment characteristic (“Green Water”) based on a practical question. In pedology, soil classification has received major empha-sis for several decades. Lately, functional characterization of soil units in space and time is slowly receiving more attention (e.g. Bouma, 1989; Stolte et al., 1996, 2003; Hessel et al., 2003) and this is particularly interesting for practical appli-cations. But as soil scientists were inward looking while de-veloping complicated classification schemes, soil data were not used by hydrologists and engineers as they could have been. Perhaps, there are lessons here for hydrologists study-ing watershed hydrology. Why not focus first on improvstudy-ing the functional characterization of catchments in the context of societal issues raised and focus later on catchment classi-fication when more data and insight have been generated?
Acknowledgements. Comments and recommendations from reviewers have improved the quality of this paper and is highly appreciated.
Edited by: T. Wagener
References
Bastiaanssen, W. G. M., Noordman, E. J. M., Pelgrum, H., Davids, G., and Allen, R. G.: SEBAL for spatially distributed ET under actual management and growing conditions, J. Irrig. Drain. E-ASCE, 131, 85–93, 2005.
Beven, K.: Searching for the Holy Grail of scientific hydrology: Qt=(S,R,1t)A as closure, Hydrol. Earth Syst. Sci., 10, 609– 618, doi:10.5194/hess-10-609-2006, 2006.
Booltink, H. W. G. and Bouma, J.: Bypass flow. In: Methods of Soil Analysis. Part 4: Physical methods, SSSA Book series: 5. Madison, Wis., 930–933, 2002.
Bouma, J.: Soil morphology and preferential flow along macrop-ores, Agric. Water Manage., 3(4), 235–250, 1981.
Bouma, J.: Measuring the hydraulic conductivity of soil horizons with continuous macropores, Soil Sci. Soc. Am. J., 46(2), 438– 441, 1982.
Bouma, J.: Using soil survey data for quantitative land evaluation, edited by: Stewart, B. A., Adv. Soil Sci., 9, Springer Verlag, New York: 177–213, 1989.
Bouma, J.: Influence of soil macroporosity on environmental qual-ity, Adv. Agron., 46, 1–37, 1991.
Bouma, J.: Effect of soil structure, tillage and aggregation upon soil hydraulic properties. Advances in Soil Science. Interacting Processes in Soil Science, edited by: Wagenet, R. S., Baveye, P., and Stewart, B. A., Lewis Publishers, Boca Raton-Ann Arbor-London-Tokyo, 1–37, 1992.
Bouma, J.: Hydropedology as a powerfool tool for environmental policy research, Geoderma, 131, 275–287, 2006.
Bouma, J. and Dekker, L. W.: A case study on infiltration into dry clay soil. I Morphological observations, Geoderma, 20, 27–40, 1978.
Bouma, J., Belmans, C. F. M., and Dekker, L. W.: Water infiltra-tion and redistribuinfiltra-tion in a silt loam subsoil with vertical worm channels, Soil Sci. Soc. Amer. J., 46(5), 917–921, 1982. Bouma, J., Belmans, C. F. M., Dekker, L. W., and Jeurissen, W. J.
M.: Assessing the suitability of soils with macropores for sub-surface liquid waste disposal, J. Environm. Qual., 12, 305–311, 1983.
Bouma, J., Stoorvogel, J. J., and Sonneveld, M. P. W: Land Evalu-ation for Landscape Units. Chapter E6 in Handbook of Soil Sci-ence, edited by: Summer, M. E., CRC Press. Boca Raton, USA, in press, 2011.
Dane, J. H. and Topp, G. C.: Methods of Soil Analysis. Part 4. Physical Methods, No.5 in the Soil Science Society of America Book Series, SSSA, Madison, Wis. USA, 2002.
Droogers, P. and Bouma, J.: Soil survey input in exploratory mod-elling of sustainable soil management practices, Soil Sci. Soc. Amer. J., 61, 1704–1710, 1997.
Droogers, P. and Kite, G. W.: Remotely sensed data used for model-ing at different hydrological scales, Hydrol. Process., 16, 1543– 1556, 2002.
FAO: World Reference Base for Soil Resources 2006, 2nd Edn., World Soil Resources Reports, No. 103, Rome, 2006.
Gerasimov, J. P.: A modern Dokuchayev approach to soil classifi-cation and its uses on the soil maps of the U.S.S.R. and of the world, Soviet Soil Sci., 6, 563–571, 1964.
Hessel, R., Messing, I., Liding, C., Ritsema, C. J., and Stolte, J.: Soil erosion simulations of land use scenarios for a small Loess Plateau catchment, Catena, 54, 289–302, 2003.
Hoogmoed, W. B. and Bouma, J.: A simulation model for predict-ing infiltration into cracked clay soil, Soil Sci. Soc. Amer. J., 44(3), 458–461, 1980.
Hunink, J. E., Immerzeel, W. W., and Droogers, P.: Green Water Credits for the Upper Tana Basin, Kenya. Phase II-Pilot Opera-tions. Biophysical assessment using SWAT, Report FutureWater 84, Wageningen, The Netherlands, 2009.
Immerzeel, W. W. and Droogers, P.: Calibration of a distributed hydrological model based on satellite evapotranspiration, J. Hy-drol., 349, 411–424, 2008.
J. Bouma et al.: Hydropedological insights when considering catchment classification 1919
Bierkens, M. F. P.: Spatial downscaling of TRMM precipitation using vegetative response on the Iberian Peninsula, Remote Sens. Environ., 113, 362–370, 2009.
Jabro, J. D.: Estimation of saturated hydraulic conductivity of soils from particle size distribution and bulk density data, Journal of the American Society of Agricultural Engineers, 35(2), 557–560, 1992.
Kramers, G., van Dam, J. C., Ritsema, C. J., Stagnitto, F., Oostindie, K., and Dekker, L. W.: A new modeling approach to simulate preferential flow and transport in water repellent porous media: model sensitivity, and effects on crop growth and solute leach-ing., Austr. J. Soil Res., 43, 371–382, 2005.
Kuilenburg, J. van, de Gruijter, J. J., Marsman, B. A., and Bouma, J.: Accuracy of spatial interpolation between point data on soil moisture supply capacity, compared with estimates from map-ping units, Geoderma, 27(4), 311–325, 1982.
Lagacherie, P.: Digital Soil Mapping: A State of the Art, in: Digital Soil Mapping with Limited Data, edited by: Hartemink, A. E., McBratney, A., and Mendonca-Santos, M. L., Springer Verlag, 2008.
Lin, H., Bouma, J., Pachepsky, Y., Western, A., Thompson, J., van Genuchten, R., Vogel, H. J., and Lilly, A: Hydropedology: Syn-ergistic integration of pedology and hydrology, Water Resour. Res., 42, W05301, doi:10.1029/2005WR004085, 2006. Neitsch S. L., Arnold, J. G., Kiniry, J. R., Williams, J. R., and King,
K. W.: Soil and Water Assessment Tool (SWAT). Theoretical Documemtation, version 2000, Taxes Water Resources Institute, College Station, Texas, 2002.
Oostindie, K., Dekker, L. W., Wesseling, J. G., and Rit-sema, C. J.: Water movement in an undulating sandy soil prone to water repellency, Vadose Zone J., 10, 262–269, doi:10.2136/vzj2010.0051, 2011.
Pachepsky, Y. A. and Rawls, W. J. (Eds): Development of pedo-transfer functions in soil hydrology, Elsevier, Developments in Soil Science, 30, Amsterdam, the Netherlands, 2004.
Pulleman, M. M., Bouma, J., van Essen, E. A., and Meijles, E. W.: Soil organic matter content as a function of different land use history, Soil Sci. Soc. Amer. J., 64, 689–694, 2000.
Ritsema, C. J. and Dekker, L.W.: Water repellency and its role in forming preferred flow paths in soils, Austr. J. Soil Res., 34, 475– 487, 1996.
Ritsema, C. J. and Dekker, L. W.: Preferential flow in water repel-lent sandy soils: Principles and modeling implications, J. Hy-drol., 231–232, 308–319, 2000.
Ritsema, C. J., Dekker, L. W., Hendrickx, J. M. H., and Hamminga, W.: Preferential flow mechanism in a water repellent sandy soil, Water Resour. Res., 29, 2183–2193, 1993.
Ritsema, C. J., Dekker, L. W., Nieber, J. L., and Steenhuis, T. S.: Modeling and field evidence of finger formation and finger re-currence in a water repellent sandy soil, Water Resour. Res., 34, 555–567, 1998a.
Ritsema, C. J., Nieber, J. L., Dekker, L. W., and Steenhuis, T. S.: Stable or unstable wetting fronts in water repellent soils - effect of antecedent moisture condition, Soil Till. Res., 47, 111–123, 1998b.
Ritsema, C. J., Dam, J. C. van, Dekker, L. W., and Oostindie, K.: A new modelling approach to simulate preferential flow and trans-port in water repellent porous media: model structure and vali-dation, Aust. J. Soil Res., 43, 361–369, 2005.
Smith, G. D.: Lectures on soil classification, Pedologie Special No. 4, 1–135, 1965.
Soil Survey Staff: Soil Taxonomy: a basic system of soil clas-sification for making and interpreting soil surveys (2nd Edn.), Washington, DC, US Department of Agriculture Soil Conserva-tion Service, 1999.
Sonneveld, M. P. W., Bouma, J., and Veldkamp, A.: Refining soil survey information for a Dutch soil series using land use history, Soil Use Manage., 18, 157–163, 2002.
Sonneveld, M. P. W., Hack-ten Broeke, M. J. D., van Diepen, C. A., and Boogaard, H. L.: Thirty years of systematic land evaluation in the Netherlands, Geoderma, 156, 84–92, 2010.
Stolte, J., Ritsema, C. J., Veerman, G. J., and Hamminga, W.: Es-tablishing temporal and spatially variable soil hydraulic data for use in a runoff simulation in a loess region of the Netherlands, Hydrol. Process., 10, 1027–1034, 1996.
Stolte, J., van Venrooij, B., Zhang, G., Trouwborst, K. O., Liu, G., Ritsema, C. J., and Hessel, R.: Land-use induced spatial het-erogeneity of soil hydraulic properties on the Loess Plateau in China, Catena, 54, 59–76, 2003.
Van Engelen, V. W. P, Batjes, N. H, Dijkshoorn, K., and Huting, J.: Harmonized Global Soil Resources Database (Final Report), Report 2005/06, ISRIC – World Soil Information, Wageningen, available at: www.isric.org, 2005.
Van Schaik, N. L. M. B.: Spatial variability of infiltration patterns related to site characteristics in a semi-arid watershed, Catena, 78, 36–47, 2009.
van Stiphout, T. P. J., van Lanen, H. A. J., Boersma, O. H., and Bouma, J.: The effect of bypass flow and internal catchment of rain on the water regime in a clay loam grassland soil, J. Hydrol. 95(1/2), 1–11, 1987.
Viscarra Rossel, R. A., Mc Bratney, A., and Minasny, B.: Proximal Soil Sensing, Springer Verlag, 2010.
Wagener, T, Sivapalan, M., Troch, P., and Woods, R.: Catchment classification and hydrologic similarity, Geography Compass, 1(4), 901–931, 2007.
Wesseling, J. G., Oostindie, K., Dekker, L. W., Van den Elsen, H. G. M., and Ritsema, C. J.: Animating measured precipitation and soil moisture data, Computers and Geosciences, 34, 658–666, 2008.