Carbon Dioxide Partial Pressure in Lysimeter Soils'
Charles W. Robbins2ABSTRACT
The carbonate chemistry portion of mechanistic salinity models is generally the weak link in describing salt reactions in soils. This is primarily due to a lack of available soil atmosphere CO2 data. Carbon dioxide concentrations were measured at 0.25, 0.50, and 0.75 m depths in 0.30 m diam lysimeters containing 1.0 m of sodic soil. Four non-cropped treatments included a check, gypsum, fresh man-ure, and chopped alfalfa irrigated weekly with 70 mm (5.0 1) of tap water (EC-0.7 and SAR= 1.7). Six cropped treatments included barley (Hordeum rulgare), alfalfa (Medicago sativa L.), Sordan 1Sor-dan is a hide name for a sorghum (Sorghum bicolor), su1Sor-dangrass (Sorghum sadanese hybrid], Sordan + leaching, cotton (Gossypians Mamma L), and tall wheatgrass (Agropyron elongation). The cropped lysimeters were irrigated at 1.25 times the consumptive use since the previous irrigation (0.20 leaching fraction). Soil P values were decreased by the gypsum treatment and increased by all other treat-ments as compared to check. Cotton and barley had the lowest Pc02 values for the cropped treatments and Sordan had the highest
(fre-quently above 16 kPa). The Pc02 levels were affected by applied organic matter source, crop, plant growth rate, irrigation water
ap-plication and leachingg.
Additional index words: Carbonate, Bicarbonate, Soil Aeration,
Soil Air.
C
ARBON dioxide partial pressure (Pc02) is one of several factors that control soil solution pH and calcium ion activity (Ca") in calcareous and sodic soils. The reason is because CO 2 dissolves in water and forms carbonic acid (H 2CO3 ) which, in turn, dis-sociates to form hydrogen (H+), bicarbonate (HCO3, and carbonate (C0r) ions. The total concentration of HCOi and COi- anions, the ratio between the two, and the sodium ion concentration to a great extent, controls the pH of arid and semiarid soils. The CO3- ion activity also reacts with Ca' to control its activity (Robbins, 1985; Tanji and Doneen, 1966).
Soil salinity models designed to describe salt reac-tions in high pH soils require modeling carbonate chemistry, and consequently Pc02data for the soil at-mosphere must be calculated or supplied (Oster and Rhoades, 1975; Robbins et al., 1980; Suarez, 1982). Considerable information is available on the effect of time, temperature, moisture, and organic matter on
Prot in laboratory soil samples (Enoch and Dasberg, 1971; Yamaguchi et al., 1967) and on soil surface flux of CO2 under field conditions (de Jong et al., 1974). However, only limited soil atmosphere CO 2 data are available for soils containing growing crops.
The purpose of this study was to collect and com-pare the soil atmosphere CO 2 partial pressure data from four non-cropped and six crop treatments under green-house lysimeter conditions where water applications. temperatures and soil type would be similar for all treatments.
MATERIALS AND METHODS
The surface 0.15 m ofa Freedom silt loam (fine-silty, mixed, mesic, Xerollic Calciorthids) soil was used in the lysimeter study. The soil was taken from an area that had not been irrigated or cultivated and was sodic in the surface. The exchangeable sodium percentage (ESP) was 33, the cation exchange capacity (CEC) was 210 mmoles of charge per kg,
the saturation paste pH was 8.6 and the saturation paste extract electrical conductivity was 2.4 dS
The 1.18 m deep lysimeters were constructed from 0.30 in ID polyvinyichioride irrigation pipe. A 0.05 m layer of coarse sand was placed in the bottom of each lysimeter over a drain tube. The soil was then added and vibrated until a 1.0 m depth of soil was compacted to a bulk density of 1.35 Mg m-3. Heavy walled glass sampling tubes (13 mm ID by 0.20 m long) were then inserted 0.15 m into the side ports at 0.25, 0.50, and 0.75 m below the soil surface. The inside end of the tube was left open and the outside end was covered with a rubber septum for gas sampling. The lysimeters were on a hydraulic weighing system used to measure evapotran-spiration, irrigation, and drainage (Robbins and Willardson, 1980). The study was conducted in a partly temperature-controlled greenhouse with supplemental lighting from 1 Oc-tober to 1 April.
Each of 10 treatments was duplicated. The four non-crop treatments included a check, 5.0 kg gypsum m-2, 5.0 kg chopped alfalfa (Medicago sativa L.) m- 2, and 5.0 kg fresh manure m-2. Gypsum, chopped alfalfa, and manure were completely mixed with the surface 0.20 m of soil. The gyp-sum rate was equal to 1.25 times the exchangeable sodium in the upper 0.50 m on an equivalent basis. The alfalfa and manure were applied on an air dry basis (oven dried at 55°C). These four treatments were irrigated every 7 days with 70 mm (5.0 L) of tap water (EC - 0.7 cis and SAR = 1.7) until the infiltration rate decreased to below 70 mm in 5 days. The six cropped treatments were barley (Hordeum vtd-gare), alfalfa, Sordan [Sordan is a trade name for a sorghum
(Sorghum bicolor), sudangrass (Sorghum sudanese) hybrid],
Sordan + leaching, cotton (Gossypium hirsurum L.), and tall wheatgrass (Agropyron elongatum). Two lysimeters were irrigated the same as the check until it took more than 5 days for 70 mm of water to enter the soil. Sordan was then planted and this treatment was designated as the leached + Sordan treatment. The rest of the crops were planted three days after a 140 mm (10 L) tap water irrigation and then covered for 4 days with aluminum foil. By that time' the crops had emerged. All crops were then irrigated at 1.25 times the consumptive use (0.20 leaching fraction) since the last irrigation on a semiweekly, weekly, or biweekly schedule, depending on water use rate of a particular crop. The leach-ate wleach-ater was collected and the volume measured and sub-tracted from the irrigation water volume to calculate eva-potranspiration.
The whole barley plants were harvested at maturity and then replanted to barley 2 weeks later. Three crops were grown. The second and third crops were fertilized with 2.1 g of ammonium nitrate (100 kg N ha-') at planting time. After the third barley crop was harvested, those two lysi-meters were irrigated with 1.25 times the volume of water used since the last irrigation and were then planted to tall wheatgrass. The tall wheatgrass was planted 14 days after the third barley crop was harvested and three days after the lysimeters had been irrigated. The grass was harvested four times when it was 0.5 in tall. Four alfalfa crops were grown and harvested at full bloom. The Sordan was cut four times when most of the seed heads were at hard dough stage and were also fertilized with 2.1 g of ammonium nitrate (100 kg
Contribution from USDA-ARS, Snake River Conservation Re-search Center, Kimberly, ID 83341. Received 1 May 1985.
2 Soil scientist, Snake River Conservation Research Center, Kim-berly, ID 83341.
Published in Agron. .1. 78:151-158 (1986).
I8 a.
16 (C I4 te) 12
a.
•
10 8 $7 -it 6cc a_
.11
— 0.25m Depth
--- 0.50m Depth 0.75m Depth
First water { out bottom
Irrigations
— 0.25m Depth --- — 0.50 m Depth 0.75 m Depth
out
water
out bottom 20
18 16 14 12 10 8 6
4
N ha- 1 ) after each cutting. The cotton was allowed to grow until all boils were ripe and the leaves had started to drop and new leaf buds started to form.
Duplicate carbon dioxide samples were initially taken at the three depths with a 20 mL syringe and needle through the septum covered glass port. A 15 mL sample was stored in 10 mL evacuated vials coated with paraffin to reduce sample leakage. The gas samples were then analyzed with a Hewlett Packard 5730A Gas Chromatograph 3. Later, 5 mL
samples taken directly from the glass sampling tubes were analyzed with a Microtechnoiogy 5003 portable gas micro-chromatography unit.
3 The use of brand names is for the reader's convenience and does not imply endorsement of these instruments over any other by the authors or sponsoring institution.
Initially the samples were taken daily. When it became evident that the CO2 levels in the soil air followed a cyclic pattern following each irrigation, after 2 months, samples
were not taken on weekends. Samples taken on irrigation days were always taken before the water was applied. Sam-ples were not taken for several days on some treatments due to problems with analytical equipment.
RESULTS
Carbon dioxide partial pressure values agreed very
well between duplicate treatments (± 5 to ± 15%) for a given time and depth, except for the first Sordan grass crop. One Sordan lysimeter went anaerobic for a short period due to a plugged drain tube, thus causing
20 40 60 80 100 120 140 160
DAYS SINCE FIRST IRRIGATION
Fig. 1. Carbon dioxide partial pressure at three depths for the check treatment. Irrigation frequencies are shown by the longest vertical lines.
Irrigations
II.l,.J1iiJ .1,,,I..
20
40
60
80
100
120
140
160
DAYS SINCE FIRST IRRIGATION
a
Y
to re
cn
cr
_1 4
1
7-Ci.
N
0 20
18
16
14
12
10
4 •
:
tri ••
2 Irrigations
1 ILL 1 1. n AIL Al, It rift 1 I 1 1, , , J.
20 40 60 80 100 120 140 160
DAYS SINCE FIRST IRRIGATION
Fig. 4. Carbon dioxide partial pressures at three depths for the chopped alfalfa treatment.
6
0.25m Depth --- 0.50m Depth
••••••0.75
m
Depth rFirst water
out bottom reduced plant growth. Because of the close agreement between duplicate samples, the large data volume, and the exploratory nature of the study, only Pool data
from one lysimeter for each treatment is shown. All four of the noncropped treatment soils eventually sealed up and the infiltration rates slowed to the point that it took over 5 days for the 70 mm irrigation to enter the soil. At that point irrigation was terminated. The end of the CO2 data lines in Fig. 1 through 10
represent the time when irrigation was stopped for each treatment.
Check.The soil Pco, increased at all check treatment
depths until the soil columns became saturated and water drained from the lysimeters. The Poo, was in excess of 7 kPa for several samplings at 0.50 and 0.75 m and slightly lower at 0.25 m. Following water drain-age from the lysimeters, a sharp decrease in Poo, was measured, followed by a smaller increase that peaked somewhat lower than the maximum prior to the first drainage water outflow. Beyond this second peak the Pox leveled of at about 1.5, 3.0 and 3.5 kPa for the 0.25, 0.50 and 0.75 m depths (Fig. 1).
Gypsum. The Pc°, values for the gypsum treatment
followed the same pattern as the check except that the
20 .–. 18
D
Y I6 gr 14 0.) 12ce 1q a. _t 4
1—
CL
N
0
8
6
4
2
0.25m Depth — 0.50m Depth
• 0.75
m
Depthf
First water out bottom
irrigation
1 ILL .1[11.,11 L .1.11 e „ e , i 1 1 t I „
20 40 60 80 100 120 140 160
DAYS SINCE FIRST IRRIGATION
0.75 m Depth
First water.'
out bottom
Planted
4 : ;
if
.
0Planted
41
First harvest
• :
... :
Third harvest Second
harvest
values were about 50 to 60% that of the check. For the first five irrigations the 0.25 m depth was lower than the other two, but after the first drainage water outflow the Pco2 values for the three depths leveled off between 1 and 2 kPa (Fig. 2).
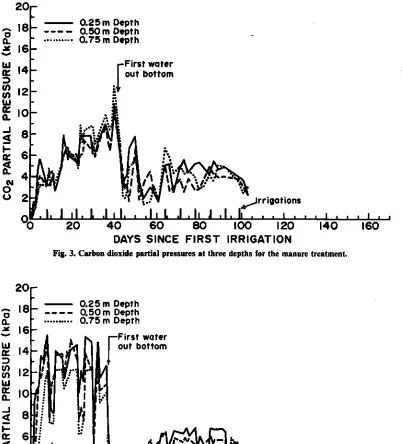
Manure.The manure treatment Pc02 values had the same general pattern as the check, but the values were higher than the check. The Pco2 values were more
uni-form with depth for most of the sampling period than were
the check CO2
P values (Fig. 3).Chopped Alfalfa.By the second irrigation all chopped alfalfa treatment sample depths had reached their maximum Pco2 values and remained high until the
first water drained from the lysimeters. The 1)002 nearly always decreased at all depths shortly following each irrigation. For the period during which water was draining from each irrigation the Pc02 values were generally higher than for the other three non-cropped treatments. The Pco2 gradient with depth was reversed for the manure and chopped alfalfa compared to that of the other two non-cropped treatments (Fig. 4).
Barley. While the first crop of barley was in the early growth stage the P- CO2 values increased slowly. Once
the crop began vigorous vegetation growth the Pco2 CO2 rapidly increased until the first water drained from the lysimeters. After a sharp decrease the Pc02 again in-creased slightly and then dropped off as the crop ma-tured. The deeper soil depths had higher Pc02 values during the second barley crop, but the third crop did not sustain as high Pco2 levels. There was usually a drop in the P002 values after each irrigation. The Poo, was above 10 kPa in only a few samples taken during the first and second crops (Fig. 5).
Alfalfa. The first alfalfa crop had the highest Pco2
values with sharp decreases after the first leachate drained from the lysimeters and after each of the four cuttings. There were also Pan drops after most irri-gations. The Pc02 exceeded 12 kPa in the first crop
and
10
kPa in the subsequent crops, several times. The P00.2 pattern was similar to that for barley but was slightly higher (Fig. 6).Sordan. A sharp Pc02 decrease was not observed after the first leachate drainage from the Sordan lysi-meters, but there were sharp Pc02 decreases after each of the four harvests. Irrigation water applications were usually followed by slight Pco2 decreases. No single
depth was constantly lower or higher in CO2 than the other two. The presence of actively growing Sordan plants produced the highest Pc02values of the 10
treat-ments studied. Values in excess of 14 kPa were not uncommon and values in excess of 18 kPa were re-corded on several occasions (Fig. 7). The Sordan also produced the largest mass of top growth and this ap-pears to be associated with the higher Pc02 values.
Leached and Sordan. This treatment was the same as the check for the first 11 irrigations in that it was irrigated weekly. Then following the 11th irrigation it was planted to Sordan. Irrigation was then applied at 1.25 times consumptive use once the grass was 0.40 m tall. The Pco2 values were similar to the check until the Sordan started vigorous growth and water use. There were Pun drops after each harvesting as in the Sordan treatment, but the leached + Sordan treatment did not produce quite as high Poo, values as the Sordan treatment planted at the time of the first irrigation. During the second and fourth crop, values in excess of
13
kPa were recorded several times and during the third crop and fourth crop, values in excess of 15 kPa were measured (Fig. 8).Tall wheatgrass. Tall wheatgrass was planted after the third barley crop. During the first crop while the grass was becoming established, the Pc02 decreased until the grass was cut and fertilized, and regrowth became vigorous. The second through fourth crops had quite similar Pco2 patterns. The 0.25 m depth had lower Pco2 values than the other two and the 0.75 m
20–
18
x 16
re
re 14
ce) 12 –
W
re 10
a.
-
8
4
▪
6
4
a_
–
N
0
u 2–
0.25m Depth ---- 0,50m Depth
je
,trrigations
of I 11,1.1 I .1 . . 11.11 1 .1. . L I. .
-
0
40
80
120
160 200 240 280
320
DAYS SINCE PLANTING
First water out bottom-1
First harvest
i
Second harvest
20 18
tL
n
14
(r)
W I2
4
1
7
6
a.
O
• 4
U
2
16Fourth Third harvestiharvest
Irrigations
.ae"
"4'0" 11"1
1
21
01
.1.
1(1
51
'2•S•
0
1
1
I
'
I 1
24'd
.
"i2181 1
(511 1(5
40.25m Depth
-- 0.50m Depth ••••• 0.75m Depth
10
8
depth was usually highest. Values in excess of 12 kPa were measured at 0.75 m and 8 kPa occasionally oc-curred at 0.50 m. The Pox nearly always rose sharply the day after irrigation of wheatgrass and then dropped the second day after irrigation whereas the rest of the treatments had an immediate drop in Pco, on the day following irrigation (Fig. 9).
Cation. Cotton had a different soil Poo, pattern than the other crops. During the plant establishment stage, it increased gradually and then increased sharply to 6 kPa as vigorous foliage growth and water use took place. During the major blooming stage the Pop, de-creased to around 3 to 4 kPa and then inde-creased to as
high as 8 kPa while the bolls were filling. The Pco, then decreased to between 2 to 4 kPa as the bolls ma-tured and leaf abscission began (Fig. 10).
DISCUSSION
Recognizing that the growing conditions in green-house lysimeters are different from those in the field and that care must be used in extrapolating these kinds of data to field conditions, this study was conducted to determine soil atmosphere P- co2 values for four leaching treatments and five field crops grown under similar conditions.
20-IA 16-'
4
;-12-a25m Depth - 0.50m Depth 0.75m Depth
First water out
I: 0.
First harvest
4
Fourth harvesti
L4 Second
harvest Third harvest
0
U
4
2
0 111 1L1[11111.1k .1111.1II I.l,II .1.1 .11 J
11.1.11 I
L0
40
80
120
160 200
240 280
DAYS SINCE PLANTING
Fig. 6. Carbon dioxide partial pressures at three depths for the alfalfa treatment.
11.
320
DAYS SINCE PLANTING
canted
_First water
out bottom
—
0,25m Depth
---- 0.50m Depth
0.75m Depth
Second harvest
First harvest
j
irrigations
Lill HI. it Ir.! r ILI L rI I.1 It 1.1 Ili
40
80
120
160 200 240 280 320
1-0.25m Depth
0.50 m Depth
0,75m Depth
18
16
14
12
10
8
6
4
Second harvest
-1 t:
156
AGRONOMY JOURNAL, VOL. 78, JANUARY-FEBRUARY 198620
—DAYS SINCE FIRST IRRIGATION
Fig. 8. Carbon dioxide partial pressures at three depths for the leached, then Sordan treatment. The crop was not planted until sufficient water had been applied for four leaching events to take place (about 0.5 pore volumes of leachate).
igations
I .1 , 1,1 .11 11.1.1i LI,1 L11111.11
120
160 200 240 280 320
DAYS SINCE PLANTING
Fig. 9. Carbon dioxide partial pressures at three depths for the tall wbeatgrass treatment.
*C1 a.
18
Jg 16
14
o
ti,
w 12
10
4
8
a.
6
4
01
c-)
2
0 „
Ii 1 .1 Iii L0
40
80
The CO
2 produced in the check and gypsum treat-ments was due to native organic matter decomposi-tion. Application of water to this artificial system caused an initial rapid organic matter decomposition and a flush of CO 2, and then the P- CO2 partial pressureleveled off at around 1 to 3 kPa. The check Pox values in this study agreed with those measured by Yama-guchi et al. (1967), at three depths and 20°C in 80 cm columns with a low organic matter soil and a pH of 6.9. The values reported here are generally lower than those reported by Enoch and Dasberg (1971) for five low organic matter laboratory soils treated with 3 g of powdered milk per kg of soil.
The Pm, in the gypsum treatment was lower than the check as would be expected since as the Ca 2+ ac-tivity increases, the CO;- acac-tivity must decrease due
to
CaCO3 precipitation which in turn decreases HCOT, H 2CO3, and finally soil air CO 2 (Robbins. 1985). During the drying cycles, the check treatment devel-oped large cracks that probably caused the Pccu gra-dient with depth. The gypsum treatment did not ex-hibit the cracking nor the Pox gradient after the first drainage event.en
-E
0
as
C
0
I•4
.1-j...„- •-: 20
0.25m Depth
18 0.50m Depth
0.75m Depth 16
14
E 4.n
a 12 •Sn
C a
.c •
3 ; & 0 a
10 - re CJI
_ • •
8
First waterout bottom 6
4— if ....
2— •
L1111.1.1.11 LI.
..,Irrigations
°O
40
80
120
160 200 240 280 320
DAYS SINCE PLANTING
Fig. 10 Carbon dioxide partial pressures at three depths for the cotton treatment. Growth stages are also shown.
1 11 i li 1 .1. 1 1 . . 1 . . L L.,
the original soil organic matter, but reflecting the higher total organic matter content. As a contrast, the chopped alfalfa had a much more rapid Poo, production rate and level that would suggest that alfalfa was more eas-ily decomposed by soil organisms than manure. The Pco„ gradient reversal with depth of the alfalfa and manure from that of the check is due primarily to the location of the decomposing material in the surface 0.20 rn.
The barley, alfalfa, tall wheatgrass, and two Sordan treatments all produced similar Poo, patterns. The Po:),
always decreased shortly after the crops were har-vested, regardless of whether it was the killing of the plant as with the barley, or foliage removal as with the other three crops. There was
a
3 to 4 kPa rise in the Pew on the day following irrigation in the tall wheat-grass treatments, suggesting a respiration activity in-crease in excess of the CO2 diffusion and waterad-sorption from the soil air. This result would indicate a flush of growth after irrigation and may be associated with the wheatgrass tending to come out of dormancy after irrigation following a dry period. The CO2
pro-duction by the roots appeared to be associated with the rate of top growth. This event could have impli-cations on such things as soil solution pH and its effect on trace mineral solubility near the root at various stages of plant growth, particularly iron uptake by some pH sensitive grasses. Time of leaching for Na removal from soils also might well be planned for periods of vigorous plant growth to take advantage of increased lime solubility due to increased H2CO3 which lowers
the soil solution pH.
The Poo, pattern for the cotton crop changed with stages of plant development. The rapid foliage growth and the boll filling stages were accompanied by the increased soil Pc02 values. Cotton also had the lowest
Pco, values of the crops growth. The shallower depth often had the highest Poo, values, suggesting that cot-ton has a shallow root respiration pattern.
For all treatments, irrigation water applications caused short-term fluctuations while plant growth rate and ease of organic matter decomposition were the controlling factors over long time periods. The Pco, decreases following irrigation is the result of CO2
dis-solving in the water from the high CO2 soil
atmos-phere. The CO2 is approximately 30 times as soluble
as 02 and 50 times as soluble as N2 in water at 15°C. Recognizing that soil atmosphere data taken from lysimeters may not represent field soils because of tem-perature and other differences, these data provide an insight into Pop, data for the conditions considered. These data show considerable CO2 production
differ-ences by the presence of different crops, and differdiffer-ences between plant growth stages. It also gives relative value differences caused by removing the aboveground por-tions of crops.
Because of interaction between Pc02, pH, and Ca +2
activity in calcareous soils, Poo, data are necessary to adequately model Na+ and Ca2+ exchange and
leach-ing. In the past only limited Pc02 data have been
avail-able for these models and no data are availavail-able that compare different crops grown under similar condi-tions. If the differences in CO2 production by different
crops and crop management are known, it may very well be possible to select crops and management pro-grams that will enhance Na removal from the ex-change complex more efficiently than has been done in the past, especially in areas where gypsum and other applied Ca sources are not available or are too expen-sive.
REFERENCES
De Jong, E., Schappert, and K.H. MacDonald. 1974. Carbon dioxide evolution from virgin and cultivated soil as affected by management practices and climate. Can. J. Soil Sci. 54:299-307. Enoch, H., and S. Dasberg. 1971. The occurrence of high CO2
con-centrations in soil air. Geoderma 6:17-21.
Robbins, C.W. 1985. The CaCOI-0O2-1-120 system in soils. 1. Agron. Educ. 14:3-7.
, R.J. Wagenet, and J.J. Jurinak. 1980. A combined salt
trans-port-chemical equilibrium model for calcareous soils. Soil Sci. Soc. Am. J. 44:1191-1194.
, and L.S. Wil/ardson. 1980. An instrumented lysimeter sys-tem for monitoring salt and water movement. Trans. ASAE
23:109-111.
Suarez, D.L. 1982. Graphical calculation of ion concentration in calcium carbonate and/or gypsum soil solutions. J. Environ. Qual.
11:302-308.
Tanji, K.K., and L.D. Doneen. 1966. A computer technique for prediction of CaCO3 precipitation in HCO 3 salt solutions. Soil Sci. Soc. Proc. 30:53-56.