Volume 1, Issue 2, October 2012
Page 154
ABSTRACT
Data clustering is a process of putting similar data into groups. A clustering algorithm partitions a data set into several groups based on the principle of maximizing the intra-class similarity and minimizing the inter-class similarity. This paper analyze the three major clustering algorithms: K-Means, Hierarchical clustering and Density based clustering algorithm and compare the performance of these three major clustering algorithms on the aspect of correctly class wise cluster building ability of algorithm. Performance of the 3 techniques are presented and compared using a clustering tool WEKA.
Keywords: Data mining algorithms, Weka tools, K-means algorithms, Hierarchical clustering, Density based clustering algorithm etc.
1.
INTRODUCTION
Knowledge discovery process consists of an iterative sequence of steps such as data cleaning, data integration, data selection, data transformation, data mining, pattern evaluation and knowledge presentation. Data mining functionalities are characterization and discrimination, mining frequent patterns, association, correlation, classification and prediction, cluster analysis, outlier analysis and evolution analysis [1]. Three of the major data mining techniques are regression, classification and clustering. CLUSTERING is a data mining technique to group the similar data into a cluster and dissimilar data into different clusters. I am using Weka data mining tools for clustering.
2.
WEKA
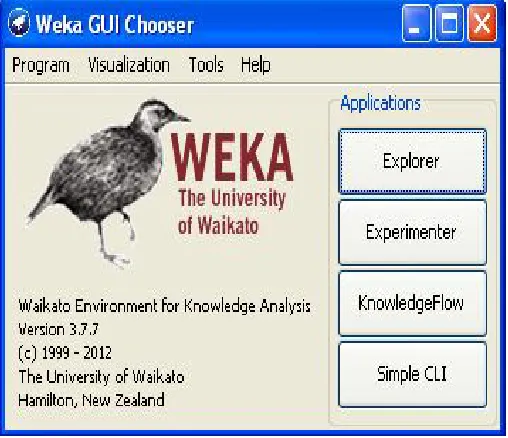
Weka is a landmark system in the history of the data mining and machine learning research communities, because it is the only toolkit that has gained such widespread adoption and survived for an extended period of time[2]. The Weka or woodhen (Gallirallus australis) is an endemic bird of New Zealand. It provides many different algorithms for data mining and machine learning. Weka is open source and freely available. It is also platform-independent.
Figure 1 View of weka tool
A Comparative Study of clustering algorithms
Using weka tools
Bharat Chaudhari1, Manan Parikh2
1,2
International Journal of Application or Innovation in Engineering & Management (IJAIEM)
Web Site: www.ijaiem.org Email: [email protected], [email protected]
Volume 1, Issue 2, October 2012
ISSN 2319 - 4847
Volume 1, Issue 2, October 2012
Page 155
The GUI Chooser consists of four buttons:
Explorer: An environment for exploring data with WEKA.
Experimenter: An environment for performing experiments and conducting statistical tests between learning schemes.
Knowledge Flow: This environment supports essentially the same functions as the Explorer but with a drag-and-drop interface. One advantage is that it supports incremental learning.
Simple CLI: Provides a simple command-line interface that allows direct execution of WEKA commands for operating systems that do not provide their own command line interface.
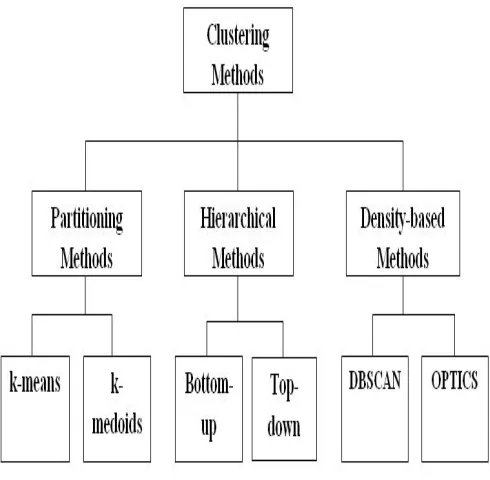
Figure 2 Clustering Algorithms
3.
CLUSTERING ALGORITHMS AND TECHNIQUES
Many algorithms exist for clustering. Following figures showing three major clustering methods and their approach for clustering.
3.1 K-means Clustering
The term "k-means" was first used by James MacQueen in 1967 [3], though the idea goes back to 1957 [4]. The standard algorithm was first proposed by Stuart Lloyd in 1957 as a technique for pulse-code modulation, though it wasn't published until 1982. K-means is a widely used partitional clustering method in the industries. The K-means algorithm is the most commonly used partitional clustering algorithm because it can be easily implemented and is the most efficient one in terms of the execution time.
Here’s how the algorithm works [5]:
K-Means Algorithm: The algorithm for partitioning, where each cluster’s center is represented by mean value of objects in the cluster.
Input: k: the number of clusters. D: a data set containing n objects.
Output: A set of k clusters.
Method:
1. Arbitrarily choose k objects from D as the initial cluster centers. 2. Repeat.
3. (re)assign each object to the cluster to which the object is most similar using Eq. 1, based on the mean value of the objects in the cluster.
Volume 1, Issue 2, October 2012
Page 156
Figure 3 Result of K-means Clustering
This figure show that the result of k-means clustring Methods using WEKA tool. After that we saved the result, the result will be saved in the ARFF file formate. We also open this file in the ms exel.
3.2 Hierarchical clustering
HIERARCHICAL CLUSTERING builds a cluster hierarchy or, in other words, a tree of clusters, also known as a dendrogram[6].
Agglomerative (bottom up)
1. Start with 1 point (singleton).
2. Recursively add two or more appropriate clusters. 3. Stop when k number of clusters is achieved.
Divisive (top down)
1. Start with a big cluster.
2. Recursively divides into smaller clusters. 3. Stop when k number of clusters is achieved.
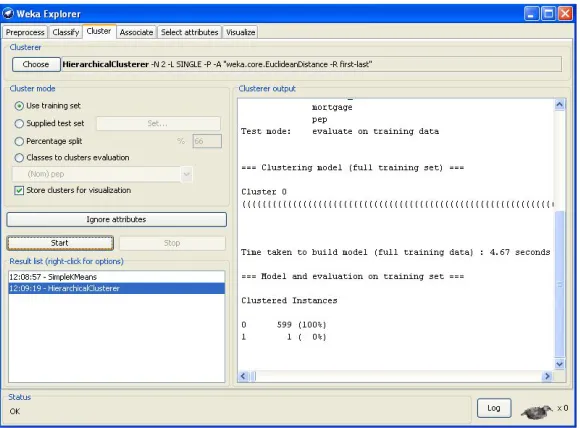
Figure 4 Result of Hierarchical Clustering
International Journal of Application or Innovation in Engineering & Management (IJAIEM)
Web Site: www.ijaiem.org Email: [email protected], [email protected]
Volume 1, Issue 2, October 2012
ISSN 2319 - 4847
Volume 1, Issue 2, October 2012
Page 157
3.3 Density based clustering
Density-based clustering algorithms try to find clusters based on density of data points in a region. The key idea of density-based clustering is that for each instance of a cluster the neighborhood of a given radius (Eps) has to contain at least a minimum number of instances (MinPts). One of the most well known density-based clustering algorithms is the DBSCAN [7].
DBSCAN separates data points into three classes:
Core points: These are points that are at the interior of a cluster.
Border points: A border point is a point that is not a core point, but it falls within the neighborhood of a core point.
Noise points: A noise point is any point that is not a core point or a border point.
To find a cluster, DBSCAN starts with an arbitrary instance (p) in data set (D) and retrieves all instances of D with respect to Eps and Min Pts. The algorithm makes use of a spatial data structure(R*tree) to locate points within Eps distance from the core points of the clusters [8]. Another density based algorithm OPTICS is introduced in [9], which is an interactive clustering algorithm, works by creating an ordering of the data set representing its density-based clustering structure.
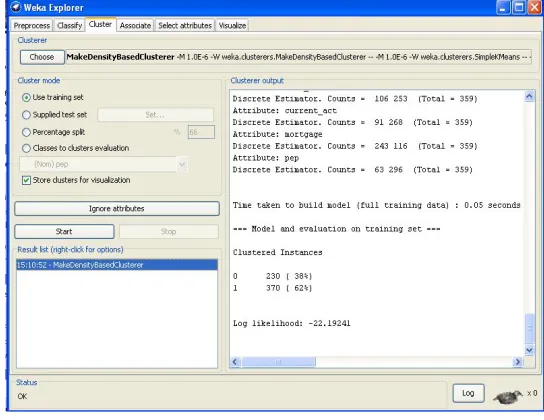
Figure 5 Result of Density based Clustering. Above figure showing the result of density-based clustering methods using WEKA tool.
4.
COMPARISON
Above section involves the study of each of the three techniques introduced previously using Weka Clustering Tool on a set of banking data consists of 11 attributes and 600 entries [10]. Clustering of the data set is done with each of the clustering algorithm using Weka tool and the results are:
Table 2 Comparison result of algorithms using weka tool
Name No. of clusters Cluster Instances No. of Iterations Within clusters sum of squared errors Time taken to build model Log likelihood Uncluste red Instances K-Means 2 0: 247(41%)
1: 353(59%)
3 1737.279199193 316 0.23 seconds 0 Hierarchic al clustering
2 0: 599(100%) 1: 1 (0%)
4.67 seconds 0 density-based clustering
2 0:230 (38%) 1:370 (62%)
0.05 seconds
Volume 1, Issue 2, October 2012
Page 158
5.
CONCLUSION
After analyzing the results of testing the algorithms we can obtain the following conclusions:
The performance of K-Means algorithm is better than Hierarchical Clustering algorithm.
All the algorithms have some ambiguity in some (noisy) data when clustered.
Density based clustering algorithm is not suitable for data with high variance in density.
K-Means algorithm is produces quality clusters when using huge dataset.
Hierarchical clustering algorithm is more sensitive for noisy data.
REFERENCES
[1]Han J. and Kamber M.: “Data Mining: Concepts and Techniques,” Morgan Kaufmann Publishers, San Francisco, 2000.
[2]Sapna Jain, M Afshar Aalam and M N Doja, “K-means clustering using weka interface”, Proceedings of the 4th National Conference; INDIACom-2010.
[3]MacQueen J. B., "Some Methods for classification and Analysis of Multivariate Observations", Proceedings of 5th Berkeley Symposium on Mathematical Statistics and Probability.University of California Press. 1967, pp. 281–297. [4]Lloyd, S. P. "Least square quantization in PCM". IEEE Transactions on Information Theory 28, 1982,pp. 129–
137.
[5]Jiawei Han and Micheline Kamber, “Data Mining: Concepts and Techniques”, Morgan Kaufmann Publishers,second Edition, (2006).
[6]Manish Verma, Mauly Srivastava, Neha Chack, Atul Kumar Diswar and Nidhi Gupta, “A Comparative Study of Various Clustering Algorithms in Data Mining”, International Journal of Engineering Research and Applications (IJERA) Vol. 2, Issue 3, May-Jun 2012, pp.1379-1384
[7]Timonthy C. Havens. “Clustering in relational data and ontologies” July 2010. [8]Xu R. Survey of clustering algorithms.IEEE Trans. Neural Networks 2005.
[9]B¨OHM, C., KAILING, K., KRIEGEL, H.-P., AND KR¨OGER, P. 2004. Density connected clustering with local subspace preferences.In Proceedings of the 4th International Conference on Data Mining (ICDM).
[10] Ian Written and Eibe Frank, “Data Mining, Practical Machine Learning Tools and Techniques”,3rd Ed., Morgan Kaufmann, 2011.
AUTHOR
Mr.Bharat Chaudhari doing ME in Department of Computer Science and Engg from Kalol Institute of Technology & Research Centre, Kalol-382721,Gujarat Technological University.published his paper titled A Comparative Study of clustering algorithms using weka tools..In this paper we are trying to compare major clustering algorithms using weka tools.