17
Aggregate Stability and Size
Dlstributlon'
W. D. KEMPER and R. C. ROSENAU
Snake River Conservation Research Center Agricultural Research Service, USDA Kimberly, Idaho
17-1 INTRODUCTION
17-1.1 Definition and General Approaches
An aggregate is a group of primary particles that cohere to each other more strongly than to other surrounding soil particles. Most adjacent particles adhere to some degree. Therefore, disintegration of the soil mass into aggregates requires imposition of a disrupting force. Stability of ag-gregates is a function of whether the cohesive forces between particles withstand the applied disruptive force.
When comparing size distribution or stability of soil aggregates, it is necessary that the disruptive force(s) be standardized. If the measure-ments are to have practical significance, forces causing disintegration should be related to forces expected in the field. The better methods to determine aggregate-size distribution have evolved as a result of efforts to standardize the disruptive forces and make them comparable to those in field phenomena.
Forces involved in aggregate size and stability studies include (i)
impact and shearing forces administered while taking and preparing the samples, (ii) abrasive and impact forces during sieving, and/or (iii) forces involved in the entry of water into the aggregate. These forces are gen-erally related to cultivation, erosion (wind and water), and wetting of soils, respectively. However, the disintegrating forces occurring during sample taking, preparation, and analysis do not duplicate the field phe-nomena. Consequently, the relationship between aggregate-size distri-bution obtained in the laboratory and that existing in the field is some-what empirical. Recognizing the empiricism involved in relating aggregate-'Contribution from the U.S. Department of Agriculture, Agricultural Research Service, Snake River Conservation Research Center, Kimberly, ID 83341.
Copyright 1986 C American Society of Agronomy-Soil Science Society of America, 677 South Segoe Road, Madison, WI 53711, USA. Methods of Soil Analysis. Part 1.Physical and Mineralogical Methods-Agronomy Monograph no. 9 (2nd Edition)
426 KEMPER & ROSENAU
size measurements to field phenomena, most investigators have decided to use stability of the aggregates rather than aggregate-size distribution as an index of soil structure in the field. The bases of these decisions have generally been (i) that a simpler procedure involving only one size fraction may be used for stability analysis, (ii) that results of stability analysis are highly correlated with aggregate-size distributions and field phenomena, and (iii) that the ability of the aggregates to resist breakdown by continuing or increasing disruptive forces is often an important factor in the phenomenon being studied.
Large pores in the soil generally favor high infiltration rates, good tilth, and adequate aeration for plant growth. Immediately after culti-vation, most soils contain an abundance of these large pores. Their con-tinued existence in the soil depends on the stability of the aggregates. Erodibility of soils decreases as aggregate stability increases.
In determining aggregate stability, known amounts of some size frac-tion of aggregates are commonly subjected to a disintegrating force de-signed to simulate some important field phenomenon. The amount of disintegration is measured by determining the portion (by weight) of the aggregates that is broken down into aggregates and primary particles smaller than some selected size. This determination is usually made by sieving or sedimentation. Since the disintegrating forces of interest range from wind erosion to slaking by water, no single type of disintegrating force can be recommended for all objectives. In the following sections, the principles underlying the development of methods for measuring aggregate stability and size distribution will be considered. Detailed de-scriptions of, or references to, methods that are reproducible and sensitive to factors important to field phenomena conclude this section.
17-1.2 Forces Involved in Aggregation
Two of the primary forces holding particles together in aggregates in moist soils are the surface tension of the air and water interface and the cohesive tension (negative pressure) in the liquid phase. Briggs (1950) has shown that the cohesive tension of water can have values up to 26 MPa. As a soil dries, the water phase recedes into capillary wedges sur-rounding particle-to-particle contacts and films between closely adjacent platelets. The interfacial tension and internal cohesive tension pull ad-jacent particles together with great force as soil dries. Soluble compounds
such as silica, carbonates, and organic molecules are concentrated in the liquid phase as the soil dries. As the capillary wedges of supersaturated soil solution retreat toward the particle-to-particle contact point, the po-tential adsorption spots which offer the lowest free energy for the solute molecules or ions are at the junctions of the adjacent particles. Many of these solute molecules and ions thus precipitate as inorganic semicrys-talline compounds or amorphous organic compounds around these par-ticle-to-particle contacts, cementing them together.
AGGREGATE STABILITY AND SIZE DISTRIBunON 427
into closer proximity, there are also more opportunities for hydrogen bonding between adjacent oxygen and hydroxyl groups and for other intermolecular, interionic, and crystalline bonds to develop. When rel-ative humidity in the soil goes down below 75%, the last molecular layer of water adsorbed on mineral surfaces begins to leave. If the relative humidity goes below 30%, the water molecules hydrated to adsorbed Ca2+ are drawn off into the gaseous phase. With the water gone, most soils still generally have great strength due to the cementation discussed above. However, this cementation is generally crystalline and brittle and once broken by mechanical force (e.g., wheel traffic on a dry earth road) does not reform unless the wetting and drying process is repeated.
17-2 PRINCIPLES
17-2.1 Dry Aggregates
17-2.1.1 DISINTEGRATION BY IMPACT AND ABRASION
Wind is a primary natural vector disintegrating dry soil. The wind itself is a relatively mild and broad-based force, which can detach only those particles that are extremely loosely held by underlying particles. However, once these loose particles are moving and can be accelerated for finite time by the wind, their kinetic energy becomes substantial and when they hit the soil surface the force per unit area of impact can be large. These impacts frequently break other particles loose from the sur-face, which in turn become missles bombarding downwind soil.
One method of controlling the geometrically intensified erosion of this type is to create a rough surface composed of large nonerodible aggregates or clods (Chepil, 1951). Then the smaller wind-moved particles are trapped in the lee of, and in the crevasses between, the clods before they knock additional particles loose from the larger units. One practical method of achieving large numbers of big clods is to cultivate dry soils with implements which gently lift, fracture, and disorient a thick dry surface layer, but do not crush and pulverize the soil.
While the resulting aggregate-size distribution is definitely a function of the cultivation method, it is also a function of soil properties. To measure differences in size distribution of dry aggregates, Chepil (Chepil
428 KEMPER & ROSENAU
found that the abrasion was reproducible and that this abradability was closely related to susceptibility of the soil to wind erosion.
17-2.1.2 EQUIPMENT DESIGNED TO APPLY DISINTEGRATING FORCES AND MEASURE RESULTS
Chepil constructed three versions of his rotary sieve (Chepil &Bisal, 1943; Chepil, 1950, 1951, 1952, 1962). Each successive version improved the performance. Lyles et al. (1970) further improved the rotary sieve and substantially improved the accuracy with which the sample is sep-arated into specific sized fractions.
Aggregate-size distribution is affected strongly by the tillage
treat-menus) to which the soil has been subjected and the procedure by which the sample was taken and prepared for sieving. Consequently, by stand-ardizing the sampling procedure, the rotary sieve can be used to obtain good measures of the effects of tillage implements on the aggregate-size distribution, which Chepil (1941) found to be a primary factor controlling wind erosion.
When tillage factors and sampling procedure are kept constant, dry sieving is a sensitive measure of soil structure differences due to amend-ment, fertilization, and cropping of soils (Chepil, 1962).
17-2.2 Wet Aggregates
17-2.2.1 WEAKENING AND DISINTEGRA nON BY WETTING
The wetting process can be highly disruptive. Ion hydration and os-motic swelling forces pull water in between clay platelets, pushing them apart and causing swelling of the aggregates in which they are incorpo-rated. If an aggregate is wetted quickly, the wetted portion can swell appreciably compared to the dry portion, causing a shear plane to ac-company the wetting front which can break many of the bonds.
Some of the bonding materials are soluble and dissolve as water enters the soil. Others are hydratable and may become weaker, but more flexible when hydrated. If soil aggregates are wetted slowly at atmospheric pres-sure or quickly under a vacuum, the bonding is still sufficiently strong to hold most of the primary particles together in aggregates.
If dry aggregates are wetted quickly at atmospheric pressure, much more disintegration and slaking occur (Panabokke &Quirk, 1957).
Lyles et al. (1974) found that more than twice as much soil was detached from large dry aggregates by raindrop impact as from aggregates which had been moistened prior to the rainfall event.
These facts, plus the observable emergence of air bubbles from quick-wetted slaking aggregates, indicate that entrapped air plays a role in their distintegration. It has been found (Kemper et al., 1985a) that when a soil sample is stored at relative humidities
<
50%, substantial amounts of O2 and N2 are absorbed on the mineral surfaces. When the sample isAGGREGATE STABIUTY AND SIZE DISTRIBUTION 429
more tightly adsorbed water molecules. This O2and N2from the adsorbed
phase join the air entrapped inside the pores and the pressure increases as capillarity pulls water into the aggregate. Finally the aggregate ruptures and the air bubble emerges.
Kemper et al. (1985b) also observed that the amount of soil eroded from a furrow was related to how quickly the soil in the furrow was wetted. Quick wetting allows the water to encompass more of the aggre-gates before the O2 and N2 have escaped from their interior.
17-2.2.2 EQUIPMENT TO APPLY DISINTEGRATING FORCES AND MEASURE RESULTS
Much of the earliest work on the stability of hydrated aggregates utilized elutriation through various sized tubes to separate the aggregates into several size groupings, the effective sizes of which were calculated according to Stokes' Law. Yoder (1936) pointed out the deficiencies of this method and mechanized and modified a wet-sieving procedure. In Yoder's procedure, a nest of six sieves was placed in a holder and sus-pended in a container of water. Fifty grams of air-dry soil was placed on the top sieve of each nest, and the nest was lowered to the point where the soil sample on the top screen was just covered with water. A motor and a mechanical arrangement lowered and raised the nest of sieves through a distance of 3.18 em at a rate of 30 cycles/min for 30 min. The amounts of soil retained on each sieve were determined by drying and weighing. Size fractions smaller than 0.1 mm in diameter were deter-mined by a procedure utilizing sedimentation, decanting, drying, and weighing. Much of the work on wet aggregate stability has utilized Yoder's method or some variation of it.
Many investigators (e.g. Kemper &Koch, 1966) have concluded that aggregate stability can be determined using a single sieve with much less investment and is essentially as well correlated with practically important field phenomena. The single sieve method also avoids the calculations (described in the next section) necessary to convert size distributions to single numbers that can be used in ranking soils and in statistical cor-relations.
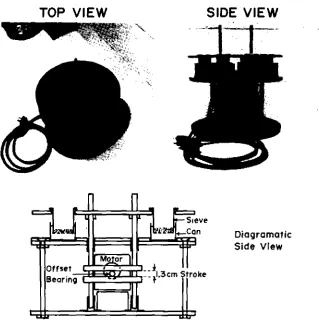
Kemper and Koch (1966) constructed a sieving machine similar to that developed by Yoder, but modified so that only one screen was used and stroke length and frequency could be varied. They also varied sieve size, sample size, aggregate size, length of sieving time, method of wetting, period of soaking prior to sieving, and other factors to optimize the reproducibility and sensitivity of the analyses.
TOP VIEW
KEMPER & ROSENAU
SIDE VIEW
Diogromofic Side VIew
ottsetI9~~~~~ __l__•.1.3em troke
Seoring T
Fig. 17-1. Wet sieving equipment. (Name of manufacturer available on request.)
length of 1.3 cm to the sieves at a freq uency of 35 cycles/min. It is designed for use with aggregates in the 1- and 2-mm diameter size range. The primary disintegrating factor applied to these aggregates is the forces involved during wetting. Much less disintegration takes place when sam-ples are wet under vacuum than when they are wet under atmospheric pressure (Kemper & Koch, 1966).
Mubarak et al. (1978) used an ultrasonic nebulization technique to produce an aerosol, which was passed over the aggregates. This wetted the aggregates slowly, resulting in little disintegration, and the stability measurement was more reproducible than when vacuum wetting was used. Their success with the procedure lead Kemper et at (1985b) to try commercially available humidifiers to produce aerosols in the chamber shown in Fig. 17-2. Vapor moves up through the aggregate samples on the screens. Samples wetted in this manner had high and reproducible stabilities when subjected to the wet-sieving process.
AGGREGATE STABILITY AND SIZE DISTRIBUTION
36mm
~n
m:L~~~~
Vapor
/;::...c=========:::!:l
from Humidifier
431
SIDE VIEW
Wetting Chamber
and Vaporizer
Diagram of Wetting Chamber (Side View) (Holds 8 Sieves)
Fig. 17-2. Equipment for vapor wetting aggregates.
tend to leave those soils nearly 100% stable. Differences between their stabilities are generally more readily detectable if they are subjected to the greater disruptive forces involved in direct immersion of dry aggre-gates at atmospheric pressure.
432 KEMPER & ROSENAU
•...
~100,.---,
~~
~90~
~----_. __...{.
__
_Io ~ .~.
~ 80
~
"C
:IE
...
•••
...
....•
....
:IE
"C
'"
....• 60
"C
-=
~
...
0
/
Fl. CoiiiOJ 100", <ullinl. d Ft. Collin. loom. .od
I
4 6
SIEVING TIME, MINUTES
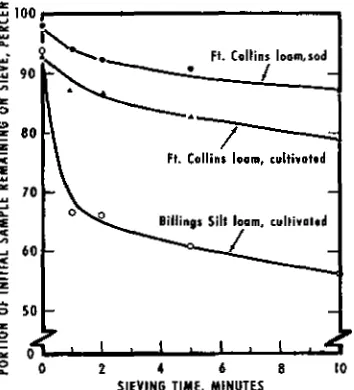
Fig. 17-3. Effect of wet sieving time on the portion of the initial sample remaining on the sieve.
:z: o ;:::
•••
o
•... 2 8 10
related to the high sediment load in initial furrow runoff, followed by
lower sustained sediment loads when runoff rate is constant.
17-2.3 Methods of Expressing the Size Distribution of Aggregates Multiple-sieve techniques give data on the amount of aggregates in each of several size groupings. To evaluate treatments or to rank soils, a single parameter to represent a soil sample is necessary. The problem then is to decide on the importance of each group to the final parameter. If equal weights of the different size groups of aggregates are of equal importance, the amounts in each of the different sizes should be added, so that making a number of separations would provide no advantage over a single separation obtained using the smallest size screen and de-termining the weight of all the aggregates retained. It is generally con-sidered, however, that a specific weight of large aggregates is more in-dicative of good structure for most agricultural purposes than is an equal weight of small aggregates. This concept is incorporated in certain math-ematical techniques for expressing aggregation data in the form of a single parameter.
17-2.3.1 MEANWEIGHT DIAMETER
AGGREGATE STABILITY AND SIZE DISTRIBUTION 433
where the summation is carried out over all n size fractions, including the one that passes through the finest sieve:
MWD =~XiWi' [IJ
i-I
The entire sample is passed through an 8-mm sieve prior to analysis. In his original definition, Van Bavel used an integration that is equivalent to a summation made over a very large number of very small increments. Van Bavel's (1949) concept of the MWD has been used widely. How-ever, its calculation in the integral form involves plotting points on a graph and determining the area enclosed. This is a time-consuming pro-cess. Youker and McGuinness (1956) suggested that the summation type calculation in the above equation be used in place of the graphical ap-proach. The summation equation shown above generally overestimates the original MWD when only five fairly broad size fractions are used. However, the correlation using five size-fractions is excellent. Because of the general shape of the curve, overestimation of the MWD from use of the summation equation is generally somewhat less if sieves with open-ings of 4.76, 2.00, 1.00, and 0.21 mm are used rather than sieves with openings of 2.00, 1.00,0.50, and 0.20 mm.
17-2.3.2 GEOMETRIC MEAN DIAMETER
Mazurak (1950) suggested that the geometric mean diameter (GMD) be used as an index of the aggregate size distribution. The geometric mean diameter is calculated approximately by the equation:
GMD = exp [1:7_1 Wilog X,/1:'/_1 w;] [2J
where Wiis the weight of aggregates in a size class with an average diameter Xi and 1:1'-1 Wiis the total weight of the sample. The use of the GMD is
supported by Gardner's (1956) finding that the aggregate size distribu tion in most soils is approximately normal rather than normal. This log-normal distribution provides the opportunity to describe the actual ag-gregate size distribution of most soils with two parameters, the geometric mean diameter and the log standard deviation (Gardner, 1956). If data are summarized in the form of these two parameters, the MWD and other aggregate size indexes may be calculated from these parameters. The main disadvantage of expressing data in terms of GMD and log standard deviation is the extensive work involved in obtaining them. The log standard deviation must be obtained by either graphical or differential interpolation from the data.
17-2.3.3 OTHER PROPOSAlS
434 KEMPER & ROSENAU
diameter and standard deviation (Puri &Puri, 1939) and the coefficient of aggregation (Retzer & Russell, 1941). De Boodt et al. (1961) found that change in mean weight diameter when dry soil samples are wetted was correlated with crop yields. They obtained correlation coefficients that averaged about 0.9.
17-2.3.4 COMPARISON AND EVALUATION
Schaller and Stockinger (1953) compared five methods for expressing aggregation data on several soils. The best methods for presenting ag-gregate size distribution data seemed to be MWD or GMD and the log standard deviation. The correlation coefficient between MWD and GWD was about 0.9. The GMD and the log standard deviation give a more complete description of the size distribution than the MWD. However, the MWD is easier to calculate and easier for most individuals to visu-alize. Both the MWD and GMD can be used to represent aggregate size distri bution for statistical analysis. Stirk (1958) maintains that the reli-ability of a mean is questionable if the aggregate distributions are ex-tremely skewed. Consequently, he favors the use of a GMD and a log standard deviation on basic considerations. However, he points out that use of these parameters may complicate the calculations to a point beyond that which is most efficient for interpreting individual experiments.
17-3 METHODS
17-3.1 Dry Aggregates: Equipment and Procedure for Determining Size Distribution and Resistance to Abrasion
The rotary sieve, developed by Chepil (1962) and improved by Lyles et al, (1970), is recommended. Some advantages of the rotary sieve are
(i) it is the most consistent dry-sieving method thus far devised, (ii) it is not subject to a personal factor, (iii) it gives fairly consistent results ir-respective of the size of soil sample used, (iv) it causes less breakdown of clods than the mechanical flat-sieve method, (v) it virtually eliminates clogging, and (vi) it is well suited to resieving soil any number of times to determine the relative resistance of the soil to breakdown by me-chanical forces.
Limitations are that the cost of a rotary sieve is appreciable and experienced manufacturers are difficult to find. (One manufacturer which has experience and is willing to produce these machines on order is "Five Star Cablegation and Scientific Supply," 303 Lake Street, Kimberly, ID 83341.) The number and size of the sieves used influences the amount of aggregate breakdown. Therefore, it is necessary to have the same sizes and number of sieves in all comparable tests.
AGGREGATE STABIUTY AND SIZE DISTRIBUTION 435
square-cornered spade is pushed under the sample to lift it and place it in a suitable tray. Air-drying at humidities in the general range expected in the field is recommended. Since clod structure varies with depth, the same depth of sampling must be used for all results expected to be com-parable.
Since the objective of determining size distribution is generally to characterize an existing condition, crushing the soil by bagging it or by other means should be avoided. The sample is gently slid from the drying tray into the feed bin of the rotary sieve, the sieve is turned on and the various sizes of dry aggregates are caught in the pans and weighed.
Resistance of the aggregates to abrasion is determined by pouring the weighed aggregates back into the drying pan, sliding them off this pan back into the feed bin of the rotary sieve, sieving and weighing again, and determining the changes in aggregate size distribution.
For more details and cautions concerning the procedure, the reader is encouraged to consult Chepil (1962) and Lyles et al. (1970).
17-3.2 Wet Aggregates
17-3.2.1 STABILITY
17-3.2.1.1 Wetting the Sample, The primary factor governing the wet stability of aggregates is generally the method of wetting. Procedures for achieving ranges of initial water contents and rates of wetting and stabilities obtained therefrom are presented by Kemper et al. (1985a). When studying effects of other factors the method of wetting must be standardized. Vacuum wetting as proposed by Kemper and Koch (1966) or slow wetting with an aerosol produced by the equipment indicated in Fig. 17-2 provided minimum disruption and the aggregate stabilities resulting therefrom are reproducible within a few percent. If the samples are wetted slowly with vapor (taking about 30 min) to water content near their field capacities before immersion, the stability of the aggregates will be slightly higher than when they are wetted quickly under vacuum. Water content of the wetting aggregates can be monitored by obtaining the initial weight of the sample and sieve and weighing them again at appropriate intervals during the vapor wetting process. Monitoring water content in this manner and observing the time required and color changes involved allow an operator to achieve the desired range of water content by time and/or visual inspection.
17-3.2.1.2 Determining the Stability.
1. Weigh 4 g of 1- to 2-mm air-dried aggregates into sieves of the type indicated in Fig. 17-1.
2. Bring the aggregates to the desired water content as described above. 3. Place sufficient distilled water in the weighed and numbered cans to
436 KEMPER &ROSENAU
4. Place the numbered sieves in the sieve holder and lower the assembly so that each sieve and aggregates contained therein enter the corre-sponding can.
5. Start the motor and allow it to raise and lower the sieves 1.3 em, 35 times/min, for 3 min ± 5 s.
6. At the end of this time, raise the sieves out of the water and place the numbered cans (containing the particles and aggregate fragments that have broken loose from the aggregates and come through the sieves) on a tray.
7. Replace these cans with another set of numbered and weighed cans containing 100 em? of dispersing solution (containing 2 g sodium hexametaphosphate/L) for soils with pH
>
7 or 2 g NaOH/L for soils with pH <7.8. Resume and continue sieving until only sand particles are left on the sieve. If some aggregates remain stable after 5 min of sieving in the dispersing solution, stop the sieve and rub them across the screen with a rubber tipped rod until they are disintegrated.
9. Continue sieving until materials smaller than the screen openings have gone through.
10. Raise the sieves and place the numbered cans on a separate tray. These cans contain the materials from the aggregates which were stable, except for sand particles too large to get through the screen. 11. Both sets of cans are placed in aeon vection oven at 110 °C until the
water has evaporated.
12. The weight of materials in each can is then determined by weighing the can, plus contents, and subtracting the weight of the can. In the cans which were filled with dispersing solution, there will be 0.2 g of the dispersing solute along with the soil. Consequently, 0.2 g should be subtracted from the weight of the contents to obtain the soil weight. 13. The fraction stable is equal to the weight of soil obtained in the dispersing solution dishes divided by the sum of the weights obtained in the two dishes.
Dispersion of the aggregates may also be achieved using an ultrasonic probe, in which case the dispersing solution (Step 7) can be distilled water rather than the sodium salt solution, which eliminates the need for the 0.2-g correction indicated in Step 12. To facilitate insertion of the probe, the sieve is removed from the holder and inserted into its respective numbered can. Holding the probe in the water inside the sieve for 30 s at medium frequency generally disintegrates the aggregates into primary particles. The sieve and can are then replaced in the holder. After dis-persing each sample in this manner Steps 8 to 13 are followed with the appropriate modification.
AGGREGATE STABILITY AND SIZE DISTRIBUTION 437
and tubes that cause little compression are better than augers. Compres-sion is more likely to affect the results obtained with samples taken from soil that is relatively moist than from soil that is dry. Where proper care is exercised in sampling, similar results may be obtained with samples taken at any water content between the field capacity and the permanent wilting point (Kemper &Koch, 1966).
Drying the soil at high temperatures sometimes causes irreversible or slowly reversible dehydration of the bonding materials and clay par-ticles. This dehydration is particularly important in soils containing con-siderable exchangeable sodium. In such soils, oven drying may cause a transient stability of otherwise unstable aggregates. This transient stability decreases with increasing time allowed for rehydration before sieving (Kemper & Koch, 1966). The stability of samples dried at room tem-peratures does not change appreciably with time allowed for rehydration (Russell & Feng, 1947; Emerson &Grundy, 1954) as long as hydration takes more than 20 min. Apparently dehydration at room temperature is not too severe, or else it is rapidly reversible. Consequently, drying at room temperatures is suggested.
Aggregate stability increases slowly with time of storage (Kemper &
Koch, 1966). Miller and Kemper (1962) found that increases in aggregate stability occurring following the incorporation of fresh organic material into soil were detected more easily if the analyses were made within 2 weeks after the sample was dried. For these reasons it is recommended that analyses be made as soon as feasible after air-drying is completed. Since soils dried slowly develop more strength, it is recommended that for comparison purposes, all the soils be spread out in a layer
<
3 mm thick on an area where the air circulation is good, so they will dry within 24 h.The larger an aggregate is when dry, the smaller the probability that its disintegrated components will pass through a sieve of given size when it is wet. Consequently, results are more reproducible if aggregates of a limited size range are selected for the determination of stability. Aggre-gates of Ito 2 mm in diameter have been found to be best suited to the screen size and sieving speed employed in this procedure. Observations of Bryant et al. (1948) and data by Strickling (1951), Schaller and Stock-inger (1953), and Panabokke and Quirk (1957) all indicate that results from simple one- and two-sieve methods of determining aggregate sta-bility are closely correlated with results using several size ranges of ag-gregates and sieves, when expressed in terms of mean weight diameters. Consequently, a single size range of aggregates is employed in preference to more time-consuming methods such that of De Boodt et al, (1961), using several size ranges of aggregates and sieves.
Kemper and Koch (1966) found a slight tendency for aggregate sta-bility to decrease when the temperature of water used to wet and sieve the samples was increased from 20 to 30 "C. Consequently, the temper-ature of the water should be maintained within the range of 22 to 25 "C,
438 KEMPER &ROSENAU
and stability of the soils; therefore, it is suggested that the salt content of the water be low enough so that the electrical conductivity is <0.01 dS m-l «0.01 mho cm "), On the other hand, low electrolyte in the
water increases swelling pressures between particles which can lower sta-bilities of sodic soils (e.g., Shainberg et aI., 1981). The electrolyte can tent of the water should be standardized and specified when reporting aggre-gate stabilities of sodic soils (Shainberg et al., 1981).
Some soils (e.g., soils from humid areas containing large amounts of free iron oxides) may be nearly 100% stable when wet by the vacuum or slow wetting techniques and sieved gently. If differences in aggregate stability among such stable soils are to be determined, the disrupting force must be increased. Wetting dry soil by immersion at atmospheric pressure accomplishes this purpose by allowing entrapment of air within the aggregates. Sieving more violent and prolonged than described in this procedure may also provide sufficient disruption of aggregates to detect differences among highly stable soils. .
Aggregates that do not break down under a rubber-tipped rod or a jet of water from a wash bottle are referred to as concretions. They are commonly held together by CaC01, iron oxides, and so forth. They may be considered and treated in two ways:
1. Since concretions are extremely stable and will not break down under normal cultivation practices, they may be considered as sand >0.26 mm mesh. If this is done, no further treatments should be used to break them down and wash them through the sieve.
2. On the other hand, since concretions usually have some porosity and appreciable internal surface area and exchange capacity, they may be treated as stable aggregates. If they are considered in this way, they must be broken down when separating out the sand so the fine particles can pass through the sieve or be dissolved. Soaking CaC01-bonded concretions in IM HCl causes complete disintegration. Concretions bonded with organic matter and iron usually disintegrate when soaked in 0.5 M NaOH.
It is suggested that concretions be treated as stable aggregates unless the investigator has some specific reason for considering them as sand.
Reproducibility of the measurement varies with the texture of the soil. Aggregate stability measurements carefully carried out on coarse-textured soils on successive days were found to have coefficients of var-iation of 4.0% (Kemper & Koch, 1966). Under the same conditions, aggregate stability measurements on fine-textured soils had an average coefficient of variation of 1.2%.Where large numbers of samples have been handled in routine fashion, somewhat higher coefficients ofvariation have been obtained for duplicate runs on different dates. It is recom-mended that duplicate subsamples be analyzed on different dates for all analyses.
17-3.2.2 SIZE DISTRIBUTION
AGGREGATE STABILITY AND SIZE DISTRIBUTION 439
proportional to the difference between its density and the density of the fluid, and inversely proportional to the viscosityy of the fluid.
The dependency of settling velocity on particle radius can be used to separate aggregates of various equivalent sizes in the same manner that it is used to separate primary particles into various size fractions (see chapter 15 on particle-size distribution). Determination of aggregate size distribution by this method would require that aggregates have the same density. Indications are that this is about as true of aggregates as of primary particles (e.g. Chepil, 1950). Although aggregates are not spher-ical, as assumed in use of Stokes' Law, they approximate spherical shape more closely than do most clay particles.
The major limitation of sedimentation procedures is that aggregates
>
Imm in diameter settle too rapidly to be measured precisely. Yoder (1936), Kolodny & Joffe (1940), and others have used sedimentation techniques to determine the amounts of small aggregates in soils. Elec-tronic equipment is now available to make measurements more quickly (Keren, 1980).Davidson and Evans (1960) extended the sedimentation technique to measure amounts of aggregates in the larger size ranges by using a liquid (I part water to 9 parts glycerol) that had a viscosity about 140 times that of water. Settling rate was measured photometrically. The method yields reproducible results and is easily adapted to automatic recording of the type used for smaller aggregates. Stability of aggregates in glycerol-water mixtures is correlated (Davidson & Evans, 1960) with stability of aggregates in water.
17-3.2.2.1 Elutriation. Water flowing upward tends to carry aggre-gates with it. However, if the aggreaggre-gates are large enough and dense enough that their velocity of settling with respect to the water is as fast as or faster than the upward movement of the water, they will not be carried upward.
Kopecky (1914) connected a series of successively larger tubes, placed the sample in the smallest tube, and passed water upward through the series of tubes at a set volume per unit time. The upward velocity of the water was smaller in the larger tubes; hence, successively smaller equiv-alent sizes of particles remained in the successively larger tubes. Baver and Rhoades (1932) and others used elutriation to determine aggregate size distributions.
KEMPER & ROSENAU
several approximate size fractions. If care is used and good equipment is available, the separation of aggregates
<
2 mm in diameter will be fairly accurate.17-3.2.2.2 Sieving.This technique involves wetting the sample and then separating aggregates into various sizes by sieving the sample through a nest of sieves under water. Care is taken to cause as little mechanical disruption of the aggregates as possible. Tiulin (1928) and Yoder (1936) were among the early workers to use this procedure extensively.
As discussed in section 17-2.2.1, direct immersion of dry soil in water at atmospheric air pressure causes a great disruption of aggregates into smaller aggregates and primary particles. A much smaller degree of dis-ruption is caused when soils are wetted slowly under tension by passing vapor through them or by adding water under a vacuum.
The immersion wetting process is fairly comparable to wetting the soil surface by irrigation. If the purpose of the aggregate analysis is related to infiltration rates of flooded soils or the formation of soil crusts, im-mersion wetting is probably the preferred procedure. On the other hand, soils below the surface are wet more slowly under tension, and therefore are disrupted much less. Wetting the dry soils under a tension is preferred when geometry of soil particles and voids below the immediate surface is being studied. Kemper and Koch (1966) found that soils wet under tension had about the same aggregate stabilities whether the tension in the water was 50 or 1500 Pa, Aggregate stability of soils wet under a vacuum was found to be closely correlated with aggregate stability of soils wet under a tension. Since the vacuum wetting procedure produced more reproducible results and was faster, it was used to approximate disruptive forces involved in wetting soil below the soil surface.
AGGREGATE STABILITY AND SIZE DISTRIBUTION 441
If water brought to equilibrium with atmospheric air pressure is used to wet the samples in the evacuated desiccators, air begins to come out of the water as it enters the desiccators. When the water contacts the soil, the soil appears to catalyze the release of the remaining air from the water. Formation of a bubble in water in or near an aggregate causes some disruption of the particle. The degree of disruption depends on how fast the water enters the desiccator and other factors. Kemper and Koch (1966) found that the average aggregate stability increased and the re-producibility of the measurement was improved if the samples were wet by de-aerated water under vacuum.
Aggregate size distribution often is measured to gain information on the size of the aggregates as they exist in the mass of soil. This requires a wetting treatment that will cause as little disintegration as possible. Consequently, wetting by an aerosol, or under vacuum, is proposed for this purpose.
During the past 20 years, as simpler and quicker methods of wet aggregate stability (the single sieve method) and size distribution sedi-mentation techniques (e.g., as used by Keren, 1980) have come into use, the multiple sieve technique has been used less often for determining stability and size distribution of aggregates. Consequently, it will not be outlined in detail here. Investigators who wish to utilize the multiple sieve technique are referred to pages 506 to 509 of the 1965 Methods of Analysis Monograph (Kemper &Chepil, 1965) and to the original studies by Yoder (1936).
17-4 REFERENCES
Baver, L D., and H. F. Rhoades. 1932. Aggregate analysis as an aid in the study of soil structure relationships. Agron. J. 24;920-930.
Briggs, L. J. 1950. Limiting negative pressure of water. J. Appl, Phys. 21:721-722. Bryant, J. C, T. W. Bendixen~ and C S. Slater. 1948. Measurement of the water-stability
of soils. Soil Sci. 65;341--,45.
Chepil, W. S. 1941. Relation of wind erosion to the dry aggregate structure of soil. Sci. Agric. 21:488-507.
Chepil, W. S., and F. Bisai. 1943. A rotary sieve method for determining the size distribution of soil clods. Soil Sci. 56:95-100.
Chepil, W. S. 1950. Methods of estimating apparent density of discrete soil grains and aggregates. Soil Sci. 70;351-362.
Chepil, W. S. 1951. Properties of soil which influence wind erosion; III. Effect of apparent density on erodibility. Soil Sci. 71;141-153. IV. State of dry aggregate structure. Soil Sci. 72:387-401. V. Mechanical stability of structure. Soil Sci. 72:465-478.
Chepil, W. S. 19~2. Improved rotary sie~e for measuring state and stability of dry soil structure. Sod Sci. Soc. Am. Proc. 16.113-11 7.
Chepil, W. S. 1.962.~ co:mpact rotary sieve and the importance of dry sieving in physical soil analysis. Soil SCi. Soc. Am. Proc. 26:4-6.
Davidson, J. M., and D. D. Evans. 1960. Turbidimeter technique for measuring the stability of soil aggregates in a water-glycerol mixture. Soil Sci. Soc. Am. Proc. 24:75-79. De Boodt, M., L. De Leenheer, and D. Kirkham. 1961. Soil aggregate stability indexes and
crop yields. Soil Sci. 91; 138-146.
442 KEMPER & ROSENAU
Gardner, W. R. 1956. Representation of soil aggrepte-size distribution by a logarithmic-normal distribution. Soil Sci. Soc. Am. Proc. 20:151-153.
Kemper, W. D., and W. S. Chepil. 1965. Size distribution of aggregates. In C. A. Black et at (ed) Methods of soil analysis, Part I.Agronomy 9:499-510.
Kemper, W. D., and Koch, E. J. 1966. Aggregate stability of soils from the western portions of the United States and Canada. U.-S.-Dep. Agric. Tech. Bull. 1355.
Kemper, W. D., R. C. Rosenau, and S. Nelson. 1985a. Gas displacement and aggregate stability of soils. Soil Sci. Soc. Am. J. 49:25-28.
Kemper, W. D., T. J. Trout, M. J. Brown, and R. C. Rosenau. 1985b. Furrow erosion and water and soil management. Trans. Am. Soc. Agric, Eng. 28: 1564-1572.
Keren, R. 1980. Effects of titration rate, pH and drying process on cation exchange capacity reduction and aggregate size distribution of montmorillonite hydroxy-aluminum com-plexes. Soil Sci. Am. J. 44:1209-1212.
Kolodny, L.1and J. S. Joffe. 1940. The relation between moisture content and micro-aggregatlon or the degree of dispersion in soils. Soil Sci. Soc. Am. Proc. (1939) 4:7-12. Kopecky, J. 1914. Ein Beitrag zur Frage der neuen Einteilung der Komungsprodukte bei
der mechanischen Analyse. Int. Mitt. Bodenk. 4:199-202.
Lyles, L.,J. D. Dickerson, and L. A. Disrud. 1970. Modified rotary sieve for improved accuracy. Soil Sci. 109:207-210.
Lyles, L.~J. D. Dickerson, and N.F. SchmeidJer. 1974. Soil detachment from clods by rainfall: effects of wind, muJch cover and essential soil moisture. Trans. ASAE 17:697-700.
Mazurak, A. P. 1950. Effect of gaseous phase on water-stable synthetic aggregates. Soil Sci. 69: 135-148.
Miller, D. E., and W. D. Kemper. 1962. Water stability of aggregates of two soils as influ-enced by incorporation of alfalfa. Agron. J. 54:494-496.
Mubarak, A., M. G. Klages. and R. A. Olsen. 1978. An improved moistening technique for aggregate stability measurement. Soil Sci. Soc. Am. J. 42:173-174.
Panabokke, C. R., and J. P. Quirk. 1957. Effect of water content on stability of soil aggregates in water. Soil Sci. 83:185-195.
Purl, A.N.,and B. R. Purl. 1939. Physical characteristics of soils: II. Expressing mechanical analysis and state of aggregation of soils by single values. Soil Sci. 47:77-86.
Retzer, 1. L., and M. B. Russell. 1941. Differences in the aggregation of a Prairie and a Gray-Brown Podzolic soil. Soil Sci. 52:47-58.
Russell, M ..B.,and C. L. Feng. 1947. Characterization of the stability of soil aggregates. Soil Sci. 63:299-304.
Schaller, F. W., and K. R. Stockinger. 1953. A comparison of five methods for expressing aggregation data. Soil Sci. Soc. Am. Proc. 17:310-313.
Sbainberg, I., J. D. Rhoades, and R. J. Prather. 1981. Effect oflow electrolyte concentration on clay dispersion and hydraulic eonductivity of a sodic soil. Soil Sci. Soc. Am J. 45:273-277.
Stirk, G. B. 1958. Expression of soil aggregate distributions. Soil Sci. 86: 133-135. Strickling, E. 1951. The effect of soybeans on volume weight and water stability of soil
aggregates, soil organic matter content and crop yield. Soil Sci. Soc. Am. Proc. 15:3G-34.
Van Bavel, C. H, M.
!
949; Mean weight diameter of soil aggregates as a statistical index of aggregation, Soli SCI. Soc. Am. "Proc, 14:20-2lVan Bavel, C. H. M. 1953. Report of the committee on phXsical analyses 1951-1953, Soil Science Society of America. Soil Sci. Soc. Am. Proc. 17:416-418.
Yoder, R. E. 1936. A direct method of aggregate analysis of soils and a study of the physical nature of erosion losses. J. Am. Soc. Agron. 28:337-351.