764
Copyright © 2011-15. Vandana Publications. All Rights Reserved.
Volume-5, Issue-3, June-2015
International Journal of Engineering and Management Research
Page Number: 764-774
Level of Stress and Factors Affecting the Stress among Employees
of Call Centres in India
Avtar Singh1 and Navdeep Jain2
1,2
Research Scholars, Department of Management and Humanities, Sant Longowal Institute of Engineering and Technology, Longowal, INDIA
ABSTRACT
The study found that high level employees do not feel much stressed due to the organizational factors while stress on medium and low level employees is there to a large extent due to organizational factors. This may be due to the fact that high level employees are the part and parcel of the management itself which is responsible to develop policies, administration, supervision, job security, career growth, etc. The study further revealed that high level employees were not much stressed due to the individual factors while stress due to individual factors was found to be high on medium and low level employees. This reaffirmed that high level employees are the part and parcel of the management. Study recommends that organizational rules & regulations should be in favour of low level employees and job security should be assured to them. Organizational environment should be stress free so that work-personal conflict may be resolved.
Keywords---- Call centre, Employees, Stress, Organizational factors, Individual factors
I.
INTRODUCTION
A call centre can be defined as a work environment in which the main business is mediated by computer and telephone-based technologies that enable the efficient distribution of incoming calls (or allocation of outgoing calls) to available staff, and permit customer – employee interaction to occur simultaneously with use of display screen equipment and the instant access to, and inputting of, information (Holman, 2003).
The call centre industry faces many human resource challenges specific to their organizational structures, job characteristics and workforce demographics. As the number of call centres increases across India, so do their specific human resource issues such as low employee morale and satisfaction, and high absenteeism and turnover rates.
Many organizations have made great strides in managing the challenges inherent in call centre workforces, but common job design characteristics and constraints continue to correlate with higher levels of mental strain and stress, particularly for high risk groups of people who may be ill-suited to call centre work. As one of India’s largest employment sectors, keeping employees healthy and productive is a key issue for managers and people leaders in call centres. Understanding the drivers of these unique issues also leads to better understanding and strategies to improve work environments and increase the wellness and productivity of employees.
Actively recruiting and selecting employees who are well suited to call centre work and focusing on providing high quality, appropriate training and development opportunities has been shown to have positive impacts on both employee and organizational performance. As well, many job design factors have been shown to drive important employee well being outcomes and should be constantly evaluated and improved.
Finally, actively and routinely engaging employees in all organizational improvement initiatives is key. Regular employee involvement in surveys, focus groups and action plans for positive change can ensure that organizational strengths are capitalized and organizational challenges addressed.
Call centers are characterized by the repetitive nature of the work performed. Like key strokes and mouse use can cause repetitive strain injury and job overuse syndrome. Long periods sitting at a workstation can cause muscle fatigue and lead to neck and back aches. Such physical discomfort may not impact on an employee’s mental stress level, but it will certainly not enhance an overall sense of wellbeing.
765
Copyright © 2011-15. Vandana Publications. All Rights Reserved.
motivate us to learn new techniques to master our jobs. We feel relaxed and motivated when a challenge is met. Thus, challenge is an important component for healthy and productive work. But at the same time, situation will be different when the challenge has turned into job demands that cannot be met; relaxation will be turned to exhaustion, and sense of satisfaction will be turned in to feeling of depression and can also lead to physical and emotional health problems. So stress in negative senses is the root cause of all problems like reduced root concentration rising cost, less productivity and more absenteeism and increased staff turnover.
II.
OBJECTIVES OF THE STUDY
1. To study the stress level among various status of employees in the selected call centres; and 2. To examine the factors of stress among call
centre employees.
III.
REVIEW OF LITERATURE
Gilberg (1993) observed that in the
organizational environment, stress has been implicated in the deterioration of performance efficiency by both managers and subordinates. When performance efficiency suffers the quality if the overall organizational environmental and productivity deteriorates. A deterioration of the organizational environment is accompanied by deterioration in organizational communication.
Biswas (1998) examines the effects of six life style stressors i.e. performance threat, boredom, frustration, bereavement and physical or organizational commitment and job involvement and perceived organizational effectiveness across job levels (managers, supervisor and workers). Findings suggest that performance; threat and frustration stressors are significant predictors of organization commitment whereas none of stressors predict job involvement than supper in forces and works. Workers report significantly higher performance stress than managers and supervisors.
Ruyter (2001) found that call centers have become an important customer access channel as well as an important source of customer-related information. Frequently, call center employees experience role stress as a result of the conflicting demands of the company, supervisors, and customers. In this article, antecedents and consequences of role stress in a call center setting are examined. Specifically, we investigate which forms of empowerment and leadership styles decrease role stress and how this subsequently effects job satisfaction, organizational commitment, performance, and turnover intentions. It was found that particularly the autonomy dimension of empowerment has a role-stress-reducing effect. Interesting substantive direct positive effects of empowerment competence and leadership consideration
on job satisfaction were found. Job satisfaction was found to be conducive to job performance. Furthermore, it was found that job satisfaction reduces turnover intentions, directly and indirectly via organizational commitment.
Bakker (2003) found in his study among 477 employees working in the call centre of a Dutch telecom company (response 88%) examined the predictive validity of the job demands – resources (JD –R) model for self-reported absenteeism and turnover intentions. The central hypothesis was that job demands would be the most important predictors of absenteeism, through their relationship with health problems (i.e., exhaustion and Repetitive Strain Injury—RSI), whereas job resources would be the most important predictors of turnover intentions, through their relationship with involvement (i.e., organizational commitment and dedication). Results of a series of SEM analyses largely supported these dual processes. In the first energy-driven process, job demands (i.e., work pressure, computer problems, emotional demands, and changes in tasks) were the most important predictors of health problems, which, in turn, were related to sickness absence (duration and long-term absence). In the second motivation-driven process, job resources (i.e., social support, supervisory coaching, performance feedback and time control) were the only predictors of involvement, which, in turn, was related to turnover intentions. Additionally, job resources had a weak negative relationship with health problems, and health problems positively influenced turnover intentions. The application of the JD –R model as a human resource management tool in call centres as well as in other organizations is discussed.
Holman D J (2003) noted that
during the 1990s, a major restructuring of work was begi nning to take place. Organizations dramatically downsiz ed, delayered, flattened and rightsized. The result was re dundancy, constant restructuring, and substantial organiz ational changes. Modern workers now find themselves i n smaller organizations, with fewer people doing more a nd feeling much less secure. New technology has added the burden of information overload and accelerated the p ace of work.
766
Copyright © 2011-15. Vandana Publications. All Rights Reserved.
interest to those responsible for health and safety although it does not deal with physical safety issues. It notes that some aspects of stress, which is dealt with, can impact on safety. It details current European legislation that is relevant to call centre operation and reports on some voluntary initiatives in the area. Recommendations in the present document are limited to real time voice based services although the implications of changing technology are noted.
Latha and Panchanatham (2010) The Business Process Outsourcing (BPO) sector is one of the fastest growing sectors in the global scenario. The sector is showing a remarkable growth in the Indian context also. It is performing a number of activities relating to customer interaction and service. Some of them are involved in pure back office work and some others are directly dealing with the customers. Call center is a voice based part of BPO organization. The BPO sector is developing the young generation not only by providing employment opportunities but also by building confidence in them. Indian BPO companies are paying great attention in inducting and training the employees. But most of the employees are youngsters and they are facing a lot of problems. They are working on continuous night shifts, which affect their biological balance. Apart from this, excessive work loads, unreachable targets and pressurizing customers are creating stress among the employees. This ultimately results in physical, psychological and behavioural deviations among them, which not only affects the employees and the organization, but, the country on the whole. This paper aims to identify the problems in the sector and the nature of the stress created by such problems. First hand information regarding the problems, the sources of stress and the experience on stress situations is collected from a project leader who has five years of experience. A questionnaire is circulated to measure the stress level of employees. It also identifies the various stressors prevailing among the
employees. The impact of job satisfaction, feed back, working conditions, work family balance and workload in creating stress among the employees are analyzed.
IV.
RESEARCH METHODOLOGY
The sample of the study was based on stratified random sampling technique. The locale of the study is National Capital Region (NCR). Therefore, being a large region, it was planned to select at least 500 call centre employees. Finally, the sample of the study became 631. The employees covered high, medium and low level of employees. Primary data from the sampled employees were collected on a specially structured pre-tested questionnaire through personal interview method. The data were analyzed by applying simple as well as advance statistical techniques. Simple techniques like averages, frequencies, percentages and advance techniques like Analysis of Variance, Factor analysis through Principal Component Technique and chi-square test were applied.
V.
RESULTS AND DISCUSSION
The results obtained by analyzing the data are elaborated and discussed in this section. The results contain level of stress among various status of employees of call centres and organizational as well as individual factors of stress as viewed by the employees.
VI.
LEVEL OF STRESS
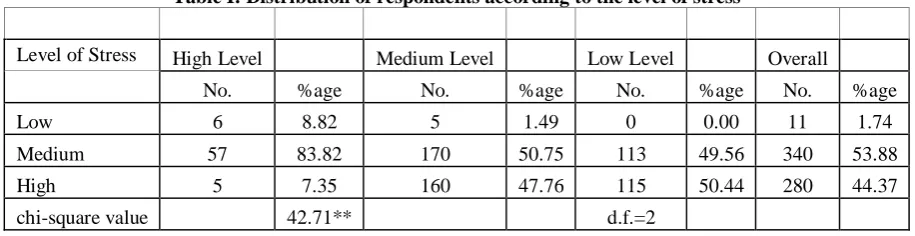
The distribution of respondents according to the level of stress is given in Table 1. It is evident from the Table that there were 1.74 percent of the total call centre employees who were at low level of stress, while 53.88 percent were at medium level of stress and the remaining 44.37 percent were at high level of stress.
Table I: Distribution of respondents according to the level of stress
Level of Stress High Level Medium Level Low Level Overall
No. %age No. %age No. %age No. %age
Low 6 8.82 5 1.49 0 0.00 11 1.74
Medium 57 83.82 170 50.75 113 49.56 340 53.88
High 5 7.35 160 47.76 115 50.44 280 44.37
767
Copyright © 2011-15. Vandana Publications. All Rights Reserved.
Though highest proportion of employees in all the categories were at medium level of stress, but the proportion of employees at high level declined significantly with the lowering of the status of employees. The employees at high stress were 7.35 percent among high level employees, while this figure came to be 47.76 among medium level employees and 50.44 among low level employees. The level of stress significantly showed inverse relationship with the level of employees as indicated by the chi-square value of 42.71.
This revealed that high level employees enjoy better working conditions as compared to that in case of medium and low level employees. This may be due to
the fact that high level employees are partially a part of the management.
VII.
ORGANIZATIONAL FACTORS
OF STRESS
The respondents were asked to register their level of agreement on various organizational factors of stress in terms of ‘strongly agree’, ‘agree’, can’t say’, ‘disagree’ and ‘strongly disagree’. These responses were assigned weights in the respective order of 5, 4, 3, 2 and 1. The weighted mean scores of different statements were worked out and compared between three categories of respondents with the help of Analysis of Variance. The results so obtained have been presented in Table 2.
The list of these factors is as under: S.No. Factors
1 Unfavourable organisational policy and administration. 2 Excess & undue supervision.
3 Non-Cordial relationship with superiors. 4 Non-Cordial relationship with peers. 5 Non-Cordial relationship with subordinates.
6 Non-Remunerative job.
7 No Job security.
8 Ultra and imposed discipline. 9 Long and unfixed working hours.
10 Monotonous activities at work to perform. 11 Often feel unimportant in the team. 12 No recognition of good work.
13 Lack of opportunities for career growth. 14 Tight schedule for completing various tasks. 15 Multifarious responsibilities for the employee. 16 Lesser social security measures.
17 Lack of accessibility to important information required for completing various assignments. 18 Lack of mentoring.
768
Copyright © 2011-15. Vandana Publications. All Rights Reserved.
The analysis given in Table 2 showed that among high level employees, the extent of agreement as ‘agree’ was 3.91was on F7, followed by 3.78 on F6 and
3.63 on F13. The neutral or can’t say position was taken on F9 (3.22), F12 (2.93), F16 (2.75), F20 (2.69), F10 (2.65, F8 (2.54), F11 (2.53) and F14 (2.50).
Table II: Extent of agreement on organizational factors of stress among call centre employees
Organizational Factors High Level Medium Level Low Level Overall F-ratio
Mean SD Mean SD Mean SD Mean SD
1 2.31 1.26 3.39 1.26 3.53 1.32 3.32 1.33 4.11*
2 2.40 1.26 3.46 2.58 3.52 1.12 3.37 2.07 3.59*
3 2.35 1.05 2.42 1.04 2.59 1.10 2.48 1.07 1.16
4 2.18 0.99 2.42 1.54 2.44 1.03 2.40 1.33 1.23
5 2.22 0.86 2.52 1.47 2.46 1.08 2.46 1.29 1.34
6 3.78 0.69 2.97 1.18 2.99 1.23 3.07 1.18 5.21**
7 3.91 0.79 3.61 1.06 3.52 1.06 3.61 1.04 2.45
8 2.54 1.14 3.70 1.00 3.80 0.90 3.61 1.05 6.14**
9 3.22 1.01 3.84 0.97 3.83 0.95 3.77 0.99 3.45*
10 2.65 1.06 3.73 0.96 3.71 0.94 3.61 1.02 5.58**
11 2.53 0.92 3.01 1.20 3.06 1.14 2.98 1.16 3.17*
12 2.93 1.06 3.04 1.17 3.19 1.19 3.09 1.16 1.63
13 3.63 0.90 3.52 1.17 3.70 1.04 3.60 1.10 1.26
14 2.50 1.22 3.74 1.04 3.85 0.97 3.64 1.11 7.29**
15 2.47 1.10 3.73 0.99 3.72 0.95 3.59 1.06 5.34**
16 2.75 1.01 3.02 1.13 3.17 1.13 3.05 1.12 2.19
17 2.44 0.98 3.06 1.18 3.10 1.17 3.01 1.17 3.18*
18 2.37 0.96 3.05 1.16 3.13 1.24 3.00 1.20 6.21**
19 2.46 1.16 3.72 0.99 3.80 0.95 3.61 1.07 5.89**
20 2.69 0.95 3.21 1.09 3.29 1.17 3.18 1.12 3.37*
Overall 2.72 0.66 3.26 0.59 3.32 0.54 3.22 0.61 5.44**
The respondents disagreed on the remaining factors of stress. These factors included F15 (2.47), F19 (2.46), F17 (2.44), F2 (2.40), F18 (2.37), F3 (2.35), F1 (2.31), F5 (2.22) and F4 (2.18).
Among medium level employees, the agreeable position was found to be on F9 (3.84), followed by F14 (3.74), F15 (3.73), F10 (3.73), F19 (3.72), F8 (3.70), F7 (3.61) and F13 (3.52). The neutral or can’t say position was found to be on F2 (3.46), F1 (3.39), F20 (3.21), F17 (3.06), F18 (3.05), F12 (3.04, F16 (3.02), F11 (3.61), F6 (2.97) and F5 92.52). The respondents disagreed on S3 and S4 (both 2.42).
Among low level employees, the respondents agreed on S14 (3.85), F9 (3.83), F8 (3.80), F19 (3.80), F15 (3.72), F10 93.71), F13 (3.70), F1 (3.53) and F7 and F2 (both 3.52). The respondents could not express their position on S20 (3.29), S12 (3.19), S16 (3.17), S18
(3.13), S17 (3.10), F11 (3.06), FR6 (2.99) and F3 (2.59). The respondents disagreed on S5 (2.46) and S4 (2.44).
769
Copyright © 2011-15. Vandana Publications. All Rights Reserved.
compared to that among high level employees. This is confirmed by the calculated F-ratios.
The analysis revealed that high level employees do not feel much stressed due to the organizational factors while stress on medium and low level employees is there to a large extent due to organizational factors. This may be due to fact that high level employees are the part and parcel of the management itself which is responsible to develop policies, administration, supervision, job security, career growth, etc.
VIII.
INDIVIDUAL FACTORS OF
STRESS
The respondents were again asked to register their level of agreement on various individual factors of stress in terms of ‘strongly agree’, ‘agree’, can’t say’, ‘disagree’ and ‘strongly disagree’. These responses were assigned weights in the respective order of 5, 4, 3, 2 and 1. The weighted mean scores of different statements were worked out and compared between three categories of respondents with the help of Analysis of Variance. The results so obtained have been presented in Table 3.
The list of these factors is as under: S.No. Factors
1 I work under stress free state even when the deadlines are too tight. 2 I feel free in taking decision independently
3 I get nervous whenever our team is not able to achieve the targets. 4 I feel discouraged due to over/ too much supervision.
5 I never feel boredom in doing repetitive work in my job.
6 I do not feel that I have to shift my work to others whenever I am given too many jobs. 7 I never feel that I am under risk of violence and abuse from customers/service users. 8 I frequently remain absent from office due to work load.
9 I remain preoccupied with thinking about problem solving during the time when I am supposed to be relaxing. 10 I feel proud to tell people where I work.
11 I feel frequent headache during my work.
12 I experience mood swings and lack of concentration & memory due to heavy work load. 13 I have not been able to devote the proper time for me and my family.
14 I habitually use caffeine / smoking / drinking to remain energised.
15 I have not been able to make a balance between professional and personal life.
Table III: Extent of agreement on individual factors of stress among call centre employees
Individual Factors High Level Medium Level Low Level Overall F-ratio
Mean SD Mean SD Mean SD Mean SD
1 3.16 1.14 3.58 1.22 3.81 1.13 3.62 1.19 4.06*
2 3.91 0.99 3.96 0.88 3.82 1.01 3.90 0.94 1.16
3 2.40 1.13 3.81 1.00 3.93 0.90 3.70 1.08 6.28**
4 2.47 1.15 3.72 1.06 3.96 0.90 3.67 1.10 5.87**
5 3.60 1.22 3.54 1.23 2.99 0.95 3.50 1.21 3.86*
6 3.38 0.99 3.33 1.13 3.34 1.13 3.34 1.11 0.94
7 3.71 0.98 3.60 1.00 3.31 0.95 3.61 0.99 4.14*
8 1.38 0.79 2.39 1.05 2.62 1.07 2.37 1.09 4.89**
9 3.19 1.09 3.33 1.07 3.37 1.07 3.33 1.08 1.06
10 4.36 1.10 3.80 0.88 3.84 0.82 3.87 0.90 2.37
11 2.66 0.91 2.53 0.99 2.70 0.98 2.60 0.98 1.98
12 3.41 0.95 3.68 0.97 3.92 0.88 3.74 0.95 3.27*
13 3.25 1.04 3.67 0.98 3.79 0.89 3.67 0.97 3.71*
770
Copyright © 2011-15. Vandana Publications. All Rights Reserved.
15 3.28 1.06 3.52 1.03 3.70 0.89 3.56 0.99 3.26*
Overall 3.18 0.35 3.45 0.53 3.50 0.46 3.45 0.50 4.07*
The analysis given in Table 3 indicated that among high level employees, the respondents agreed to the tune of 4.36 on F10, followed by 3.91 on F2, 3.71 on F7 and 3.60 (F5). The neutral or can’t say position was taken on F14 (3.47), F12 (3.41), F6 (3.38), F7 (3.31), F15 (3.28), F13 (3.25), F9 (3.19), F1 (3.16) and F11 (2.66). The respondents disagreed on the remaining factors of stress. These factors included F4 (2.47) and F3 (2.40). However, the high level call centre employees strongly disagreed on F8 (1.38).
Among medium level employees, the agreeable position was found to be on F2 (3.96), followed by F3 (3.81), F10 (3.80), F4 (3.72), F12 (3.68), F13 (3.67), F7 (3.60), F1 (3.58), F5 (3.54) and F15 (3.52). The neutral or can’t say position was found to be on F9 (3.33), F6 (3.33), F14 (3.24) and F11 (2.53). The respondents disagreed on S8 (both 2.39).
Among low level employees, the respondents agreed on S4 (3.96), F3 (3.93), F12 (3.92), F10 (3.84), F2 (3.82), F1 (3.81), F13 (3.79) and F15 (3.70). The respondents could not express their position on S9 (3.37), S14 (3.37), S6 (3.34), S7 (3.31), S5 (2.99), S11 (2.70) and F8 (2.62). The respondents disagreed on none of the individual factors.
The extent of agreement depicted significantly inverse relationship with the level of employees. The dominance of individual factors like ‘I work under stress free state even when the deadlines are not too tight (F1)’, ‘I get nervous whenever our team is not able to achieve the targets (F3)’, ‘I feel discouraged due to over/too much supervision (F5)’, ‘ I frequently remain absent from my duty due to work load (F8)’ , I experience mood swings and lack of concentration & memory due to heavy work load (F12), ‘I have not been able to devote the proper time for me and my family (F13) and ‘I have not been able to keep balance between professional and personal life (F15) was significantly the highest among low level employees followed by medium level employees and after that among high level employees. This showed that these individual factors are
the major sources of stress among lower categories as compared to that among higher categories of employees. The factors like ‘I never feel boredom in doing repetitive work in my job (F5) and ‘I never feel that I am under risk of violence and abuse from customers/service users (F7)’ are the factors which reduce stress among high level employees. This is confirmed by the significant calculated F-ratios.
The analysis revealed that high level employees do not feel much stressed due to the individual factors while stress on medium and low level employees is there to a large extent due to individual factors. This reaffirmed that high level employees are the part and parcel of the management itself which is responsible to develop policies, administration, supervision, job security, career growth, etc.
IX.
FACTOR ANALYSIS OF
ORGANIZATIONAL AND
INDIVIDUAL FACTORS
In order to find out the content in various statements related to organizational and individual factors, factor analysis was done through Principal Component Technique of data reduction. The results of the analysis are presented in Table 4 and Table 5.
X.
ORGANIZATIONAL FACTORS
To test whether the data set are fit for factor analysis, KMO-Measure of Sampling Adequacy was worked out which came to be 0.870 (p = 0.000) as well as communalities, which ranged from 0.541 to 0.713. These coefficients indicated that the data set was fit for factor analysis. Five organizational contents were identified which are as under:
1. Disfavour able organizational rules & regulations : Contribution 28.87%
2. Time constraints : Contribution 14.29%
3. Non-cordial relationship : Contribution 7.93%
4. Undue impositions : Contribution 6.44%
5. Feeling of insecurity : Contribution 5.22%
Total Contribution : 62.75%
Table IV: Factor analysis of statements related to the organizational factors of stress
771
Copyright © 2011-15. Vandana Publications. All Rights Reserved.
1 0.794 0.029 0.147 0.101 -0.038 0.664
2 0.570 -0.042 0.005 0.240 -0.104 0.695
3 0.292 0.010 0.781 0.014 0.042 0.697
4 0.103 0.026 0.829 0.021 -0.033 0.700
5 0.154 -0.028 0.779 -0.035 0.016 0.633
6 0.620 -0.254 0.174 -0.074 0.446 0.683
7 0.091 -0.029 -0.074 0.232 0.789 0.691
8 0.160 0.330 -0.049 0.665 0.104 0.590
9 -0.076 0.100 -0.034 0.789 0.148 0.661
10 0.095 0.299 0.079 0.703 0.016 0.599
11 0.688 -0.036 0.147 0.268 0.108 0.580
12 0.656 0.030 0.255 0.127 0.212 0.558
13 0.092 0.413 0.080 0.032 0.655 0.616
14 0.052 0.768 0.062 0.280 0.156 0.699
15 0.122 0.729 -0.049 0.252 -0.006 0.612
16 0.746 0.208 0.120 -0.031 0.083 0.622
17 0.789 0.215 0.039 -0.057 0.059 0.677
18 0.793 0.220 0.130 -0.136 0.015 0.713
19 0.206 0.748 -0.015 0.126 0.017 0.619
20 0.665 0.266 0.118 -0.082 0.088 0.541
Eigen Value 5.77 2.86 1.59 1.29 1.04
% Variance 28.87 14.29 7.93 6.44 5.22
Cumulative % Variance 28.87 43.16 51.09 57.53 62.75
KMO-MSA = 0.870 Bartlett test of sphericity = 4687.24 sig=0.000
1. Unfavourable organizational rules &
regulations: It includes disfavourable
organizational policy & administration, undue supervision, non-remunerative job, no rcognition of good work, lesser social security, lack of accessibility to important information, lack of mentoring and functional conflict. 2. Time Constraint: This content includes tight schedule for completing various jobs, multifarious responsibilities and constant pressure on employees to learn new software and technology.
3. Non-cordial relationship: This factor includes non-cordial relations with superiors, non-cordial relations with peers and non-cordial relations with subordinates.
4. Undue impositions: It includes ultra and imposed discipline, long & unfixed working
hours and monotonous activities at work to perform.
5. Feeling of insecurity: This content includes no job security and lack of opportunities for career growth.
772
Copyright © 2011-15. Vandana Publications. All Rights Reserved.
XI.
INDIVIDUAL FACTORS
Table V: Factor analysis of statements related to the individual factors of stress
Statement Factor-1 Factor-2 Factor-3 Factor-4 Factor-5 Communalities
1 0.164 0.310 0.587 0.056 0.190 0.507
2 0.065 -0.019 0.808 -0.031 -0.060 0.662
3 0.041 0.326 0.237 0.047 0.694 0.649
4 0.043 0.477 0.167 0.037 0.665 0.702
5 0.817 -0.052 0.332 0.086 0.105 0.799
6 0.779 0.026 0.302 0.122 -0.051 0.717
7 0.105 0.281 0.694 0.010 0.124 0.587
8 0.190 0.132 0.102 0.696 0.388 0.698
9 0.748 0.314 -0.175 0.056 0.003 0.692
10 -0.606 0.263 0.423 -0.144 -0.117 0.638
11 0.155 0.059 -0.132 0.837 0.001 0.746
12 0.070 0.785 0.182 0.070 -0.037 0.661
13 0.017 0.715 0.064 0.016 0.167 0.543
14 -0.561 0.083 0.143 0.643 -0.126 0.772
15 0.086 0.717 0.156 0.131 0.178 0.595
Eigen Value 3.90 2.02 1.71 1.32 1.02
% Variance 25.97 13.46 11.43 8.82 6.78
Cumulative % Variance 25.97 39.43 50.86 59.68 66.46
KMO-MSA 0.758
Bartlett test of sphericity 2740.11 sig=0.000
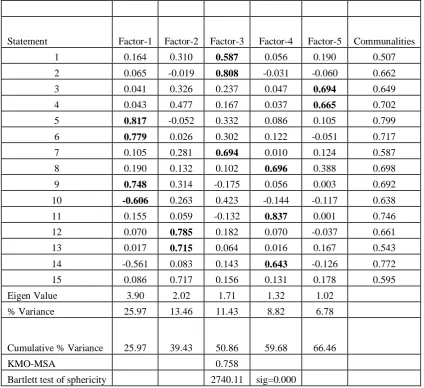
KMO-Measure of Sampling Adequacy came to be 0.758 (p = 0.000) and communalities ranged from 0.507 to 0.799. These coefficients indicated that the data set was fit for factor analysis. Five individual contents were identified which are as under:
1. Good environment-good attitude of employees : Contribution 25.97%
2. Work-personal conflict : Contribution 13.46% 3. Stress free environment
: Contribution 11.43% 4. Overwork leads to irregularities : Contribution 8.82%
5. Nervous and discouraged :
Contribution 6.78%
Total Contribution :
66.46%
1. Good environment- good attitude of the employees: This content includes never to feel boredom in doing repetitive work at office, not
to feel to have shift the work to others whenever given too many jobs, remain preoccupied with thinking about problem solving during the time when supposed to be relaxing and feeling proud to tell people where working.
2. Work-personal conflict: It includes experience of mood swings and lack of concentration & memory due to heavy work, not able to devote time for self and the family and not able to make the balance between professional and personal life.
3. Stress free environment: This factor includes work under stress free environment, feeling of freedom in taking decisions independently and never to feel under risk of violence and abuse from customers/ service users.
773
Copyright © 2011-15. Vandana Publications. All Rights Reserved.
habitually using caffeine/smoking/drinking to remain energized.
5. Nervous and discouraged: This content
includes getting nervous whenever the team is not able to achieve target and feel discouraged to tell people where working.
These are the 5 individual factors which caused variation in stress level among call centre employees. If the environment is good and stress free then there is low level of stress. When work a hurdle in personal life, overwork, habitual addiction and feeling of discourage
are there then stress level increases among call centre employees.
XII.
COMPARATIVE FACTOR
SCORING
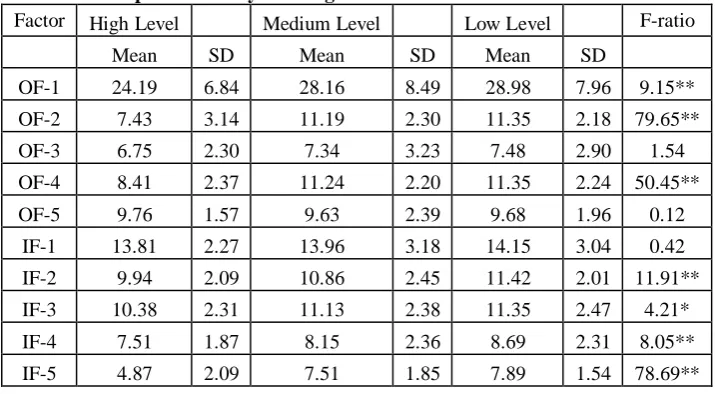
The identified 5 organizational and 5 individual factor of stress were compared between three levels of employees through ANOVA and the results are shown in Table 6.
Table VI: Comparative analysis of organizational and individual contents of stress
Factor High Level Medium Level Low Level F-ratio
Mean SD Mean SD Mean SD
OF-1 24.19 6.84 28.16 8.49 28.98 7.96 9.15**
OF-2 7.43 3.14 11.19 2.30 11.35 2.18 79.65**
OF-3 6.75 2.30 7.34 3.23 7.48 2.90 1.54
OF-4 8.41 2.37 11.24 2.20 11.35 2.24 50.45**
OF-5 9.76 1.57 9.63 2.39 9.68 1.96 0.12
IF-1 13.81 2.27 13.96 3.18 14.15 3.04 0.42
IF-2 9.94 2.09 10.86 2.45 11.42 2.01 11.91**
IF-3 10.38 2.31 11.13 2.38 11.35 2.47 4.21*
IF-4 7.51 1.87 8.15 2.36 8.69 2.31 8.05**
IF-5 4.87 2.09 7.51 1.85 7.89 1.54 78.69**
A perusal of Table 6 indicated that organizational factor-1 i.e. disfavourable organizational rules & regulations was significantly higher among medium and low level employees as compared to that among high level employees. This may be because of the high level employees being involved in formulating managerial and strategic policies in the organization. Similar was the pattern in case of organizational factor-2 and factor-4, which are ‘time constraint’ and ‘undue impositions’. There are less time constraints and undue impositions on high level employees as compared to that on medium and low level employees.
Table further revealed that individual factor 2, 3, 4 and 5 are also significantly higher among medium and low level of employees as compared to the high level employees. These factors are ‘good environment-good attitude of employees’, ‘stress free environment’, ‘overwork to irregularities’ and ‘nervous and discouraged’. This highlights that good and stress free environment leads to more satisfaction among medium and low level employees as compared to that among high level employees. Overwork and too much supervision add to higher level of frustration among medium and low level of employees as compared to the high level employees.
XIII.
CONCLUSIONS
The analysis revealed that high level employees do not feel much stressed due to the organizational factors while stress on medium and low level employees is there to a large extent due to organizational factors. This may be due to the fact that high level employees are the part and parcel of the management itself which is responsible to develop policies, administration, supervision, job security, career growth, etc.
The study revealed that high level employees were not much stressed due to the individual factors while stress due to individual factors was found to be high on medium and low level employees. This reaffirmed that high level employees are the part and parcel of the management. It is recommended that organizational rules & regulations should be in favour of low level of employees. Job security should be assured to them. The environment of the organization should be stress free so that work-personal conflict may be resolved.
REFERENCES
774
Copyright © 2011-15. Vandana Publications. All Rights Reserved.
An application of the job demands – resources model Arnold. EUROPEAN JOURNAL OF WORK AND ORGANIZATIONAL PSYCHOLOGY, 2003, 12 (4), 393–417.
[2] ETSI TR-Technical Report: Human factors (HF): Human factors of work in call centers. Volume 1.1.1, 2003-04.
[3] G. Latha and N. Panchanatham, Call center employees: Is work life stress a challenge, Sabaramuwa University Journal, Volume 9 (1), December 2010, pp 1-9.
[4] Harsiman, S. (2007) Yoga Stress Buster for Reckless BPO Cabbies, The Economic Times, Chennai,24/10/2007,pp. 8
[5] Holman, D. J. (2003). Call centres. In D. J. Holman, T. D. Wall, C. W. Glegg, P. Sparrow, & A.
[6] Howard (Eds.), The new workplace: A guide to the human impact of modern working practices. Chichester, UK: Wiley.
[7] Indradevi, R. And Kamala, P.M. (2006) Women in Indian BPO’s – Problem and stress, Management and Labour Studies, v. 31(4), pp.332-345
[8] Ko de Rutyer, Martin Wetzels and Richard Feinberg, Roll stress in call centers: Its effects on employee performance and satisfaction, Journal of Interactive Marketing, Volume 15 (2) 2001.
[9] Satish, P. (2005) “Time to manage Stress Positively”, Indian Management pp. 84-89
[10] Shailendra,S. And Arvind, K.S. (1984) Empirical Dimension of Strategies of Coping with Job Related Stress, Indian Journal Of Applied Psychology, v.24(1), pp 25-29
[11] Upinder Dhar and Ravishankar. S.,(2000), Executive Skills for Global Managers (ed.), Mumbai : Himalaya Publishing House