150
Copyright © 2011-15. Vandana Publications. All Rights Reserved.
Volume-5, Issue-2, April-2015
International Journal of Engineering and Management Research
Page Number: 150-154
Profitability Analysis of Selected Cement Industries in INDIA- An Annual
Growth Analysis
M.Ganesan1, Dr. C.Vadivel2, Dr. S.Ayyappan3, Mr. M.Sakthivadivel4 1
P .hd Research scholar ,Bharathiar university, Coimbatore, INDIA 2
Principal,Bharathiar University Arts and Science College, Modakurichi, Sivagiri, Erode, INDIA 3
Associate professor, Sakthi institute of information and management studies, Pollachi, INDIA 4
Senior Researcher, Securematrix global Pvt Ltd, INDIA
ABSTRACT
India is the world's second largest producer of cement after China, with cement companies adding nearly eight million tonnes(MT) capacity in April 2009, taking the total installed capacity to 219 MT. A few of the leading manufactures are the Ultra Tech/Grasim combine Dalmia Cements. India Cements, Holeim etc. With the boost given by the government to various infrastructure facilities, road networks and housing facilities, growth in the cement consumption is anticipated in the coming years. This article analyses the actual and trend performance of selected cement companies which are listed in BSE/NSE in India
Keywords--- million tones, Ultra Tech, Dalmia Cements.
India Cements,BSE/NSE
I.
INTRODUCTION
The cement industry is energy intensive and thus power costs form the most critical cost component in cement manufacturing, of about 35% to total cost of production. The issues here is the technology used (dry versus wet process), fuel efficiency (efficient use of coal/lignite/any other material used for burning) and power efficiency (power availability, use of alternative fuels, unit power consumption, cost and availability of captive power).The scope for cost reduction through better energy efficiency may now be limited for better performing companies since they have already reached the best feasible levels. One more characteristic of the industry comes from it being capital intensive. Since the capital intensity of a new cement project is high, access to capital has become a significant entry barrier. The cost of a new cement plant can be equivalent to about 3 years of revenue (WBCSD 2002). Cement industry was originated in India when the first plant commenced its production in the year
l9l4 in Porbander, Gujarat. The industry has since been growing at a steady pace, but in the initial stage, particularly during the pre-independence, the growth had been very slow. Since indigenous production was not sufficient to meet the entire domestic demand, the Government had to control its price and distribution statutorily.
1.1. OBJECTIVES OF THE STUDY
a).To study the actual and trend performance of selected cement industries which are listed in BSE/NSE.
1.2. SAMPLING DESIGN
The stratified random sampling method has been employed in the study, according to the prowess corporate database developed by CMIE, (Centre for Monitoring Indian Economy) there are 26 BSE and 20 NSE listed companies located in India, Out of which 10 cement companies listed in both BSE and NSE are taken for the study based on their Netsales . The selected companies are as follows.
TABLE1.1.0
TOTAL NUMBER OF CEMENT COMPANIES SELECTED FOR THE STUDY
Company Name Net Sales (Rs. cr)
20,174.94
11,357.96
9,730.30
5,590.25
4,768.47
4,597.04
3,273.57
2,911.97
151
Copyright © 2011-15. Vandana Publications. All Rights Reserved.
1.3 .REVIEW OF LITERATURE
Gangadhar (1982) in his study’s, examined some aspects of profitability in cement industries. He made comments on profitability of large public limited cement companies in India. In order to bring out fluctuations and to offer possible causes for such fluctuations. The study revealed that the profitability in cement industries, had fluctuated very widely with low rate during the period under review. The profit margin in the cement had shown declining trend where as the assets turn over showed an increasing trend.
Rajeshwari (2000) analyzed the efficiency in liquidity management of Tamil Nadu Cement Corporation Ltd., (TANCEM), Allangulam, for the period from 1993-94 to 1997-98. She has analysed the liquidity with the help of liquidity ratios and other related ratios from the annual reports of the company and concluded that the liquidity management of TANCEM was not satisfactory.
1.4. STATISTICAL TOOLS USED FOR ANALYSIS
1.Mean
2.Standard Deviation
3.Compound Annual Growth Rate
1.4.1 . Period of the Study
The period for this study covered 10 years from 2004-2005to 2013-2014 and the essential data for this period have been collected from 10 companies. The financial year runs from 1st April to 31st March every year.
1.5 COMPOUND ANNUAL GROWTH RATE
The following profitability ratios have been computed and analysed for selected BSE/NSE listed cement industries during the study period To calculate CAGR of the cement industries
1. Dividend per share 2. Net profit margin ratio 3. Gross profit margin ratio
1.DIVIDEND PER SHARE
The Table No. 1.1 implies that analysis of dividend per share of selected BSE/NSE listed cement industries during the study period. The mean dividend per share varied from companies to companies, the highest mean was 21.15 per cent in ACC Followed by RAC i.e.,
per share while RAC and SHC suffered from largest variation in dividend per share during the study period. It is also observed from the Table 1.1, that the Compound Annual Growth Rate of operating profit ratio was negative in the case of AMC, INC, RAC, JKC and JKL in the remaining companies it was positive during the study period 2004-2005 to 2013-2014.
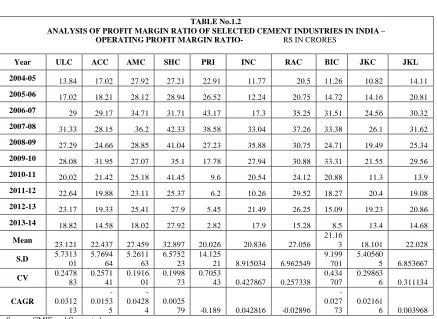
2.NETPROFIT MARGIN RATIO
The Table No. 1.2 implies that analysis of Gross Profit Margin Ratio of selected BSE/NSE listed cement industries during the study period. The mean Gross Profit Ratio has variation among companies , the highest mean was 23.807 per cent in AMC Followed by RAC i.e., 21.454 per cent, ULC 18.947 per cent , ACC 18.892 per cent during the study period.
Among the selected BSE/NSE listed cement industries AMC has lowest variation (0.297379) in operating profit ratio while PRI and INC suffered from largest variation in Gross Profit Margin Ration during the study period. It is also observed from the Table 1.2 that the Compound Annual Growth Rate of Gross Profit Margin Ratio was positive in the case of ULC, SHC, PRI, INC
and JKC For the remaining companies it was negative during the study period 2004-2005 to 2013-2014.
3. GROSS PROFIT MARGIN
The Table No. 1.3 implies that analysis of Gross Profit Margin Ratio of selected BSE/NSE listed cement industries during the study period. The mean Gross Profit Ratio has variation among companies , the highest mean was 23.807 per cent in AMC Followed by RAC i.e., 21.454 per cent, ULC 18.947 per cent , ACC 18.892 per cent during the study period.
152
Copyright © 2011-15. Vandana Publications. All Rights Reserved.
TABLE No.1.2
ANALYSIS OF PROFIT MARGIN RATIO OF SELECTED CEMENT INDUSTRIES IN INDIA – OPERATING PROFIT MARGIN RATIO- RS IN CRORES
Year ULC ACC AMC SHC PRI INC RAC BIC JKC JKL 2004-05 13.84 17.02 27.92 27.21 22.91 11.77 20.5 11.26 10.82 14.11 2005-06 17.02 18.21 28.12 28.94 26.52 12.24 20.75 14.72 14.16 20.81 2006-07 29 29.17 34.71 31.71 43.17 17.3 35.25 31.51 24.56 30.32 2007-08 31.33 28.15 36.2 42.33 38.58 33.04 37.26 33.38 26.1 31.62 2008-09 27.29 24.66 28.85 41.04 27.23 35.88 30.75 24.71 19.49 25.34 2009-10 28.08 31.95 27.07 35.1 17.78 27.94 30.88 33.31 21.55 29.56 2010-11 20.02 21.42 25.18 41.45 9.6 20.54 24.12 20.88 11.3 13.9 2011-12 22.64 19.88 23.11 25.37 6.2 10.26 29.52 18.27 20.4 19.08 2012-13 23.17 19.33 25.41 27.9 5.45 21.49 26.25 15.09 19.23 20.86 2013-14 18.82 14.58 18.02 27.92 2.82 17.9 15.28 8.5 13.4 14.68 Mean 23.121 22.437 27.459 32.897 20.026 20.836 27.056 21.163 18.101 22.028 S.D 5.731301 5.769464 5.261163 6.575223 14.12521 8.915034 6.962549 9.199701 5.405605 6.853667 CV 0.2478
83
0.2571 41
0.1916 01
0.1998 73
0.7053
43 0.427867 0.257338 0.434
707
0.29863
6 0.311134 CAGR 0.0312
13
-0.0153 5
-0.0428 4
0.0025
79 -0.189 0.042816 -0.02896 -0.027 73
0.02161
6 0.003968 Source: CMIE and Computed
TABLE No.1.1
ANALYSIS OF PROFIT MARGIN RATIO OF SELECTED CEMENT INDUSTRIES IN INDIA –DIVIDEND PER SHARE - RS IN CRORE Year ULC ACC AMC SH
C PRI INC RAC BIC JKC JKL 2004-05
0.75 7 8 3 2 2.8 10 1.5 3.2 2.1
2005-06
1.75 8 1.8 4 2.3 3.2 15 2.25 1.5 2
2006-07 4 15 3.3 5 1 2.2 25 3.5 3.5 1 2007-08
5 20 3.5 6 1 1 40 4 5 2.5
2008-09 5 20 2.2 8 1.5 2 2 4.5 3.5 4 2009-10
6 23 2.4 10 2.5 2 2 6 6 2.5
2010-11
6 30.5 2.6 13 1 2 1.25 6 2 1.25
2011-12
8 28 3.2 14 0.5 1.5 2.5 6 5 2
2012-13
153
Copyright © 2011-15. Vandana Publications. All Rights Reserved.
2013-14
9 30 3.6 20 3.7 2 1 6 3 2
Mean
5.45 21.15 3.42 10.3 1.9 2.07 10.17
5 4.675 3.92 2.185 S.D 2.8007
94 8.86958
1.7299 97
6.27 2515
1.0994 95
0.60745 4
13.08 309
1.83352 3
1.65247 3
0.81515 2 CV 0.513907 0.419365 0.505847 8982 0.60 0.578681 0.293456 1.285808 0.392197 0.421549 0.373067
CAGR 0.2820
89 0.156651
-0.0767 5
0.20 8901
0.0634
5 -0.03309 -0.205 67
0.14869
8 -0.00643
-0.00487 Source: CMIE and Computed
2004-05 10.58 15.54 25.01 19.83 18.64 -3.11 16.95 9.79 6.05 13.38 2005-06
14.9 17.32 25.44 26.12 23.56 2.43 18.06 14.13 8.87 17.45 2006-07
28.07 28.97 33.74 30.15 42.81 8.52 34.35 31.2 22.2 25.87 2007-08 27.03 23.72 36.26 42.45 34.94 26.82 32.61 30.98 23.53 26.35 2008-09 22.24 20.59 24.65 18.33 23.37 31.68 25.31 22.3 16.34 19.71 2009-10
22.56 27.68 22.87 27.54 14.61 21.89 23.9 30.74 17.38 24.19 2010-11
154
Copyright © 2011-15. Vandana Publications. All Rights Reserved.
II.
CONCLUSION
With the boost given by the government to various infrastructure profits, road networks and housing facilities, growth in the cement consumption is anticipated in the coming years and it is going to increase exponentially. The analysis also proves that all the selected companies in terms of Netprofit, gross profit and dividend per share is exponentially increasing in the annual growth perspectives.
REFERENCES
[1] Gupta, S.P., Management Accounting, Sahitya Bhawan Publications, New Delhi, 1977
[2] Hamill, Philip, A Mcilkenny, Philip, Opong, Kwaku, K A study on Directors’ Share Dealings and Company Financial Performance in the Year 2002, Journal of Management and Governance, 2002, 6(3).
[3] Indresena Reddy, P, Performance Appraisal in Public Enterprises through value added approach – A case study, the Journal of Institute of Public Enterprises, Vol.18, (3 & 4), 1996.
[4] Jyotimoy Bhattacharya, Indian Institute of Management, Kozhikode, Economic and Political Weekly, June 5, 2009.
[5] Kapadia, M.S., Public Sector’s Poor financial returns: Place for taken over units, Financial Express, No.7, 1985. [6] Khan, M.Y. and Jain P.K., Financial Management, Tata McGraw Hill Publishing Co Ltd. New Delhi, 1986.
[7] Prakash, J., Measuring the efficiency of public enterprises, the Journal of Institute of public Enterprises, April-June 1983
[8] Prasanth, V.P.,Economic and Political Weekly, October 24, 2008. Preeti Phuskele, Consulting Editor, The ICFAI, Research Centre, Pune
[9] Ramachandra Rao, K.S., Profitability of Non Financial and Non Departmental Enterprises in Public Sector, 1961-62 to 1980-81, RBI Staff Occasional Papers, 1984.
[10] Rowe. W.Glenn, Morrow, J.L. Jr., A Note on the Dimensionalisty of Firm Financial Performance Construct using Accounting, Market and subjective measures,
Financial practice
and
Education, Spring-Summer 1999 9(1)2012-13
18.48 14.41 19.6 13.1 2.1 15.51 18.93 11.08 14.82 13.61 2013-14 13.63 9.44 12.67 20.12 -0.72 11.77 6.97 4.1 8.61 8.1
Mean
18.947 18.892 23.807 22.943 16.848 13.284 21.454
18.69
6 13.979 16.767 S.D 5.8759
36
6.2392 54
7.0797 02
9.9572 26
14.642 15
11.1385
3 8.116516 9.732
758
6.25506
8 7.064442 CV 0.310125 0.330259 0.297379 0.433998 0.869073 0.838492 0.378322 0.52058 0.447462 0.42133
CAGR 0.0256 54
-0.0486
2 -0.0657
4
0.0014
53 0.0335 0.01243 -0.08503 -0.083
36
0.03591