in the population sciences published by the Max Planck Institute for Demographic Research Konrad-Zuse Str. 1, D-18057 Rostock · GERMANY www.demographic-research.org
DEMOGRAPHIC RESEARCH
VOLUME 19, ARTICLE 36, PAGES 1351-1418
PUBLISHED 29 JULY 2008
http://www.demographic-research.org/Volumes/Vol19/36/ DOI: 10.4054/DemRes.2008.19.36
Descriptive Findings
Trends in living arrangements in Europe:
Convergence or divergence?
Tineke Fokkema
Aart C. Liefbroer
© 2008 Fokkema & Liefbroer.
1 Introduction 1352
2 Substantive issues 1353
3 Method 1356
3.1 Data 1356
3.2 Living arrangements 1357
3.3 Data quality and comparability issues 1358
3.4 Analytical strategy 1362
4 Results 1363
4.1 Living with parents 1363
4.2 Living in a one-person household 1371 4.3 Living with a partner but without children 1378 4.4 Living with a partner and child(ren) 1385 4.5 Living with child(ren) but without a partner 1393 4.6 Living in an ‘other’ type of living arrangement 1400
4.7 Household size 1402
5 Summary and discussion 1408
6 Acknowledgements 1412
Trends in living arrangements in Europe:
Convergence or divergence?
Tineke Fokkema1 Aart C. Liefbroer2
Abstract
This article uses data from the Labour Force Surveys to examine trends in the living arrangements of European men and women aged 20 to 75 between 1987 and 2002. Some trends, like the decline in mean household size and the increase in living as a lone mother have occurred all across Europe. Other trends have been more pronounced or have even been limited to specific parts of Europe. In combination, it appears that the differences in living arrangements across Europe might have grown larger in the last fifteen to twenty years. Large differences in living arrangements remain along geographical divides.
1. Introduction
In the last forty years, large-scale changes in demographic behaviour have occurred across Europe. This is true for all major demographic indicators: people get fewer children and at a later age (Kohler, Billari, and Ortega 2002, Sobotka 2004, Billari et al. 2007), union formation is postponed and union dissolution has increased (Haskey 1993, Kiernan 2001, 2002), people live longer (Bongaarts 2006), and migration from outside Europe has increased (Coleman 2006). Numerous studies have discussed the consequences of these changes for the living arrangements and household types in which Europeans find themselves. Some of these studies document changes in living arrangements across the life span (Hall 1986, Keilman 1987, 2005, Kuijsten 1995, 1996), but most of them focus on specific parts of the life course, like young adulthood (Fussel and Furstenberg 2005, Elzinga and Liefbroer 2007) or older adulthood (Pampel, 1992, Wolf 1995, Palloni 2001, De Jong Gierveld, De Valk, and Blommesteijn 2002, Tomassini et al. 2004).
A major obstacle to the study of cross-national trends in living arrangements across the life course is the paucity of the available data on this issue. Ideally, one would like to use comparable information on the living arrangements of men and women of all ages, for a long series of years and for a large number of countries. However, this ideal is hardly ever reached. Definitions of living arrangements differ across countries and across time (Van Solinge and Wood 1997, Keilman 2005). Moreover, European-wide endeavours to collect data in a harmonized manner are often short-lived – for instance, the European Community Household Panel (ECHP) only ran from 1994 to 2002 –, are based on small sample sizes, or – as in the case of Censuses – are held with long intervals. As a result, existing studies are often based on combining information related to living arrangements from a series of quite different sources. For instance, Tomassini and her colleagues (2004) use data from the ECHP, the British General Household Survey, Censuses and national statistics to study living arrangements of older adults. The same method of using data from a wide variety of sources to paint the picture of changing living arrangement across the life course is observed for most other studies on this issue (e.g. Hoffmann-Nowotny 1987, Keilman 1987, Kuijsten 1995, 1996).
arrangements across Europe. Alders and Manting (2001) used the LFS to reconstruct the living arrangements of individuals in 15 European countries in 1995-1996. They used this reconstruction as a starting point in developing household scenarios for the European Union for the period 1995-2025. Although use of the LFS clearly has its limitations, its main advantages for studying trends in living arrangements are that it (a) is a survey that includes all persons living in private households, (b) has been going on in a number of countries for about twenty years, (c) includes recent data on new EU membership countries, and (d) has been harmonized by the national statistical offices and Eurostat in order to enhance comparability. Use of the LFS allows us to generate a distribution of the living arrangements in which people live by gender and five-year age groups for people between the ages of 20 and 75 in a large number of European countries between 1987 and 2002.
The main empirical question to be answered is: To what extent and in what direction have the living arrangements of individuals aged 20 to 74 changed in Europe during the period 1987-2002? Although our main aim is thus a descriptive one, we will also try to relate these trends to more general discussions within European demography, in particular to whether these changes have led to a convergence or a divergence in living arrangements across Europe. This question has already been posed in the past (cf. Kuijsten 1996), but given that our data cover more countries and a longer time-span than most other studies, we will examine to what extent our results confirm or qualify earlier conclusions about this and related issues.
The remainder of this article is structured in four sections. First, the main substantive issues in understanding changes in living arrangements in Europe will be briefly discussed. Attention will be paid to trends in living arrangements, differences in living arrangements across Europe and to age and gender differences in living arrangements. Next, the construction of our living arrangements typology will be discussed and information on data quality and on our analytical strategy will be provided. Next, results will be presented with a focus on trends between 1987 and 2002 in a selection of European countries and on the situation in 2002 in as many European countries as the data allow. Finally, the main results will be summarized and discussed against the background of the substantive issues as outlined in section 2.
2. Substantive issues
interpreted. Lesthaeghe and Van de Kaa interpret the demographic changes mentioned above as signs of the weakening of the institution of the family. This process results from changes in the economic structure that strengthened the economic independence of individuals (both men and women) and from cultural trends, in particular the process of secularization and the rise of the ideology of self-development (e.g. Inglehart 1977). As the adoption of this cultural model is occurring throughout most of the Western world (Inglehart and Baker 2000), it could be expected that changes in living arrangements in most European countries will go in the same direction. However, the timing of the onset of the SDT and the speed of its spread could be expected to depend on the rate of diffusion of this new cultural model across Europe.
Formulation of demographic change in terms of a ‘transition’ as has been done in the SDT suggests a move from one stable state to another. This aspect of the SDT has been taken to imply by many observers of the SDT that ‘in the end’ some sense of convergence in demographic behaviour – and as a result in living arrangements as well – can be expected to occur within Europe (Kuijsten 1996). Even if this ‘strong’ version of the SDT theory would be correct, convergence is only expected to be reached in the long run, and in the meantime divergence could occur as a result of differences in the onset and speed of the SDT across countries. However, the main thrust of the work on the SDT (e.g. Lesthaeghe 1995) seems to suggest a more modest or ‘light’ version of the SDT theory, in which the shift in cultural models is thought to be mediated by long-standing cultural, economic and institutional characteristics of societies. This ‘light’ version of the SDT implies that the impact of the shift towards autonomy that is expected to occur throughout the Western world might vary across societies depending on their institutional, economic and cultural characteristics. For instance, in countries with an extended welfare state, the SDT might have a much stronger impact than in countries with a marginal welfare state. Or, in countries with a strong familistic orientation, the SDT might have less impact than in countries where the role of the family has historically been less central. This ‘light’ version of the SDT implies that there might be relatively little convergence in living arrangements across Europe and that, during the transition period itself, divergence might be the dominant pattern given the cross-country differences in the onset and speed of the SDT.
divide, this time a political one, was superimposed on the earlier demographic divide. After the fall of the Communist regimes in these countries, wide-ranging demographic changes were observed, with a dramatic drop in fertility levels as the most spectacular example (Macura, Mochizuki-Sternberg, and Garcia 2002). A debate started whether these changes should be viewed as adaptation to economic shock or as an indication that the SDT has started in Eastern European counties as well (Liefbroer and Frątczak 1996, Macura, Mochizuki-Sternberg, and Garcia 2002, Sobotka, Zeman, and Kantorová 2003). Sobotka and his colleagues (2003) argued convincingly that the changes in the Czech Republic at least partially fitted the expectations of the SDT, but it remains to be seen whether the same is true for other Eastern European countries and whether it is reflected already in the living arrangements of men and women in these countries.
Compared to our knowledge on changes in demographic behaviour in Eastern Europe, we know a lot more about changes in Mediterranean countries (Castiglione and Dalla Zuanna 1994, Billari et al. 2002, Kohler, Billari, and Ortega 2002). The Mediterranean household model has at least three relatively distinctive characteristics. First, young adults leave their parents relatively late. Second, if children leave the parental home, it usually is to marry. Thus, the link between leaving home and marriage is strong and living on one’s own and unmarried cohabitation are rare. Third, childbearing is postponed, leading to very low levels of fertility in all Mediterranean countries. For instance, Kohler, Billari and Ortega (2002) reported total fertility rates of 1.28 in Greece, of 1.23 in Italy and of 1.20 in Spain. The first and third of these characteristics seem to have grown more pronounced in the last decade. The extension of the stay in the parental home has been explained by the fact that state support for young adults is marginal (Liefbroer and Puy 2005). In times of economic depression, young adults will postpone leaving home and entry into marriage until they have solidly established themselves on the labour market. The postponement of childbearing has been explained by the lack of institutional opportunities for combining motherhood and employment (McDonald 2000, Del Boca 2002). The characteristics of the Mediterranean household model suggest large differences in demographic behaviour between Mediterranean countries and countries in the North-West of Europe. It remains to be seen how these differences translate in the living arrangements of people and whether the trends in the popularity of these living arrangements differ.
a lone parent. On the other hand, the increase in life expectancy will result in more people living a longer part of their life as a couple. Few studies – see Alders and Manting (2001) for an exception – have tried to examine the consequences of demographic change for the living arrangements of people at different stages of the life course.
Finally, gender differences in living arrangements have not been given due attention. There are several differences in demographic behaviour between men and women, suggesting that their living arrangements differ as well. First, women live between 4 to 13 years longer than men, depending on the country under consideration (Meslé 2004, Gjonça et al. 2005). As a result, women will be more likely to live in a one-person household in older age than men. Second, women usually leave home, enter into a union, and have children earlier than men (Liefbroer and Goldscheider 2006), leading to higher proportions of women than men living as a couple or with children at relatively young ages and higher proportions of men than women in these living arrangements at relatively old ages. Thirdly, after divorce, children live with their mother more often than with their father (Furstenberg and Cherlin 1991, Seltzer 1991, Stewart 1999, De Graaf and Fokkema 2007), leading to higher proportions of women than men living in lone parent households. However, the overall consequences of these gender differences in demographic behaviour for the living arrangements of men and women across the life course are not well-known.
3. Method
3.1 Data
The data are drawn from the EU Labour Force Survey (LFS). This is a large-scale survey on households in the European Union that has been carried out annually and quarterly3 since 1983 in ten Member States of the European Union: Belgium, Denmark, France, Germany, Greece, Ireland, Italy, Luxembourg, the Netherlands (with the exception of 1984 and 1986), and the United Kingdom. Portugal and Spain joined in 1986, Austria, Finland, Iceland, Norway, Sweden and Switzerland in 1995, Hungary, Slovenia in 1996, Estonia, the Czech Republic, Poland and Romania in 1997, Latvia, Lithuania and Slovakia in 1998, Cyprus in 1999, Bulgaria and Malta in 2000, and Croatia in 2002.
The LFS contains nationally representative samples of private households; it does not cover those living in communal or collective households, such as in nursing homes
or homes for the elderly. It provides detailed information on employment, unemployment and other socio-economic indicators (e.g. occupation, education and vocational training) for each household member aged 15 and over. In addition, data is collected on demographic characteristics like age, sex and marital status.
The LFS is unique for its sample size and for the length of the time-series which it offers for a large number of European countries. Moreover, the degree of comparability of the LFS outcomes across countries is relatively high due to the use of the same questionnaire and definitions for all countries, the use of common classifications and a single method of recording, and the data being centrally processed by Eurostat. Despite the close coordination between the national statistical institutes and Eurostat, there inevitably remain some country differences in the survey (e.g. different order of their questionnaires and difference in sample designs). In addition, sample sizes vary considerably among the countries. Among those countries with long time-series data, Italy has the largest sample size (about 300,000 households in 2002), Luxembourg the smallest (about 4,600 households in 2002). In 2002, the sampling rates vary between 0.3% (Finland) and 5% (Luxembourg).
3.2 Living arrangements
The LFS is a household survey that includes information on the relationship between every member of the household and the reference person, usually the head of the household. Based on this information, the type of living arrangement of each member of the household can be constructed. In all, we distinguish between six types of mutually exclusive living arrangements:
• Living with parent(s)
• Living in a one-person household (living alone)
• Living as a couple
• Living as a couple with child(ren)
• Living as a lone parent
• Other
one-household. Respondent are classified as ‘living as a couple with child(ren)’ if they are living with a partner, irrespective of whether they are married or not, if one or more children are present in the household as well, and if no other kin or non-kin is present in the household. Respondents are classified as ‘living as a lone parent’ if the respondent is the head of the household and if one or more children are present in the household, but no partner, other kin or non-kin. Finally, respondents who are in another household situation are classified as ‘other’. This category includes, among others, parents who are living in the household of their children, three-generation households, respondents living with a brother or sister, and respondents joining a household with non-relatives.4
In addition to this typology of living arrangements, attention is paid to the number of people in the respondent’s household. As a result, both the type of household and the size of the household in which an individual resides will be studied.
3.3 Data quality and comparability issues
It is our contention that the LFS is a useful source to examine differentials and trends in living arrangements across Europe. However, there are clear limitations to its use as well. In general terms, three types of limitations can be distinguished:
• Limitations due to the availability and quality of data for specific countries and/or years;
• Limitations due to the sampling frames used in specific countries and/or years;
• Limitations due to the coding of information on household membership.
Below, each of these types of limitations will be discussed.
4 No attention is paid to trends in unmarried cohabitation. Rather, the category ‘living with a partner’ does not
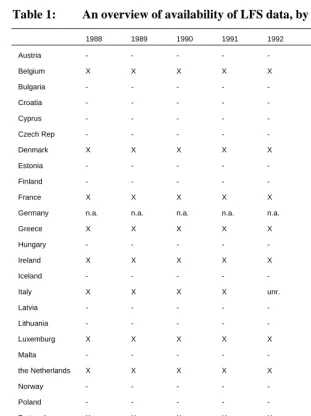
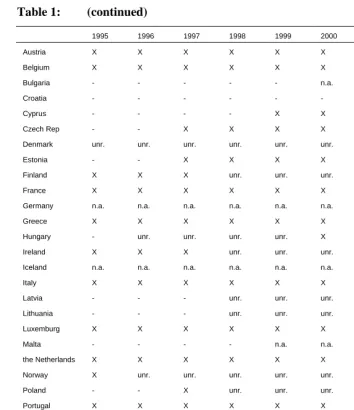
Table 1: An overview of availability of LFS data, by country and year
1988 1989 1990 1991 1992 1993 1994
Austria - - -
Belgium X X X X X X X
Bulgaria - - -
Croatia - - -
Cyprus - - -
Czech Rep - - -
Denmark X X X X X X unr.
Estonia - - -
Finland - - -
France X X X X X X X
Germany n.a. n.a. n.a. n.a. n.a. n.a. n.a.
Greece X X X X X X X
Hungary - - -
Ireland X X X X X X X
Iceland - - -
Italy X X X X unr. X X
Latvia - - -
Lithuania - - -
Luxemburg X X X X X X X
Malta - - -
the Netherlands X X X X X X X
Norway - - -
Poland - - -
Portugal X X X X X X X
Romania - - -
Slovakia - - -
Slovenia - - -
Spain X X X X X X X
Sweden - - -
Switzerland - - -
Table 1: (continued)
1995 1996 1997 1998 1999 2000 2001 2002
Austria X X X X X X X X Belgium X X X X X X X X
Bulgaria - - - n.a. n.a. n.a.
Croatia - - - n.a. Cyprus - - - - X X X X
Czech Rep - - X X X X X X
Denmark unr. unr. unr. unr. unr. unr. unr. unr.
Estonia - - X X X X X X
Finland X X X unr. unr. unr. unr. unr.
France X X X X X X X X
Germany n.a. n.a. n.a. n.a. n.a. n.a. n.a. X Greece X X X X X X X X
Hungary - unr. unr. unr. unr. X X X
Ireland X X X unr. unr. unr. unr. unr.
Iceland n.a. n.a. n.a. n.a. n.a. n.a. n.a. n.a.
Italy X X X X X X X X
Latvia - - - unr. unr. unr. X X
Lithuania - - - unr. unr. unr. unr. X
Luxemburg X X X X X X X X
Malta - - - - n.a. n.a. n.a. n.a.
the Netherlands X X X X X X X X
Norway X unr. unr. unr. unr. unr. unr. unr.
Poland - - X unr. unr. unr. X X
Portugal X X X X X X X X
Romania - - n.a. n.a. n.a. n.a. n.a. n.a.
Slovakia - - - X X X X X
Slovenia - X X unr. unr. unr. X X
Spain X X X X X X X X
Sweden unr. unr. unr. unr. unr. unr. unr. unr.
Switzerland n.a. n.a. n.a. n.a. n.a. n.a. n.a. n.a.
United Kingdom n.a. n.a. n.a. n.a. n.a. n.a. n.a. n.a.
X Data available and usable - No LFS survey conducted
n.a. Data not available at the time of the analyses
For a number of reasons only a selection of all LFS data could be used. First, LFS data were not available for all countries and/or years between 1987 and 2002. This was partly due to the fact that the LFS started at a later date in some countries, and partly due to the fact that not all data were released by Eurostat at the time that we performed our analyses. In addition, Luxembourg and Cyprus were omitted because of small sample sizes. Second, after a first inspection of the data, we decided to classify data for a number of countries and/or a number of years as ‘unreliable’. Subsequently, these data were removed from the dataset. There were two main reasons for classifying data as ‘unreliable’. In a number of countries and/or years, no information on the relationship between household members was available. In these instances, either ‘head of household’ or ‘other/unknown’ were used as categories in the dataset. An additional reason to classify data as ‘unreliable’ was if large shifts in the distribution of individuals across living arrangements in subsequent years were found. This was true, for instance for the Italian data of 1992. In Table 1, an overview is presented of the countries and years that are included in our analyses.
A second potential threat to the comparability of the LFS data is the use of different household definitions in different countries and/or the change in household definition within countries over time. In most countries and/or years the so-called ‘housekeeping unit’ definition was used. Individuals were defined as household members if they share a common dwelling and a common house keeping budget. This definition was, for instance, used in countries in Middle and Eastern Europe that joined the LFS during the 1990s and 2000s. Only in Lithuania, non-kin persons who were living in the same household were not included. In addition, countries could differ in whether or not temporary absent household members were included. In most countries, these persons were included if they were absent for less than six months or for less than a year. Unfortunately, the LFS data documentation does not allow a full reconstruction of the changes in household definitions within countries. However, visual inspection of the trends in the distribution across living arrangements within countries does not show clear breaks in the time series that could be indicative of such changes. Therefore, we expect that the consequences of differences in the definition of households between countries and across years will be relatively minor.
result, it is not possible to ascertain in all instances that the child is living with a partner. The consequence is that we decided to classify people as living with a partner (and/or children) only if no other family or non-family household members are present. If other persons are present, individuals are either classified as ‘living in the parental home’ (if a parent is head of the household) or as ‘living in an ‘other’ type of household’. Therefore, the percentage of people classified as ‘living with a partner’ and ‘living with a partner and children’ will be relatively low, whereas the percentage of people classified as ‘living with parents’ and ‘living in ‘other’ types of household’ are relatively high. This expectation is confirmed if our results are compared to 2001 Census information available from Eurostat on a number of European countries. Particularly in Southern and Eastern European countries, the percentage of young people living with a partner (and children) is lower and the percentages of people living with parents or in ‘other’ household types are higher than those based on Census information. For instance, if one compares LFS and Census data for Austria, Portugal, Spain, Italy, Greece, the Czech Republic, Slovenia, Hungary and Slovakia, the percentage of women aged 30-34 who live with a partner and children is, on average, 6 percent higher in the 2001 Census round than in the LFS. The differences are smallest for Italy (0.6%), Austria (1.7%), and the Czech Republic (2.1%), and largest for Portugal (8.0%), Slovenia (14.5%) and Slovakia (22.3%). However, given that we used the same kind of procedure to generate the household position of respondents throughout the period of observation, the effects of these differences in classification on the trends in living arrangements are assumed to be relatively minor.
3.4 Analytical strategy
For each country-year combination for which reliable data are available, a living arrangement by age table can be created, separately for each sex. Age is divided in five-year age categories, running from 20-24 five-year-old to 70-74 five-year-old. In all, such tables have been created for a total of 222 country-year combinations. Unfortunately, the presentation and interpretation of such a large amount of data is not straightforward. To facilitate interpretation, two sets of information will be presented.
for all the other countries we present data for 1987, 1992, 1997 and 2002. Data limitations do not allow the inclusion of a Scandinavian country. This is particularly unfortunate, given that many of the demographic changes that presumably resulted in changes in living arrangements originated in the Nordic countries. Therefore, we add information on Finland in 1997 – one of the few years for which information on a Nordic country is available – as a kind of benchmark. For each of these eight countries, figures with the proportion of females in a certain living arrangement, by age category are presented. This part of the analysis will allow us to compare trends in living arrangements across and within Northern and Western Europe, Southern Europe, and Eastern Europe, and to study the age-pattern of each of these living arrangements.
Secondly, we will present tabular information on the same set of living arrangements for all countries for which we have reliable information in 2002, separately for women and men. These tables will allow the examination of recent differences in the living arrangements of men and women in as many European countries as the data allow. Because our emphasis is on description of trends and cross-country differences, we do not formally test whether the patterns differ between countries or over time, but rely on visual inspection of the results only.
4. Results
4.1 Living with parents
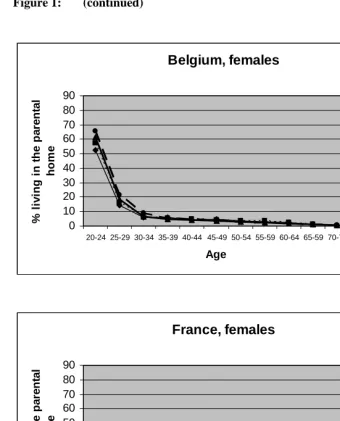
Figure 1: Percentage of females living with parents, by country, year and age Finland, females 0 10 20 30 40 50 60 70 80 90
20-24 25-29 30-34 35-39 40-44 45-49 50-54 55-59 60-64 65-59 70-74
Age % li v in g i n t h e p a re n ta l ho m e 1987 1992 1997 2002
The Netherlands, females
0 10 20 30 40 50 60 70 80 90
20-24 25-29 30-34 35-39 40-44 45-49 50-54 55-59 60-64 65-59 70-74
Figure 1: (continued) Belgium, females 0 10 20 30 40 50 60 70 80 90
20-24 25-29 30-34 35-39 40-44 45-49 50-54 55-59 60-64 65-59 70-74
Age % li v in g i n t h e p a re n ta l ho m e 1987 1992 1997 2002 France, females 0 10 20 30 40 50 60 70 80 90
20-24 25-29 30-34 35-39 40-44 45-49 50-54 55-59 60-64 65-59 70-74
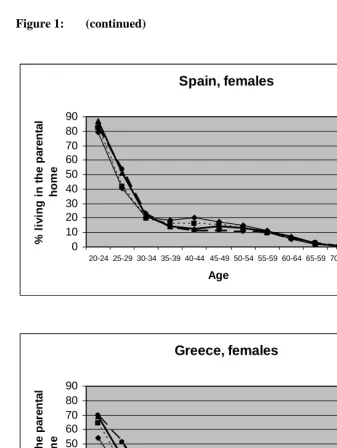
Figure 1: (continued) Spain, females 0 10 20 30 40 50 60 70 80 90
20-24 25-29 30-34 35-39 40-44 45-49 50-54 55-59 60-64 65-59 70-74
Age % li v in g i n t h e p a re n ta l ho m e 1987 1992 1997 2002 Greece, females 0 10 20 30 40 50 60 70 80 90
20-24 25-29 30-34 35-39 40-44 45-49 50-54 55-59 60-64 65-59 70-74
Figure 1: (continued)
Czech Republic, females
0 10 20 30 40 50 60 70 80 90
20-24 25-29 30-34 35-39 40-44 45-49 50-54 55-59 60-64 65-59 70-74
Age % li v in g i n t h e p a re n ta l ho m e 1997 2002 Slovenia, females 0 10 20 30 40 50 60 70 80 90
20-24 25-29 30-34 35-39 40-44 45-49 50-54 55-59 60-64 65-59 70-74
Figure 1 shows that in all countries, the percentage of women who live with their parents decreases rapidly with age. However, although the age-patterns are basically the same for all countries and all years, living with one’s parents is much more widespread in Southern and Eastern European countries than in Northern and Western Europe. For instance, in 1997 in Finland, only about 4% of women aged 25 to 29 were living with their parents. A slightly higher percentage was observed in Northern and Western European countries at that time. In the Netherlands it was 6%, in Belgium 16% and in France 12%. In Southern and Eastern European countries it was considerably higher, with 51% in Spain, 41% in Greece, 20% in the Czech Republic and 48% in Slovenia. Even more striking, the percentage of women living with their parents stays well above 10 among women in their thirties in Spain, Greece and Slovenia, suggesting a very protracted process of leaving home in these countries, compared to the pattern in Northern and Western Europe.
Table 2a: Proportion of females living with parents in 2002, by country and age category
Age
20-24 25-29 30-34 35-39 40-44 45-49 50-54 55-59 60-64 65-69 70-74 the Netherlands 43.1 6.3 1.7 0.9 0.8 0.8 0.6 0.7 0.3 0.1 0.0 Belgium 65.4 21.4 8.9 5.4 4.5 3.9 3.2 2.5 2.0 1.1 0.3 France 44.0 10.9 4.6 3.1 2.3 2.1 2.1 2.4 1.8 1.2 0.6 Germany 44.5 13.3 4.8 3.4 3.1 3.1 2.8 1.9 1.6 0.9 0.2 Austria 60.1 24.7 10.1 8.7 7.5 5.8 6.0 3.4 2.1 0.7 0.5 Portugal 74.7 45.3 21.3 13.7 12.4 11.5 10.5 8.9 5.5 2.2 0.8 Spain 82.8 53.5 22.4 13.5 11.3 11.3 10.4 10.4 5.7 2.7 0.8 Italy 85.0 53.5 23.3 11.3 7.6 6.1 4.8 3.7 2.6 0.8 0.3 Greece 69.7 51.1 25.0 14.4 10.9 10.0 8.0 5.7 2.6 1.3 0.4 Czech Republic 69.9 29.5 11.3 7.9 7.1 6.3 5.6 5.0 2.7 0.9 0.2 Slovenia 85.3 55.2 29.0 17.6 10.2 7.8 6.6 4.1 2.5 1.2 1.7 Hungary 67.9 33.1 17.9 12.8 10.8 10.4 8.3 6.9 3.9 1.4 0.6 Slovak Republic 82.3 55.6 36.3 21.5 14.8 10.1 8.9 5.3 3.2 1.2 0.3 Latvia 64.1 39.4 31.4 16.8 16.7 14.6 7.9 7.2 3.3 0.5 0.3 Lithuania 63.4 38.7 23.7 15.3 10.7 8.1 5.2 4.1 2.9 1.4 0.4
Table 2b: Proportion of males living with parents in 2002, by country and age category
Age
In Table 2a, the percentages of women living with parents for 15 countries for which data are available for 2002 are presented. In Table 2b, comparable data for men are presented. Four groups of countries can be distinguished. A first group includes France, Germany and the Netherlands. These countries are characterized by relatively low levels of living with parents at all ages. In all these countries, less than 15% of women aged 25-29 live with parents and less than 5% of women aged 30-34 do so. A second group of countries includes Belgium, Austria and the Czech Republic. These countries show higher percentages of women living with parents than the first group of countries, but these percentages are still modest compared to these in the other two groups. A third group of countries includes Hungary, Latvia and Lithuania. In these countries, sizeable proportions of women are living in the parental home until their late thirties. For instance, 17% of Latvian and 11% of Hungarian and Lithuanian women aged 35 to 39 are living with parents. The fourth and final group consists of Portugal, Spain, Italy, Greece, Slovenia and Slovakia. The age-profile from age 30 onwards of the countries in this group strongly resemble those of the Eastern European countries in the third group. The main difference is that the countries in the last group have by far the highest percentages of women in their twenties who live with their parents. For instance, in all countries except in Portugal, more than 50% of women aged 25-29 live with their parents. In Portugal, the corresponding figure is slightly lower (45%).
A comparison of the data for women and men, presented in Tables 2a and 2b, shows that men are more likely to live with their parents than women at almost all ages. In absolute terms, the differences are most pronounced during their twenties. For instance, in Greece the percentage of men who live in the parental home at ages 25 to 29 is 21% higher than the percentage for women. Although the differences are smaller in other countries, they are still very substantial. In relative terms, the gender differences are largest in the Netherlands, where 25-29 year-old males are more than three times more likely to live with parents than their female age peers. In general, relative gender differences in the percentage of people living with parents are relatively large in Northern and Western Europe and relatively small in Southern Europe.
These results on living with parents can be summarized as follows:
• Living with parents is a living arrangement that is strongly concentrated during young adulthood.
• In Northern and Western Europe, hardly any women are living with their parents after age 30. In Southern and Eastern Europe, leaving home is a much more protracted process and non-negligible proportions of women are living with their parents until well into their forties.
Eastern Europe, a strong increase in living with parents until about age 35 is observed.
• At almost all ages, men are much more likely to live with their parents than women. In absolute terms, these differences are most pronounced between age 20 and age 34.
4.2 Living in a one-person household
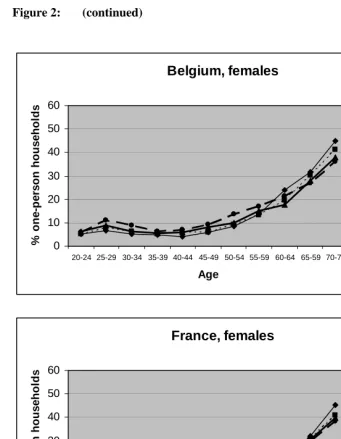
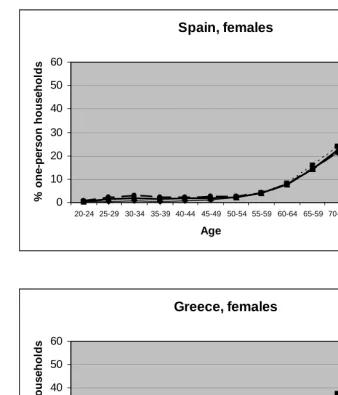
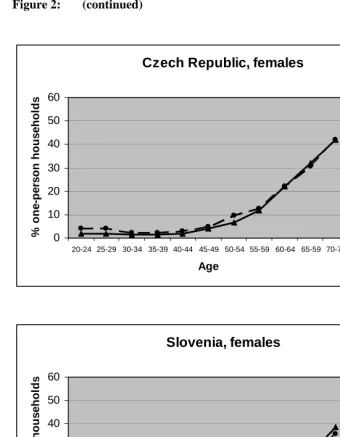
The second type of living arrangement to be discussed is living in a one-person household – hereafter also called ‘living alone’. In Figure 2 the percentage of women at different ages that live alone in 1987, 1992, 1997 and 2002 is presented for the same set of countries that were selected for Figure 1.
Figure 2: Percentage of females living in a one-person household, by country, year and age
Finland, females
0 10 20 30 40 50 60
20-24 25-29 30-34 35-39 40-44 45-49 50-54 55-59 60-64 65-59 70-74
Age
%
one
-p
e
rs
on ho
us
e
h
o
lds
1997
The Netherlands, females
0 10 20 30 40 50 60
20-24 25-29 30-34 35-39 40-44 45-49 50-54 55-59 60-64 65-59 70-74
Age
%
one
-p
e
rs
on ho
us
e
h
o
lds
1987
1992
1997
Figure 2: (continued)
Belgium, females
0 10 20 30 40 50 60
20-24 25-29 30-34 35-39 40-44 45-49 50-54 55-59 60-64 65-59 70-74
Age
%
one
-p
e
rs
on hous
e
hol
ds
1987
1992
1997 2002
France, females
0 10 20 30 40 50 60
20-24 25-29 30-34 35-39 40-44 45-49 50-54 55-59 60-64 65-59 70-74
Age
%
one
-p
e
rs
on hous
e
hol
ds
1987
1992
1997
Figure 2: (continued)
Spain, females
0 10 20 30 40 50 60
20-24 25-29 30-34 35-39 40-44 45-49 50-54 55-59 60-64 65-59 70-74
Age
%
one
-p
e
rs
on hous
e
hol
ds
1987
1992
1997 2002
Greece, females
0 10 20 30 40 50 60
20-24 25-29 30-34 35-39 40-44 45-49 50-54 55-59 60-64 65-59 70-74
Age
%
one
-p
e
rs
on hous
e
hol
ds
1987
1992
1997
Figure 2: (continued)
Czech Republic, females
0 10 20 30 40 50 60
20-24 25-29 30-34 35-39 40-44 45-49 50-54 55-59 60-64 65-59 70-74
Age
%
one
-p
e
rs
on hous
e
hol
ds
1997
2002
Slovenia, females
0 10 20 30 40 50 60
20-24 25-29 30-34 35-39 40-44 45-49 50-54 55-59 60-64 65-59 70-74
%
one
-p
e
rs
on hous
e
hol
ds
1997
Between 1987 and 2002, the percentage of women living alone rose slightly among young and middle aged women in France, Belgium and the Netherlands. For instance, the percentage of women aged 40-44 who lived alone rose between 1987 and 2002 from 4 to 7 in Belgium, from 4 to 8 in the Netherlands, and from 5 to 7 in France. Among men (results not shown), the increase in living alone during this part of the life course was even more impressive. Between 1987 and 2002, the percentage of 40 to 44 year-old men who live alone rose from 8 to 13 in Belgium and France, and from 9 to 15 in the Netherlands. The stronger increase in living alone among middle aged men than among middle aged women could be related to the fact that, if a couple with children divorces, the woman often ends up living in a lone parent family, whereas the men is more likely to end up living alone. In the Czech Republic and Slovenia, the same pattern of a slight increase in the likelihood of living alone during young and middle adulthood is visible. In Spain and Greece, however, very little change in the popularity of living alone is observed. It remains a marginal living arrangement for all women and men until their early sixties. Among the 65 to 74 year-olds, a slight decrease of living alone is visible in many countries, presumably as a result of the increase in life expectancy that causes many couples to live a longer joint life.
Table 3a: Proportion of females living in a one-person household in 2002, by country and age category
Age
20-24 25-29 30-34 35-39 40-44 45-49 50-54 55-59 60-64 65-69 70-74
the Netherlands 17.4 13.8 11.0 7.2 7.6 7.1 13.2 17.8 23.5 29.2 43.4
Belgium 5.9 11.0 8.9 6.2 6.8 9.3 13.6 17.1 21.4 26.7 35.9
France 16.9 13.8 10.0 6.9 6.5 9.2 13.5 17.5 22.3 29.8 38.2
Germany 21.0 21.2 14.2 9.8 9.0 10.7 13.2 18.4 21.6 29.7 43.7
Austria 10.1 14.0 11.7 9.2 7.7 9.6 11.6 18.9 22.2 28.0 39.0
Portugal 1.5 2.9 3.1 1.9 2.7 2.2 3.2 4.8 10.8 15.0 24.0
Spain 0.9 2.1 3.0 2.4 2.1 2.7 2.5 4.2 7.8 14.5 21.4
Italy 1.8 4.4 5.6 5.3 4.8 5.6 5.9 9.6 14.8 23.3 36.5
Greece 10.1 5.8 5.4 3.6 2.8 4.1 5.3 7.8 12.8 19.8 34.0
Czech Republic 3.9 4.1 2.1 2.1 2.8 4.9 9.5 12.6 22.2 30.5 42.0
Slovenia 1.8 4.7 4.2 4.5 3.9 4.6 6.1 11.6 22.0 25.8 35.9
Hungary 3.1 3.8 3.7 2.7 2.7 4.9 8.8 15.7 23.3 33.3 42.8
Slovak Republic 3.9 4.1 2.1 2.1 2.8 4.9 9.5 12.6 22.2 30.5 42.0
Latvia 2.7 4.4 2.1 2.8 3.4 6.1 10.6 16.5 27.1 26.3 30.3
Table 3b: Proportion of males living in a one-person household in 2002, by country and age category
Age
20-24 25-29 30-34 35-39 40-44 45-49 50-54 55-59 60-64 65-69 70-74
the Netherlands 15.9 23.0 18.8 15.1 14.9 12.5 11.9 13.3 16.0 13.7 16.9
Belgium 6.9 15.2 15.8 14.5 12.5 12.2 12.8 13.3 13.0 14.6 14.8
France 16.4 19.4 15.8 14.1 12.8 11.4 11.9 12.6 12.5 14.2 16.5
Germany 20.5 28.4 26.3 20.9 17.8 16.2 14.0 13.9 13.2 13.0 15.2
Austria 9.8 18.0 16.7 14.9 14.0 11.5 12.1 13.0 12.3 11.2 15.5
Portugal 1.2 2.8 4.2 4.4 3.9 3.4 2.5 3.0 4.5 6.1 7.8
Spain 1.0 4.0 5.3 4.7 4.5 3.9 3.8 4.6 5.7 6.2 7.4
Italy 2.1 6.0 9.2 9.9 9.3 8.1 8.1 8.0 9.6 10.7 13.3
Greece 11.7 7.3 8.1 6.8 4.9 5.2 5.7 4.3 4.2 6.4 9.5
Czech Republic 3.0 6.6 6.8 6.8 7.4 7.2 8.2 9.9 9.7 11.5 16.0
Slovenia 2.4 6.0 5.9 7.2 4.3 6.4 7.9 9.1 8.9 6.5 9.8
Hungary 3.0 5.6 6.1 5.8 5.5 6.6 9.2 8.9 10.0 10.7 14.1
Slovak Republic 0.8 2.1 2.8 2.2 2.6 3.5 5.2 5.3 7.0 12.3 15.5
Latvia 1.3 5.6 2.8 5.9 4.2 6.2 7.7 10.9 13.7 8.6 15.9
Lithuania 4.2 3.2 2.0 2.4 4.4 5.9 8.4 7.5 15.4 7.6 13.3
A comparison of the data for women and men shows an interesting difference in their age-pattern. In most countries, men are more likely to live alone than women until their late forties, but from their early fifties onwards living alone becomes more common among women than among men. This is nicely illustrated by the case of Germany. Between age 25 to 29, 28% of men and 21% of women are living on their own. Between age 65 and 69 the pattern has clearly reversed with 13% of women and 30% of men living alone. This same kind of pattern is observed in almost all countries. The relatively high percentage of men who live alone at young ages can partly be explained by the fact that men enter into a union at slightly older ages than women, whereas the higher percentages of older women who live alone are connected to the fact that women, on average, live longer than men.
These results on living in a one-person household can be summarized as follows:
• Living alone is a living arrangement that is concentrated at older ages.
• At all ages, living alone is much more common in Northern and Western Europe than in either Southern or Eastern Europe. At older ages, only slight differences are found between Southern and Eastern European countries. During young and middle adulthood, the percentage of men and women who live alone is particularly low in Southern European countries (with the partial exception of Italy).
• In Eastern and Northern and Western Europe, a slight increase in the percentage of young and middle aged persons living alone can be observed during the 1990s and early 2000s. This is particularly true among men. In Southern European countries, very little change in the percentage of men and women living on their own is observed.
• The age-pattern of living alone is very different for men and women. At young ages men are more likely to live in a one-person household than women. At older ages, women are more likely than men to live in a one-person household.
4.3 Living with a partner but without children
Figure 3: Percentage of females living with a partner but without children, by country, year and age
Finland, females
0 10 20 30 40 50 60 70
20-24 25-29 30-34 35-39 40-44 45-49 50-54 55-59 60-64 65-59 70-74
Age
%
w
it
h
pa
rt
ne
r
1997
The Netherlands, females
0 10 20 30 40 50 60 70
20-24 25-29 30-34 35-39 40-44 45-49 50-54 55-59 60-64 65-59 70-74
Age
%
w
it
h
pa
rt
ne
r 1987
1992
1997
Figure 3: (continued)
Belgium, females
0 10 20 30 40 50 60 70
20-24 25-29 30-34 35-39 40-44 45-49 50-54 55-59 60-64 65-59 70-74
Age
%
w
it
h
pa
rt
ne
r 1987
1992
1997
2002
France, females
0 10 20 30 40 50 60 70
20-24 25-29 30-34 35-39 40-44 45-49 50-54 55-59 60-64 65-59 70-74
Age
%
w
it
h
pa
rt
ne
r 1987
1992
1997
Figure 3: (continued)
Spain, females
0 10 20 30 40 50 60 70
20-24 25-29 30-34 35-39 40-44 45-49 50-54 55-59 60-64 65-59 70-74
Age
%
w
it
h
pa
rt
ne
r 1987
1992
1997
2002
Greece, females
0 10 20 30 40 50 60 70
20-24 25-29 30-34 35-39 40-44 45-49 50-54 55-59 60-64 65-59 70-74
Age
%
w
it
h
pa
rt
ne
r 1987
1992
1997
Figure 3: (continued)
Czech Republic, females
0 10 20 30 40 50 60 70
20-24 25-29 30-34 35-39 40-44 45-49 50-54 55-59 60-64 65-59 70-74
Age
%
w
it
h
pa
rt
ne
r
1997
2002
Slovenia, females
0 10 20 30 40 50 60 70
20-24 25-29 30-34 35-39 40-44 45-49 50-54 55-59 60-64 65-59 70-74
Age
%
w
it
h
pa
rt
ne
r
1997
Figure 3 shows that the age-pattern for this living arrangement follows a kind of bimodal pattern. There is a – relatively modest – maximum during the late twenties, and a much more elevated maximum during the sixties. After age 70, the percentage of people living with a partner decreases again. The pattern resembles two hills being connected by a valley. Countries and years differ mainly by the height of each hill. The crests of both hills are higher in Northern and Western European countries than in Eastern and Southern European countries.
Over time, the percentage of women who live with a partner is on the increase all over Europe, both at young and old ages. This pattern is most pronounced for the Netherlands. In 1987, 32% of women aged 25 to 29 and 55% of women aged 60 to 64 were living with a partner but without children. In 2002, these percentages had risen to 45 and 67, respectively. The same pattern of an increase at young and old ages is observed in France and to a lesser extent in the Czech Republic, Slovenia, Spain and Greece. In Spain, for instance, the percentage of 25 to 29 year-old women living with a partner increased from 8 to 18 and the percentage of 70 to 74 year-old women doing so increased from 13 to 16.
Table 4a: Proportion of females living with a partner but without child(ren) in 2002, by country and age category
Age
20-24 25-29 30-34 35-39 40-44 45-49 50-54 55-59 60-64 65-69 70-74
the Netherlands 27.1 44.9 24.3 13.3 12.7 18.9 41.5 60.0 66.5 63.2 50.0
Belgium 7.2 16.5 9.2 6.8 8.0 15.3 32.5 49.3 56.7 56.4 48.5
France 22.8 28.9 12.5 6.9 7.9 20.3 38.7 56.3 61.0 58.0 51.1
Germany 17.0 24.4 17.3 11.4 13.9 26.0 43.8 58.4 63.4 58.5 45.6
Austria 10.6 18.0 12.8 9.7 11.3 21.5 32.9 45.0 47.2 43.9 37.7
Portugal 5.4 11.0 7.4 4.2 5.8 8.9 16.9 28.3 37.9 43.7 39.6
Spain 4.9 17.6 16.0 6.2 5.0 5.9 9.2 17.9 32.1 38.8 38.1
Italy 3.2 12.6 13.2 8.5 5.8 7.0 13.0 23.0 34.1 38.8 35.6
Greece 4.9 11.7 9.3 6.5 9.2 15.7 25.8 35.1 46.3 48.0 41.1
Czech Republic 7.7 10.3 3.9 3.2 5.8 17.4 34.9 48.7 53.7 50.1 39.1
Slovenia 2.7 8.0 6.3 5.1 5.8 12.9 22.3 36.0 43.1 41.5 35.5
Hungary 8.5 13.0 6.5 4.1 6.7 15.4 27.1 38.3 42.0 40.4 29.1
Slovak Republic 2.2 2.6 1.7 2.7 3.9 8.7 19.9 34.1 39.0 38.0 27.7
Table 4b: Proportion of males living with a partner but without child(ren) in 2002, by country and age category
Age
20-24 25-29 30-34 35-39 40-44 45-49 50-54 55-59 60-64 65-69 70-74
the Netherlands 10.0 39.4 30.9 16.8 14.2 14.3 32.4 54.3 67.9 76.8 75.7
Belgium 3.0 12.2 11.3 7.6 8.1 12.1 26.4 45.1 59.5 66.1 69.8
France 12.4 29.4 17.2 9.1 8.3 15.4 32.2 51.3 64.6 71.5 73.1
Germany 9.0 20.9 19.2 13.7 12.1 18.9 33.8 52.7 66.6 73.7 74.1
Austria 5.0 14.3 13.9 11.1 9.9 16.1 27.9 40.6 51.4 60.2 61.0
Portugal 3.1 9.6 8.6 4.7 5.6 6.7 12.0 25.3 41.2 52.3 60.1
Spain 1.6 11.7 18.0 9.3 5.6 5.1 7.0 13.7 26.7 41.9 51.6
Italy 0.9 6.9 13.5 10.5 7.4 6.2 8.2 16.2 29.3 43.6 52.1
Greece 1.4 7.6 10.3 8.2 6.4 8.6 16.8 27.7 40.8 53.9 62.7
Czech Republic 3.5 10.4 6.7 4.6 5.1 12.2 27.3 45.6 60.4 69.8 69.2
Slovenia 1.1 4.7 6.8 5.3 6.0 9.5 17.9 30.9 47.0 59.9 66.4
Hungary 4.3 11.1 9.6 5.6 6.2 10.7 21.7 37.2 52.0 61.5 65.2
Slovak Republic 1.1 2.4 2.3 1.4 2.8 7.0 14.5 32.0 44.1 52.0 56.3
Latvia 3.6 9.2 6.3 4.2 6.5 11.1 19.0 32.7 46.2 51.1 50.4
Lithuania 2.6 6.1 2.9 4.3 4.5 8.9 17.2 32.4 36.3 45.9 46.3
In Table 4a, the percentages of women living with a partner but without children in 2002 are presented for 15 countries. In Table 4b, the same is done for men. The variation in the occurrence of living with a partner is large. For instance, among 25 to 29 year-old men, the percentage varies from 5 in Slovenia to 39 in the Netherlands. Among 65 to 69 year-old men, the percentage varies from 42 in Spain to 76 in the Netherlands. Three groups of countries can be distinguished. France, Germany and the Netherlands make up a group with high levels of living with a partner, at both young and old ages. A second group is made up of Belgium, the Czech Republic, Austria and Hungary. These countries have lower proportions of men and women living with a partner at young ages, but approach those of the first group at old ages. All the other Eastern European countries and the Southern European countries form a third group. In these countries, levels of living with a partner are much smaller at all ages than in the countries in the other two groups. Within this third group, Italy and Spain are the two countries with the lowest diffusion of this living arrangement.
thirties. The earlier childbearing pattern for women also leads them to enter into the empty nest phase earlier than men, reversing the women-men ratio in this living arrangement. At older ages, the pattern reverses once again, due to the fact that men have a lower life expectancy than women. As a result, women more often live alone, whereas men more often live with a partner.
The results on living with a partner but without children can be summarized as follows:
• Living with a partner but without children is a living arrangement that is more popular during young adulthood and late adulthood than during middle adulthood.
• Living with a partner during young adulthood is more common in France, the Netherlands and Germany than in Southern and Eastern Europe. The same is true, but to a lesser extent, during late adulthood. Belgium, Austria, the Czech Republic and Hungary occupy an intermediate position in this regard.
• All across Europe, the percentage of people living with a partner has increased during young and late adulthood alike. This increase is most pronounced in countries in Northern and Western Europe, but can also be observed in countries in Southern and Eastern Europe.
• The age-patterns of men and women show the same curve but with a phase-difference. Women are more likely to live with a partner but without children during their twenties and between 40 and 54, whereas men are more likely to live with a partner in their thirties and after age 60.
4.4 Living with a partner and child(ren)
Figure 4: Percentage of females living with a partner and child(ren), by country, year and age
Finland, females 0 10 20 30 40 50 60 70 80
20-24 25-29 30-34 35-39 40-44 45-49 50-54 55-59 60-64 65-59 70-74
Age % wi th pa rt n e r a n d ch il d (r e n ) 1997
The Netherlands, females
0 10 20 30 40 50 60 70 80
20-24 25-29 30-34 35-39 40-44 45-49 50-54 55-59 60-64 65-59 70-74
Figure 4: (continued) Belgium, females 0 10 20 30 40 50 60 70 80
20-24 25-29 30-34 35-39 40-44 45-49 50-54 55-59 60-64 65-59 70-74
Age % wi th pa rt n e r a n d ch il d (r e n ) 1987 1992 1997 2002 France, females 0 10 20 30 40 50 60 70 80
20-24 25-29 30-34 35-39 40-44 45-49 50-54 55-59 60-64 65-59 70-74
Figure 4: (continued) Spain, females 0 10 20 30 40 50 60 70 80
20-24 25-29 30-34 35-39 40-44 45-49 50-54 55-59 60-64 65-59 70-74
Age % wi th pa rt n e r a n d ch il d (r e n ) 1987 1992 1997 2002 Greece, females 0 10 20 30 40 50 60 70 80
20-24 25-29 30-34 35-39 40-44 45-49 50-54 55-59 60-64 65-59 70-74
Figure 4: (continued)
Czech Republic, females
0 10 20 30 40 50 60 70 80
20-24 25-29 30-34 35-39 40-44 45-49 50-54 55-59 60-64 65-59 70-74
Age % wi th pa rt n e r a n d ch il d (r e n ) 1997 2002 Slovenia, females 0 10 20 30 40 50 60 70 80
20-24 25-29 30-34 35-39 40-44 45-49 50-54 55-59 60-64 65-59 70-74
The age-pattern of living with a partner and children reflects a reversed U-shape in all countries and years. The percentage of women living with a partner and children is low during young adulthood, but rises to more than 50 among women in their thirties and forties. Afterwards, the percentage of women living with a partner and children smoothly decreases again to relatively small percentages among women in their early seventies. This pattern can be illustrated by data from France. In 2002, among 20 to 24 year-old women, 10% lived with a partner. This percentage sharply increased to 70 among women aged 35 to 39, and then decreased again to 17 among 55 to 59 year-old women and to just 3 among 70 to 74 year-old women. Although the basic pattern is the same in other countries, some differences can be observed as well. The figures for Greece, and in particular for Spain, show much higher percentages of women living with a partner and children at advanced ages than in France. For instance, in 2002 the percentage of 55 to 59 year-old women in this living arrangement is 55 for Spanish women compared to 17 for French women. Likewise, in 2002 the percentage of 70 to 74 year-old Spanish women living with a partner and children is 16 compared to 3 among French women. These differences are linked to the fact that children in Mediterranean countries stay in the parental home for a much more protracted period of time than children in countries in Northern and Western Europe (cf. Figure 1). High percentages of children living with parents during their twenties and thirties will result in high percentages of parents living with children among age groups that are twenty to thirty years older.
however. In Northern and Western Europe, living with a partner and children is becoming less common at older ages, in Southern Europe it is becoming more common, and in Eastern Europe relatively little change is observed at all.
Table 5a: Proportion of females living with a partner and child(ren) in 2002, by country and age category
Age
20-24 25-29 30-34 35-39 40-44 45-49 50-54 55-59 60-64 65-69 70-74 the Netherlands 6.6 29.9 57.6 70.4 69.3 63.2 37.3 17.5 6.8 3.8 2.4 Belgium 5.4 27.8 53.0 60.2 60.5 50.9 33.8 14.2 4.8 2.1 1.1 France 9.8 39.5 64.4 70.4 69.2 56.5 35.4 17.2 8.6 4.7 3.0 Germany 10.7 32.4 53.8 63.2 61.7 50.0 33.0 16.1 8.8 5.5 3.5 Austria 8.6 32.6 54.5 61.3 60.0 52.5 39.0 22.8 16.6 10.9 5.8 Portugal 8.6 29.6 59.7 70.5 68.4 64.8 55.5 43.3 29.5 18.7 11.6 Spain 4.3 19.1 50.5 69.6 71.4 68.9 65.3 54.5 39.4 25.9 16.2 Italy 5.3 23.3 50.4 66.1 71.5 70.1 64.6 50.6 33.9 20.4 10.3 Greece 5.8 25.7 55.9 69.4 69.1 62.1 51.2 41.8 27.5 17.4 8.3 Czech Republic 10.4 46.8 70.0 73.7 69.6 56.9 37.8 21.9 11.1 5.3 3.0 Slovenia 2.6 22.1 50.7 63.2 65.8 59.5 48.3 32.0 18.9 11.7 6.8 Hungary 10.2 39.7 61.9 67.9 64.8 53.1 38.8 23.2 13.7 6.6 3.8 Slovak Republic 6.2 24.6 46.5 62.7 67.6 65.9 50.0 34.9 22.8 13.1 8.5 Latvia 9.5 31.0 47.5 51.5 51.4 40.0 33.7 22.9 14.6 10.7 7.4 Lithuania 6.1 29.0 45.9 56.1 58.6 50.7 41.4 29.1 19.3 12.4 5.2
other groups. Between 19% and 26% of the 65 to 69 year-old men live with a partner and children in these countries.
Table 5b: Proportion of males living with a partner and child(ren) in 2002, by country and age category
Age
20-24 25-29 30-34 35-39 40-44 45-49 50-54 55-59 60-64 65-69 70-74 the Netherlands 1.6 13.6 43.2 63.1 66.1 68.2 50.9 29.5 13.6 7.3 4.7 Belgium 1.5 15.8 42.0 56.1 60.5 57.5 44.5 25.4 10.9 4.7 3.0 France 3.7 24.8 54.7 67.4 70.8 64.8 49.1 29.6 17.2 9.7 5.9 Germany 4.7 19.4 39.9 55.4 61.1 56.1 45.0 27.9 16.0 9.9 7.3 Austria 3.0 17.9 41.0 55.8 61.9 59.3 48.1 36.7 27.2 18.6 12.4 Portugal 3.5 16.8 46.3 63.7 71.8 72.8 70.0 59.1 42.4 32.6 21.3 Spain 1.5 9.9 36.9 60.7 69.3 72.4 71.7 65.8 53.8 40.1 29.1 Italy 1.3 9.0 33.1 56.2 67.3 72.8 72.0 64.7 50.8 36.3 24.8 Greece 1.1 7.7 31.1 56.0 68.2 71.0 64.5 58.1 47.6 33.0 21.2 Czech Republic 4.3 29.5 59.8 71.6 72.7 66.9 53.1 34.5 21.7 12.6 8.2 Slovenia 0.8 9.2 33.3 55.8 63.9 66.6 59.2 47.3 34.2 23.4 12.8 Hungary 3.3 23.8 50.7 63.8 67.8 62.9 52.1 39.8 25.5 18.2 10.6 Slovak Republic 2.3 14.9 34.1 53.5 64.8 71.0 63.8 50.3 39.1 25.5 19.7 Latvia 4.8 24.7 46.1 53.8 57.2 55.8 46.9 36.7 24.4 20.8 16.9 Lithuania 1.9 19.2 39.4 60.1 65.1 59.5 49.4 43.6 32.7 23.2 16.8
The age-pattern of this living arrangement is largely similar for men and women, with one major difference. The pattern for men is shifted about one five-year age category to the right compared to that of women. At young ages, the shift is slightly less than five years, reflecting the fact that – on average – men become parents a few years later than women. At older ages the shift is somewhat more than five years, reflecting the fact that women are more likely to move to the lone parent category at older ages as a result of the death of their spouse (cf. the next section).
These results on living with parents can be summarized as follows:
• Living with a partner and children is the dominant living arrangement of both men and women during middle adulthood.
than in countries in Northern and Western Europe. Eastern European countries hold an intermediate position in this respect.
• Across Europe, family formation is postponed. This is reflected in a clear trend towards smaller percentages of young adults living with a partner and children. At higher ages the trends across Europe diverge. In Northern and Western Europe, the percentage of adults living with children at higher ages decreases somewhat, whereas it increases in Southern Europe. In Eastern Europe, relatively little change in the prevalence of living with a partner and children at older ages is observed.
• The age-profile of living with a partner and children is similar for men and women, with one exception: the curve for men is shifted one five-year age category to the right compared to the curve for women.
4.5 Living with child(ren) but without a partner
Living with one or more children but without a partner – hereafter usually designated as ‘living as a lone parent’ – is the last specific type of living arrangement to be discussed. Developments in the percentage of women at different ages who live as a lone mother are presented in Figure 5.
Figure 5 shows that living as a lone mother is a relatively uncommon living arrangement at all ages. The percentage of women living as a lone mother is low during their twenties as few women yet have children. In most countries, it rises to a peek during women’s late thirties and early forties followed by a decrease to very low levels among older adult women. For instance, in the Czech Republic in 2002, the percentage of women aged 25 to 29 who lived as a lone mother was 5, it increased to 13 among women aged 40 to 44, and at older ages decreased again to 5 among women aged 70 to 74.
Figure 5: Percentage of females living as a lone mother, by country, year and age
Finland, females
0 5 10 15
20-24 25-29 30-34 35-39 40-44 45-49 50-54 55-59 60-64 65-59 70-74
Age
%
l
one
pa
re
nt
1997
The Netherlands, females
0 5 10 15
20-24 25-29 30-34 35-39 40-44 45-49 50-54 55-59 60-64 65-59 70-74
Age
%
l
one
pa
re
nt 1987
1992
1997
Figure 5: (continued)
Belgium, females
0 5 10 15
20-24 25-29 30-34 35-39 40-44 45-49 50-54 55-59 60-64 65-59 70-74
Age
%
l
one
pa
re
nt 1987
1992
1997
2002
France, females
0 5 10 15
20-24 25-29 30-34 35-39 40-44 45-49 50-54 55-59 60-64 65-59 70-74
%
l
one
pa
re
nt 1987
1992
1997
Figure 5: (continued)
Spain, females
0 5 10 15
20-24 25-29 30-34 35-39 40-44 45-49 50-54 55-59 60-64 65-59 70-74
Age
%
l
o
ne
p
a
re
nt 1987
1992
1997
2002
Greece, females
0 5 10 15
20-24 25-29 30-34 35-39 40-44 45-49 50-54 55-59 60-64 65-59 70-74
Age
%
l
one
pa
re
nt 1987
1992
1997
Figure 5: (continued)
Czech Republic, females
0 5 10 15
20-24 25-29 30-34 35-39 40-44 45-49 50-54 55-59 60-64 65-59 70-74
Age
%
l
o
ne
p
a
re
nt
1997
2002
Slovenia, females
0 5 10 15
20-24 25-29 30-34 35-39 40-44 45-49 50-54 55-59 60-64 65-59 70-74
%
l
one
pa
re
nt
1997
Table 6a: Proportion of females living with child(ren) but without a partner in 2002, by country and age category
Age
20-24 25-29 30-34 35-39 40-44 45-49 50-54 55-59 60-64 65-69 70-74 the Netherlands 1.1 2.7 4.5 7.5 8.7 8.9 6.8 3.0 1.9 2.6 2.2 Belgium 1.8 5.1 9.3 13.0 13.2 11.7 6.5 3.3 1.3 0.8 1.2 France 1.8 4.9 7.2 11.4 12.5 10.3 8.5 3.8 3.2 2.9 2.8 Germany 2.6 5.4 7.9 10.6 10.6 8.2 5.6 3.5 2.6 2.6 2.7 Austria 1.5 4.1 7.6 9.6 11.9 8.2 7.1 5.6 4.8 4.1 3.8 Portugal 0.8 2.5 3.5 5.0 7.1 9.1 7.9 7.0 7.8 7.3 6.1 Spain 0.3 0.9 2.3 3.9 6.1 7.3 8.0 8.0 8.6 9.1 8.7 Italy 0.2 0.8 2.6 4.6 6.8 7.6 7.7 8.4 8.6 8.8 8.3 Greece 0.1 0.9 2.3 4.9 6.3 6.2 6.9 5.7 5.7 5.3 4.5 Czech Republic 1.2 4.7 10.1 11.6 12.6 11.2 8.0 6.6 5.0 4.0 5.0 Slovenia 0.4 1.8 3.4 5.5 9.9 11.1 10.3 8.7 5.9 8.1 6.3 Hungary 1.0 2.7 6.0 9.9 12.2 12.5 11.5 9.0 7.2 5.6 6.5 Slovak Republic 0.2 1.5 3.9 6.7 8.0 8.6 9.1 7.7 6.3 7.0 8.4 Latvia 0.4 3.8 8.2 15.8 14.2 15.0 11.8 8.1 7.4 5.9 7.9 Lithuania 1.8 4.2 8.5 9.5 11.4 12.0 10.8 6.9 6.3 5.1 5.6
Table 6b: Proportion of males living with child(ren) but without a partner in 2002, by country and age category
Age
In Tables 6a and 6b, the percentages of women and men living as a lone parent in 2002 are presented. The percentage of men living as a lone parent is low all across Europe, with the highest figure being 3 for Belgian men aged 45 to 49. With the exception of older men in Southern European countries, the percentages are mostly negligible. The percentages for women, however, are much larger. Three distinctive groups of countries can be distinguished. First, there is a cluster of all Northern and Western European countries, supplemented by the Czech Republic. In these countries, living as a lone mother shows a slow increase, followed by a peak between 10% and 15% of women in their early forties, and then slowly decreases again. A second group of countries consists of Hungary, Latvia and Lithuania. These countries follow the same pattern as the Northern and Western European countries, but the percentage of women living as a lone mother remains relatively high at older ages. This probably reflects the fact that the difference in life expectancy between women and men is much larger in Eastern European countries than in Northern and Western Europe, leaving widowed women behind to share their household with their adolescent or young adult children. Finally, a cluster with Southern European countries, supplemented by Slovenia and Slovakia, has relatively low rates of lone motherhood during young and middle adulthood but relatively high rates of lone motherhood among older adults. This reflects the fact that divorce is relatively low in these countries. Therefore, most women who become lone mothers at a relatively late age do so after experiencing the death of their spouse.
The age-patterns of men and women differ strongly. This is the only living arrangement that is more common among women than among men at all ages. The overrepresentation of women, however, becomes smaller with increasing age, probably because some men become lone fathers at a late age as the result of the death of their spouse. In all countries, divorce is usually followed by the creation of a lone parent family among women and by the creation of a one-person household among men.
The results on living as a lone parent can be summarized as follows:
• Living as a lone parent is a relatively uncommon living arrangement. In 2002 the highest percentage of women in this living arrangement was 15 among Latvian women aged 45 to 49. At most ages, less than 10 of women and hardly any men are living as a lone parent.
• During middle age, living as a lone mother is least common in Southern European countries. During later adulthood it is least common in countries in Northern and Western Europe.
• Women are much more likely to live as a lone parent than men at all ages, but particularly during the first half of the adult life course.
4.6 Living in an ‘other’ type of living arrangement
Together, the five types of living arrangements discussed so far constitute the large majority of living arrangements in almost all countries in our dataset. All other types of living arrangements are lumped together in a residual ‘other’ category. It contains many different types of living arrangements, and in most countries relatively small percentages of people are classified as living in this residual category. However, in a few countries, the proportion of people, particularly at the beginning and at the end of the adult life course, who live in this ‘other’ category is substantial. Given the residual nature, we will discuss this living arrangement in less detail than the other living arrangements. In particular, we will only show the percentages who are classified in this category in 2002 and we will refrain from a longitudinal analysis. The percentages of men and women living in this residual living arrangement are presented, separately by age group, in Tables 7a and 7b.
Table 7a: Proportion of females in ‘other’ living arrangements in 2002, by country and age category
Age
Table 7b: Proportion of males in ‘other’ living arrangements in 2002, by country and age category
Age
20-24 25-29 30-34 35-39 40-44 45-49 50-54 55-59 60-64 65-69 70-74 the Netherlands 4.2 3.3 1.3 1.2 1.1 0.9 1.3 1.1 0.8 1.1 1.6 Belgium 10.1 17.5 13.3 10.0 8.0 8.1 8.8 11.7 13.9 13.2 11.2 France 5.4 3.6 2.6 1.7 1.4 1.6 1.8 2.5 2.4 2.5 2.9 Germany 3.7 3.8 2.6 1.8 1.7 1.7 1.4 1.6 1.5 1.6 2.0 Austria 6.6 6.0 4.1 2.1 2.1 1.8 2.8 3.2 4.1 7.6 8.8 Portugal 9.0 10.9 9.6 7.3 4.9 5.2 4.4 3.9 4.0 4.7 6.9 Spain 8.3 8.7 7.0 5.7 5.2 5.0 4.5 4.1 4.6 5.8 8.1 Italy 3.8 5.4 5.3 4.6 3.7 3.7 3.6 4.1 4.7 5.2 5.9 Greece 8.8 5.6 4.6 1.6 1.9 1.2 1.4 1.5 2.0 2.9 4.3 Czech Republic 5.6 5.3 3.9 2.0 2.0 2.1 3.2 2.8 3.5 3.3 4.2 Slovenia 4.4 5.6 6.9 4.5 4.9 4.3 3.8 4.8 5.4 6.5 8.8 Hungary 8.4 7.4 4.5 3.2 2.7 3.1 3.2 4.1 4.6 3.9 6.8 Slovak Republic 6.1 12.3 12.7 7.9 5.0 3.8 4.3 4.1 4.2 6.3 6.9 Latvia 15.4 12.8 10.8 8.6 8.9 10.5 12.1 11.7 10.4 14.6 14.1 Lithuania 15.9 19.8 19.2 12.5 9.7 10.9 13.6 10.3 12.8 19.3 20.1
As can be observed in Tables 7a and 7b, the percentages of men and women who are classified as living in an ‘other’ living arrangement are usually quite small – far below 10 – in most countries and in most age groups. The percentages are highest at older ages, varying between 2 among 70 to 74 year-old women in the Netherlands to 31 among women of that same age in Latvia. A more detailed analysis of these data (results not shown) makes clear that the high percentages in Eastern European countries - and also the somewhat less elevated percentages in other countries – are due to the fact that many widowed older adults – women in particular – end up living in the household of their children. These households often include other relatives like siblings and grandchildren as well. The high percentage of men and women in this living arrangement for Belgium is surprising. It is unclear whether this reflects a ‘true’ difference between Belgium and its neighbouring countries or it is the result of flaws in the data.