in the population sciences published by the Max Planck Institute for Demographic Research Konrad-Zuse Str. 1, D-18057 Rostock · GERMANY www.demographic-research.org
DEMOGRAPHIC RESEARCH
VOLUME 19, ARTICLE 24, PAGES 907-972
PUBLISHED 01 JULY 2008
http://www.demographic-research.org/Volumes/Vol19/24/ DOI: 10.4054/DemRes.2008.19.24
Research Article
Russian Federation:
From the first to second demographic transition
Sergei Zakharov
This publication is part of Special Collection 7: Childbearing Trends and Policies in Europe (http://www.demographic-research.org/special/7/)
© 2008 Zakharov.
1 Introduction: Russia’s Population at a glance 908
2 The First Demographic Transition towards a two-child family: overcoming an inefficient model of fertility and family policy
909
3 The crisis of the age pattern of fertility and the second government attempt to prevent the ongoing fertility decline
916
3.1 Key quantitative characteristics of the Russian fertility pattern in the 1970s and 1980s
918
3.2 Qualitative characteristics of the Russian fertility pattern in the 1970–80s
919
3.3 The Demographic Effect of the 1980s Family Policy 922 3.4 Family and population policies in the 1990s and 2000s 929
4 Signs of the Second Demographic Transition: A Quiet Revolution in Family Formation in Russia since the mid-1990s
931
5 Conceptions of ideal and desired family size and differential fertility in contemporary Russia
938
5.1 Ideal, desired, and actual family size 938
5.2 Regional variety in fertility 941
5.3 Differentials by marital status 942
5.4 Urban-rural differentials 943
5.5 Inter-ethnic differentiation 944
5.6 Differentials by level of education 945
6 Principal conclusions 947
7 Acknowledgements 950
Russian Federation:
From the first to second demographic transition
Sergei Zakharov1
Abstract
The demographic transition in Russia was accelerated by several social cataclysms during the “Soviet type” modernization. Frequent changes in the timing of births and marriages engendered a mass “abortion culture”. Contraceptive devices of poor quality were produced on a limited scale. The Soviet regime promulgated pronatalism and considered contraception to contradict this ideology. There have been two waves of government policy interventions. In the 1930s and 1940s restrictive and propaganda measures prevailed. These failed to yield serious effects. In the 1980s, policies aimed at lessening the tension between full-time employment and maternal roles. These generated shifts in birth timing, namely shorter birth intervals and earlier second and third births, however increase in completed cohort fertility was minimal. A third wave started in 2007. Preoccupied with continuous depopulation, authorities intend to boost births by substantially increasing benefits. The mid-1990s was a turning point in the change of fertility and nuptiality models. The 1970s birth cohorts marry and become parents later. They delay first and second births and increasingly begin partnerships with cohabitation. Contraception is replacing abortion. New attitudes and perceptions about family, partnership, childbearing, and family planning are emerging. A major transformation typical for developed countries, the Second Demographic Transition, is underway. Nevertheless, many neo-traditional features of fertility and nuptiality remain. These distinguish Russia from most European countries and will persist in the near future. Completed fertility, however, hardly differs from the average European level.
1. Introduction: Russia’s Population at a glance
Russia had a population of 143,474 thousands on 1 January 2005. The overall population decrease for 2004 was 694 thousands or –4.8 per 1000 of the mid-year population. This decrease took place because of a surplus of deaths (2,295,000) over births (1,502,000), amounting to 793,000 which was not compensated by the positive international migration balance of 100 thousand or 0.7 per 1000 (including all official corrections for underreporting of immigrants). The population has been decreasing since 1993; the natural increase has been negative since 1992, making up –6.6 per 1000 in 2000–2002. In 1993–2004, Russia’s population decreased by 5,087,000. In the 1990s, the first years that followed the breakdown of the Union of Soviet Socialist Republics, an increase due to migration was quite substantial, 6.7 per 1000 (1994). To a large extent, this compensated for a growing negative natural decrease and mitigated the population decrease. The restrictive migration policy of recent years has reduced the number of immigrants, while complicated bureaucratic procedures of registration increased the proportion of illegal migrants residing in the country.
Russia can be described as a mono-ethnic country, with 80% of the population being Russians. The other ethnic population groups making up at least 1% of the overall population are Tatars (3.8%), Ukrainians (2.0%), Bashkirs (1.2%), Chuvash (1.1%), Chechens (0.9%), and Armenians (0.8%). Foreigners, including those without any citizenship and those not declaring citizenship, are 1.9% (the 2002 Census).
Russia is a country with a quickly ageing population. In 1970, the median age was 30.5; in 2005 it was 37.3. In 1990, the population aged 65+ made up 9.9% and the youth aged 0–19 accounted for 29.9%. By comparison, in 2005, the population aged 65+ made up 13.7% and 23.8% were youth aged 0–19. The single cause of the ageing population is low fertility of an under replacement level beginning with cohorts of women born in 1911 (net reproduction rate for synthetic cohorts has remained below 1 since 1965). There have been no signs of improvement in life expectancy in older ages for many decades, while improvements in child mortality helped slow ageing.
The real tragedy for Russia lies in the more than thirty-year deterioration of the mortality situation for those of working age, especially men. According to the present mortality tables, 47% of males who reach their 15th birthday will not survive to age 60.
In an address to the Russian Federal Parliament (in May 2006), President Putin said the issue of raising fertility is central in finding a way out of this demographic crisis. A new demographic policy, which took effect in 2007, is based on the idea of stimulating fertility. Another policy, which concerns replacement migration and aims at improving public health, is not articulated clearly at the official level. The debate over boosting fertility and the necessity of attracting migrants is going on at all levels: among experts, in the mass media, and among legislative and executive authorities.
2. The First Demographic Transition towards a two-child family:
overcoming an inefficient model of fertility and family policy
A steady fall in the birth rate in Russia began at the very end of the 19th century, when a
radical schism in the social, economic and political system of the Russian Empire gathered force, following the abolition of serfdom in 1861. Cohorts born in the 1880s and socialised at the turn of the century were the first to start out on the path of fertility limitation. The First World War – and the revolution, civil war and famine which followed – provided an additional impetus to the acceleration of the demographic transition.
During the entire first half of the 20th Century, a rapid and often brutal
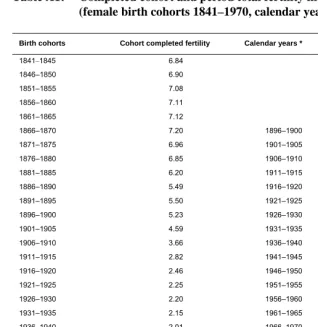
modernization took place and traditional peasant society played the key role in the transformation of reproductive behaviour patterns. Starting much later than in most Western countries, and from a higher level, Russia’s fertility transition was also much more rapid. A decline in cohort fertility in Russia was monotonic within the whole period of the demographic transition (see also Scherbov and Van Vianen 1999, Scherbov and Van Vianen 2001). Only the cohorts born between 1890 and 1895 – utilising the short breathing interval produced by the favourable conjuncture of the 1922–1928 New Economic Policy periods – show some interruption of this trend (Fig. 1, Appendix, Table 1).
the case of introduction of policy incentives, naturally the reverse sequence is observed: a rise and then a compensating drop.
Figure 1: Completed cohort and period fertility (PTFR) during the
demographic transition in Russia (average number of children born to a woman by age 50: birth cohorts 1841–1970, period 1897–2000 – top panel; birth cohorts 1930–1974, period 1960–2004 – bottom panel)
0 1 2 3 4 5 6 7 8
1840 1860 1880 1900 1920 1940 1960
Birth Cohort
B
ir
ths
pe
r
w
oman
1870 1880 1890 1900 1910 1920 1930 1940 1950 1960 1970 1980 1990 2000 Calendar Year
Period
Cohort
1.0 1.2 1.4 1.6 1.8 2.0 2.2 2.4 2.6 2.8
1930 1935 1940 1945 1950 1955 1960 1965 1970 Birth Cohort
Birt
hs p
e
r
wo
ma
n
1960 1965 1970 1975 1980 1985 1990 1995 2000 Calendar Year
Period
Cohort
The first demographic transition in Russia came to an end in the 1960s (mothers born between 1920 and 1930). The convergence of total fertility in the cohort of “mothers” and the cohort of their “daughters” can serve as a good indicator of the completeness of the transition process. Cohort and period total fertility converged in level, and spatial fertility variation narrowed, which also testifies to the completeness of the transition to a new type of fertility, one in which the average family has no more than two children (Zakharov 1994, Avdeev and Monnier 1995, Zakharov 2003).
To a substantial degree the transition to low fertility in Russia was accelerated by a series of continued social cataclysms/crises which went hand in hand with the modernization of Russian society. The point is that not only did living standards fall during the crises, but individual control over reproductive behaviour became a widespread practice among the mass of the population. Partners had to continuously adjust their reproductive practices to changing socio-economic reality. The necessity of frequent changes in the timing of births and marriages brought about the specific tools and measures of fertility control. In Russia, unfortunately, it led to widespread prevalence and long persistence of abortion as the major means of limiting family size.
One may say that during the Soviet period there was a mass “abortion culture” (see David ed. 1999: 23–39, 241–242) in which abortion was considered an “unavoidable evil,” and alternatives to which did not exist in order to, firstly, achieve the desired small number of children (no more than two) in the absence of another instrument – contraception – and secondly, for the necessary adjustment of family plans immediately in response to sharp changes in the social environment, which occurred all too often in the first half of the 20th century. It should particularly be noted that the
Soviet authorities never allowed any other population ideology than pronatalism (Ivanov et al. 2006), and implicitly considered contraception to contradict this ideology. If in the 1920s the obvious dilemma – abortion or effective contraception – was still discussed among experts, especially among medical specialists, who even carried out research on the development of contraceptive means which was pioneering for that period (Avdeev et al. 1995), then from the beginning of the 1930s and right up to the 1970s the question of the crowding out of abortion by contraception was never posed on a practical level. Until quite recently most if not all medical experts considered the Pill more dangerous than abortion (Rivkin-Fish 2005: 99). In connection with this, despite the absence of a direct ban, contraceptive devices were produced for decades in the Soviet Union on a very limited scale and were of poor quality (Popov et al. 1993). The chronic short supply was only eased in the 1980s, in part by imports of mostly the Intrauterine Devices (IUD), following the introduction of a special unpublicised programme of the USSR Ministry of Health (Avdeev 1994).
initiators of that law did not use any sort of argumentation whose roots could be found in ethical or religious norms (see discussion in: Blum 1994: 159–180). The main argument for the ban on abortion, in their opinion, was that “socialism has removed all limits which existed under capitalism for the growth of fertility among the labouring masses and therefore there is no longer the necessity to resort to abortion”. One cannot accuse the authorities of the absence of formal logic, inasmuch as decrees from 1920 on, allowing abortion upon a woman’s request, referred to the temporary character of these measures, for the period when “moral hangovers of the past and burdensome economic conditions” were still in effect (Blum 1994: 166–167). The covert motive of the authorities was the hope for an additional source of growth in births before the coming 1937 population census, which inescapably would reflect the serious consequences of collectivization, repression and famine for the growth of the population.
The period of the ban on abortion (1936–1954) did not bring any tangible dividends in the sense of growth in fertility: the trend in the cohort fertility rate did not even react to this situation, and the growth in the TFR in the second half of the 1930s is mainly explained not by the ban on abortion but rather by compensating mechanisms coming after calendar year shifts in the fertility of specific cohorts, produced by collectivization and famine in the first half of the 1930s. At the same time, negative consequences made themselves known swiftly and operated during the entire period of the ban: the number of maternal deaths doubled, the proportion of deaths from abortion among such deaths exceeded 70%, and murders of children under one year of age as a proportion of the overall number of murders more than doubled; in the urban population it went from 6% to 14%, and in Leningrad reached 25% in 1940 (Sakevich 2006). There is every reason to presume that, despite the fact that abortion became an illegal and criminally prosecuted practice for both sides – the pregnant woman and the abortionist – it continued to become more widespread in correspondence with the decline in fertility.
which meant deprivation of the right to bear the father’s surname. In this way, the status of “illegitimate” child was restored, a status which had existed in the Russian Empire and was eliminated immediately after the revolution. In addition, allowances for third or higher order births, and for children aged 1 to 4 years, were created. Maternity leave was increased from 9 to 11 weeks. Also, a series of six medals was created for mothers with 5–10 children. These medals conferred certain material advantages on their holders, such as preferential positions on waiting lists for kindergartens, summer children camps, and housing, as well as priority in queues in shops.
However, all of these measures (prohibitive and incentive) were aimed not at supporting the great bulk of families, but rather at reconstructing the former “ideal” type of family – spouses in a lifelong legal marriage, not regulating the number of their children – which was swiftly disappearing before one’s eyes as a social and statistical phenomenon. Therefore, the measures had neither any sort of serious influence on the dynamic of completed fertility nor did they transform the final parity distribution of mothers. The ideal of the two-child family as a central reference point, dictating a change in the level of fertility, swiftly strengthened its position, and high fertility was marginalized. After the War, particularly after the death of Stalin, social dissatisfaction with restrictive laws in relation to divorce and children outside of marriage arose quickly. However, the repeal of these laws occurred only in the middle of the 1960s with the adoption of the new family code of laws.
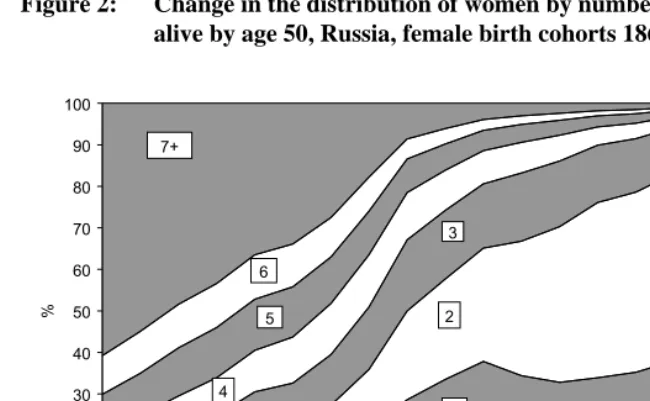
In the course of the First Demographic Transition in Russia, only two categories of women increased their proportionate weight: those with two children and those with one child. Importantly, women with two children outnumbered those with one, beginning with women born in the second part of the 1920s (Fig. 2, Appendix, Table 2). The proportion of women giving birth to seven or more children continuously declined. The share of women with three to six children varied: in the first stage of the demographic transition, this share rose and subsequently declined. The fluctuating pattern of change in this proportion of women mirrors the statistical regularity of the transition from a traditional type of fertility (high with no regulation at the family level) to a contemporary model (low with widespread birth control at the individual and family level) in a socially heterogeneous population.
The major reference point for the first demographic transition is the arrival of the two-child family (the data on the distribution of women by ever-born children support the idea of the existence of this model at a population level). Marriage cohorts seek to fulfill this ideal model of a two-child family with great consistency (Appendix, Tables 2 and 4).
Figure 2: Change in the distribution of women by number of children ever born
alive by age 50, Russia, female birth cohorts 1868–1968
0 10 20 30 40 50 60 70 80 90 100
1870 1880 1890 1900 1910 1920 1930 1940 1950 1960 Birth Cohort
%
0 1 2
3
4 5 6 7+
Sour ce: Zakharov S.V. (2006b).
The change in parity progression ratios indicates that within the whole period of the demographic transition, a family with three to four children has been the least popular (the decrease in probability of birth of the third and fourth child was swift and the greatest in magnitude), (see also Avdeev and Monnier 1995, Scherbov and Van Vianen 2001). The probability of a first birth has remained rather stable until very recently – that is, until the cohorts born in the late 1970s (Figure 3; Appendix, Tables 3 and 5).
children, medium number of children, few children. The demand for a medium number of children – 3 to 4 live-born in the course of a life – evidently did not exist historically as a mass social norm, neither in traditional society nor in the course of the demographic transition, nor even more so after the transition.
Figure 3: Ultimate parity progression ratios: Russia, female birth cohorts 1868– 1968
0.1 0.2 0.3 0.4 0.5 0.6 0.7 0.8 0.9 1.0
0 -> 1 1 -> 2 2 -> 3 3 -> 4 4 -> 5 5 -> 6 6 -> 7 Parity
PP
R
Cohort 1870 Cohort 1900 Cohort 1910 Cohort 1955 Cohort 1965
Source: Zakharov S.V. (2006b).
At the end of the day, what is important for family and society is not the number of children to which an average woman can and actually does give birth, but how many of them survive to socially significant ages, are socialized and come to replace their parents (that is effective fertility). A decrease in inefficient fertility is the essence of the first demographic transition. The Russian experience provides good evidence of this.
Within the first demographic transition, the expanded replacement of generations has been replaced by a simple or slightly narrowed one. The proportion of women who gave birth to one girl who survived to age 28, and thus ensured replacement, kept on growing in the course of the transition, reaching 43% in cohorts born in the 1950s and the1960s (Appendix, Table 7). Those who failed to ensure their replacement by the next generation (did not have at least one girl surviving to age 28) made up a highly stable and large proportion of 30% to 40% over the 20th Century. For selected generations of
women (born between 1909 and 1923), we can observe that this proportion rose above 40%: a rapid fertility decline in these generations was not accompanied by an appropriate reduction of mortality.
There is a major question about the prospect of ensuring replacement in the future. Beginning with cohorts born in the second part of the 1960s, the tendency towards under-replacement gathers momentum.
Over the previous hundred years, Russia has moved from a traditional type of reproduction, with accidental and practically unpredictable reproductive outcomes for individuals and their families, to a situation in which the uncertainty of reproductive outcome is minimal for an individual, and unreasonably high for society at large. Russia did not have the historical experience of supporting a regime of simple, let alone expanded, reproduction of a generation after child mortality became low, and control over fertility became the universal practice.
3. The crisis of the age pattern of fertility and the second government
attempt to prevent the ongoing fertility decline
The First Demographic Transition in Russia ended by the late 1960s, with the TFR dropping to 1.9–2.0. It was one of the lowest levels then reported in the world, and, at this level, could be compared with only a few countries such as Finland, Sweden, the Czech Republic, Hungary and Latvia. Russian cohorts born in the late 1940s experienced completed fertility of 1.83 –1.86 live born children per woman.
countries confronted the problems of “dual employment” (or double burden) of women earlier, with the conflict between widening equal gender rights in the extra-familial sphere and gender inequality in the family. All of this, of course, had an effect in that fertility in the majority of the countries of Eastern Europe after the Second World War reached low levels earlier than in the majority of countries of Western Europe.
Throughout the 1970s, the level of fertility in Russia remained more or less stable. At the same time, a remarkable process of change in the age pattern of fertility was occurring which, as is well-known, resulted in Western and Eastern Europe going in different directions, with specific regard to the rejuvenation of the age pattern of fertility and nuptiality (see also Avdeev and Monnier 1995, 1996). Since the late 1960s, Western countries, one by one, have been giving up the early and universal marriage pattern, and quite rapidly increasing the age at marriage and childbearing. This is actually an ongoing process (the Second Demographic Transition). In contrast, Eastern European countries have experienced nothing similar, with such countries as Russia and its neighbours in the European part of the former USSR, and a number of then-communist countries, gradually moving towards younger and younger ages at marriage and birth. By the 1980s, the contribution of mothers under age 25 to the overall number of births rose to an extremely high proportion. In Russia, for example, more than 50% of the cohort and period TFR was contributed by mothers at these ages, and by the age of 28 to 30, the number of children in a family ceased to grow (Appendix, Tables 8– 11). By age 25, about 80 % of women had been married at least once (Avdeev and Monnier 2000).
Up to the beginning of the 1990s, the tendency to form a family at younger ages prevailed in Russia. The contribution of mothers under age 25 to the TFR exceeded 60%, while the input of the youngest mothers – under 20 – rose to 17–18%.
Early marriage fulfilled the function of legalizing early sexual relationships and covered up the obvious fact of “the Fall”, or the unplanned pregnancy.
Thus, the roots of the convergent and then divergent movement of temporal models of fertility in the countries of Western and Eastern Europe in the 1960s to 1980s lay in one and the same process: liberalization of sexual morals. At first, the sexual revolution in both parts of Europe caused a lowering of the age of entry into marriage and the age of motherhood. Later, as the contraceptive revolution gathered force, the situation was corrected in the Western countries, and the age model of fertility there began to grow older. The sexual revolution in Eastern Europe, in comparison with the countries of the West, proceeded more quietly and less noticeably to the observer, by virtue of the taboo placed on the theme for research and the more than simply limited depiction in the mass media. But, in fact, it had a no less radical character. Unlike that in the Western countries, the sexual revolution in Eastern Europe was not accompanied by the parallel process of the contraceptive revolution. Moreover, in East European countries, and first of all in Russia in setting the ideological direction, there was an artificial brake by the state on transition to effective contraception. Only perhaps in Hungary and some republics of the former Yugoslavia was policy in the field of family planning in conjunction with the fight against abortion relatively more pragmatic. From this flowed various consequences for the model of fertility and marriage in Western and Eastern Europe: in the course of two decades at one and the same level of overall fertility, the age at childbirth moved in opposite directions on opposite sides of the Berlin wall. Moreover, family policy, adopted as a weapon in different years in the then-communist countries, last of all in 1981 in the USSR, acted in the same direction: it supported earlier-begun/earlier-completed childbearing and universal marriage.
We systematise here the key qualitative and quantitative parameters of this model of fertility which Russia approached at the moment of change of the political and socio-economic system at the beginning of the 1990s.
3.1 Key quantitative characteristics of the Russian fertility pattern in the 1970s and 1980s
The interval between first marriage and first birth was, on average, about a year (given current mean age at first marriage and first birth), which implies that first birth was not postponed. Moreover, it is very likely that the timing of the first birth was not regulated at all. As the relevant studies show, more than 50% of pregnancies occurred before marriage.
The attitude towards a two-child family was relatively strong – close to 50% of women by the end of their life had two children (App. Table 2), and the parity progression ratio for those with one child was 71% (App. Table 3). On the other hand, the proportion of mothers with three and more children was not higher than that for only one child (16–18% versus 27–30%). As a result, cohort completed fertility averaged 1.9 (App. Table 2).
The interval between first and second births was less than four years, between the second and third 2.5 years, between the third and fourth, 1.5. The tempo of family formation was greater for those who chose to have more than two children, as well as for those who did not practice birth control on a regular basis (that is, some marginal groups).
The parity progression ratio for third, fourth, and fifth birth orders was much the same and was about 25–27% for those with one child fewer than the given birth order.
3.2 Qualitative characteristics of the Russian fertility pattern in the 1970–80s
Some features of a traditional pattern were preserved: obligatory marriage; a strong link between sexual and matrimonial behaviour; outdated practices of family planning among youth; pre-marital pregnancy as a stimulus for marriage; a high tempo of family formation at young ages; no signs of voluntary childlessness; and, virtually no regulation of the timing of first births. Thus, sexual life, marriage, and childbearing were not viewed as separate values, but rather as concurrent events.
There were transitional features associated with modernization, such as the prevalence of a two-child family ideal, while there was still a considerable proportion who desired more children (largely associated with the ethno-cultural diversity of the population of Russia).
creation of a family and the birth of a child. Consequently, poverty took on the character of a “vicious circle” and hardly anyone broke out of this.
The pattern was not based on social rationality. The possibility of acquiring more than a higher or a secondary school level of education was seriously constrained because the time when people normally continue their education coincided with the early stages of family formation. Advancement in professional skills was also limited, particularly for women. Thus, early family formation increasingly conflicted with the values of higher education, professional career, and gender equality.
The pattern was not based on demographic rationality. As there were virtually no births after 30, fertility was very low and the period of possible reproductive life was not used to the full extent. The high prevalence of unintended births led to “shot-gun” marriages (caused by an accidental pregnancy), to high intra-family tension in young families, to conflicts with relatives, and, accordingly, to a high risk of divorce – the probability of divorce in Russia was one of the highest in the world. As surveys showed, a divorced mother with one child was less likely to give birth to a second child than was a married mother.
The pattern was not rational in terms of individual and public health. In order to be able to complete childbearing at a young age, partners need to use effective contraception for a long period of time. The risk of abortion in such a situation is high, and even higher in a country like Russia with a virtual lack of family planning. Modern contraception was either not available or not encouraged by official public health authorities (the Pill), or in short supply (IUD), or of very poor quality (the condom). In addition, both female and male sterilization was prohibited. Russia was an excellent example of the prevalence of an abortion culture in which overall birth limitation was much more important than the spacing and timing of conceptions and births. The reproductive health of the Russian population was poor, with a high level of pathologies, including after-abortion infections and more serious complications.
It was absolutely clear that the persistence of such a pattern into the future was unacceptable, as it failed to meet the requirements of a modern society whose values include good education, high-quality skills, and high standards of consumption. The rationalization of individual behaviour, above all that of Russian youth, was inevitable.
However, before the transformation began, there was a period of a temporary “baby boom” from 1981 to 1990, associated with the implementation of a new variant of pronatalist policy measures.
the press, and at a multitude of professional conferences, with all of this public discourse finally reaching the ears of the political leadership. The 24th Congress of the
Communist Party of the Soviet Union/CPSU (1971) declared that an unsatisfactory demographic situation had developed in the country, and the 25th CPSU Congress
(1976) set the task of working out “an effective demographic policy”. The 26th CPSU
Congress (1981) indicated the concrete future of political intervention: financial and material assistance to young married couples and families with children; improving housing conditions; increasing the accessibility and quality of preschool establishments; widening the possibilities for part-time employment; and, work at home for women and the introduction of partly paid leave to look after small children. The proclaimed policy did not, however, establish concrete quantitative parameters as goals to fulfil for fertility.
The basic innovative measures in family policy were introduced in stages: from November 1981 in Siberia and the Far East, and also in the territories of the European North, and from November 1982 in the remaining areas of Russia. Maternity leave on full pay was extended from 77 to 112 days (then to 126 days in 1990). Several options were introduced for child-care leave: a) 18 months of leave on full pay to take care of a sick child; b) leave with about 20% of the average wage from the end of maternity leave to the day the child reached 18 months; and c) unpaid leave to look after children from 18 months to 3 years. Moreover, a parent looking after a child was guaranteed the right to part-time employment or to work at home. Women with children under 14 in all enterprises and establishments were to have the choice of working a full or less than full working day, including a flexible hourly or weekly work schedule.
A number of measures introduced earlier continued to be operative, such as: a benefit for poor families, a one-time childbirth benefit graded by birth order, a special tax introduced during the Second World War (1941) for childless unmarried men and unmarried women.
Finally, the 1981 policy provided a whole series of subsidies for a special category: “mother of many children” (mnogodetnaya). This provided a whole set of advantages: reducing the time needed to obtain housing, easing access to consumer-durable goods in short supply, cutting queuing time in shops, which was critically important in the prevailing conditions of short supply of every sort of everyday product, and so on. Moreover, mothers who raised at least five children to the age of eight were supposed to have a reduction in pension age.
• lengthy maternity leave, partially paid, with previous employment guaranteed for three years;
• introduction of two types of child allowances, both as a lump sum and on a regular monthly basis;
• some changes in housing policy and granting to families with children some benefits in the difficult consumer market.
• The extension of the status of mother/family of many children to those with three children was also important.
3.3 The Demographic Effect of the 1980s Family Policy
The reaction of the population to the innovative measures was practically instantaneous. The TFR increased from 1.89 in 1980 to 2.11 in 1983 and to 2.22 in 1987. TFR then started to fall quickly, decreasing to 1.37 in 1993. The dynamic of the period progression ratios for first to sixth order births shows that the probability of birth of children of the first three orders increased – the probability of the fourth and subsequent children continued to decrease. The indicator for second births displayed the greatest growth (Zakharov and Ivanova 1996).
However, if we pass from period to cohort indicators, we can only with difficulty observe any visible successes in the family policy of the 1980s.
The generation which was in its active child-bearing years in the period the measures were operative did not show an increase in completed cohort fertility. (Zakharov and Ivanova 1996; Avdeev, Monnier 1995; Zakharov 2006d). It should be noted that it is entirely possible that these measures prevented a further decline in cohort fertility. Basically the demographic effect of family policy was in fact reduced to calendar year shifts in births of actual generations (a timing effect).
We illustrate what has been said with the data itself.2 The two panels of Figure 4
show the proportion of mothers who have given birth to two or more children, presenting cumulative totals for the indicated age for real and synthetic cohorts. In the first panel the curve relates to two synthetic cohorts (calendar periods): 1980, that is, up to the introduction of the demographic policy measures, and 1987, when the growth of the current-year indicators of fertility reached their peak. In the second panel, two birth cohorts are presented: the cohort of females born in 1954, whose fertility was affected by the influence of the demographic policy measures only at later ages (by the end of 1983 they had reached the age of 30), and the cohort born in 1960, whose fertility was most directly affected by the policy measures.
2 The data presented were calculated by the author by constructing full parity-specific fertility life tables for
Figure 4: Cumulative proportion of women giving birth to a second child at the indicated age, per 1000 women: period life tables for 1980 and 1987 (top panel) and life tables for 1960 and 1954 birth cohorts (bottom panel)
0 100 200 300 400 500 600 700 800
20 25 30 35 40
Age
P
er 100
0
wo
me
n
Table 1987
Table 1980
0 100 200 300 400 500 600 700 800
20 25 30 35 40
Age
P
er 1
000
w
ome
n Cohort 1960
Cohort 1954
Comparison of the two panels demonstrates the gravity of error possible in analysis of the effectiveness of demographic policy measures which depend on indicators of a hypothetical generation. According to the period fertility table for 1980, it might be expected that 25% of women will have had two or more children by the age of 25, 51% will have had two or more children by the age of 30, by age 35, 61% and by age 40, 64%, which fully corresponds to the actual rhythm of fertility of the 1954 cohort. The table for 1987 reflects the destabilising character of the demographic policy measures – expectations have sharply increased: by the age of 25, 33% of women should already have given birth to two or more children, 61% by age 30, 72% by age 35, and 76% by age 40. It is not surprising that the total fertility rate (the indictor summarising fertility of a hypothetical generation) jumped from 1.89 in 1980 to 2.22 in 1987. However, not a single actual generation followed the “optimistic” schedule shown by the fertility table for 1987.
The birth timetable for women of the 1960 birth cohort differs in a significant fashion from the timetable for women born six years earlier. In the 1954 cohort, 23% of women had given birth to at least two children by age 25, 51% by age 30, and 64% by age 35. In the 1960 birth cohort, the corresponding figures are 29%, 57%, 64%. This means that representatives of the younger of these two cohorts gave birth to their second and successive children on average one to three years earlier than their older contemporaries. However, by age 35, despite the powerful start of the younger cohort, the cumulative proportion of women with two and more children was equal for both cohorts.
Completed cohort fertility was to some extent influenced by the social policy measures of the 1980s, shown in Table 2. The indicators presented in the final column of the table do not allow us to speak about any sort of significant success of this policy, i.e. about any increase in the ultimate number of children born. The single indisputable effect which can be observed is the change of the timetable of births, expressed in the “rejuvenation” of fertility of a whole series of cohorts.
It is interesting to ask which social groups reacted most to the family policy measures. Official statistics do not allow breakdowns by social group in the analysis of fertility in Russia. Therefore, we use data from the nationally representative sample study of the “Gender and Generations” Programme (GGS), carried out in 20043.
3 All Russia representative sample Survey was conducted by the Independent Institute of Social Policy
Table 2: Mean number of children born by age 25, 30, 35 and 50, to the 1954– 1966 female cohorts
Mean number of children born by the given age Year of birth of
cohort 25 30 35 50
1954 0.94 1.45 1.78 1.90
1955 0.95 1.49 1.83 1.89
1956 0.95 1.54 1.85 1.88
1957 0.94 1.50 1.78 1.87
1958 0.96 1.53 1.77 1.87
1959 0.96 1.56 1.77 1.87
1960 0.99 1.60 1.77 1.84
1961 1.02 1.59 1.74 1.80
1962 1.03 1.55 1.70 1.76*
1963 1.04 1.50 1.65 1.72*
1964 1.05 1.47 1.62 1.69*
1965 1.07 1.44 1.59 1.67*
1966 1.07 1.39 1.56 1.65*
Source: Zakharov S.V. (2006) updated.
Note: *Preliminary estimate using data up to 2005. The actual magnitude will most probably be somewhat higher, in light of the tendency of fertility to increase at older ages, as observed in the most recent years.
It is well-known that the strongest socially differentiating characteristic for demographic behaviour in Russia are place of residence – cities or rural areas – and educational level. The GGS questionnaire unfortunately established the place of residence and the educational level achieved only at the moment of the survey: the corresponding retrospective characteristics at the moment of childbirth are not available to us. However, the error which may arise in connection with this can scarcely have a significant impact on the conclusions.
through analysis of the macro-statistical data. For the entire population as a whole, neither the aggregate probability of birth of a first nor a second child rose, and the aggregate probability of a third birth even declined somewhat.
The policy slightly raised the aggregate probability of birth of a first child in regional centres and to mothers with a high level of education and the probability of second births in provincial cities and to women with a high level of education. The probability of a third birth increased only in provincial cities.
The policy to a significant degree accelerated the formation of families in all social groups, primarily due to the birth of the second child at a younger age, which in practice meant a widespread and significant shortening of the interval between the first and second births.
The policy for a short time levelled social distinctions in the calendar of births: the tempo of family formation in the cities strongly increased and came as close as possible to the tempo in rural areas; the tempo of family formation in women with higher than average educational status came closer to the tempo of family formation of women with a lower than average educational status.
Table 3: Parity Progression Ratios of women with 1 child, by type of
settlement, by age 20, 25, 30, and 35: Russia, cohorts 1950–54 and 1960–64, per 1000 women
Birth cohort and By age 20 By age 25 By age 30 By age 35 type of settlement Transition to second parity (1Æ2)
1950–54 Provincial capitals Other cities
Villages and small towns All areas 28 42 50 39 162 224 340 242 447 484 647 520 623 632 788 674 1960–64
Provincial capital Other cities
Villages and small towns All areas 106 33 92 80 340 361 494 403 532 648 736 635 569 693 781 676
Table 4: Parity Progression Ratios of women with 1 child, by educational level, by age 20, 25, 30, 35 and 40: Russia, cohorts 1950–54 and 1960–64, per 1000 women
Birth cohort and By age 20 By age 25 By age 30 By age 35 By age 40 education* Transition to second parity (1Æ2)
1950–54
Secondary and lower Post-secondary All levels 74 … 39 322 192 242 590 480 520 735 642 674 761 670 701 1960–64
Secondary and lower Post-secondary All levels 74 85 80 406 402 403 663 618 635 698 663 676 715 675 689
Source: Author’s estimates based on Russian GGS (2004) data.
Note: *Secondary education includes elementary vocational education; post-secondary includes middle and higher professional education, and advanced research programmes.
Thus, the demographic effect of the policy did not manifest itself in an increase in average family size in any major social group, but rather in an increase in social homogeneity in the model of fertility timing dominant in Russia. Fertility over all became even younger than before, above all for inhabitants of large cities and populations of high educational status, for whom the timing effect showed itself most strongly.
Figure 5: Average interval between first and second births, years: Russia, 1947– 1993 (calculation carried out for women with an interval between the birth of the first and second child did not exceed 10 years)
2.0 2.5 3.0 3.5 4.0 4.5 5.0 5.5 6.0 6.5
1945 1950 1955 1960 1965 1970 1975 1980 1985 1990 1995 Year of birth of the 1st child
In
terv
al,
y
ears
3-years moving average
Source: Author’s estimates based on Russian GGS (2004) data.
Figure 6: Average interval between first and second births: Russia, selected
female birth cohorts by specified age at second birth
2.0 2.5 3.0 3.5 4.0 4.5 5.0 5.5 6.0 - 1 929 1 930-1 934 1 935-1 939 1 940-1 944 1 945-1 949 1 950-1 954 1 955-1 959 1 960-1 964 1 965-1 969 1 970-1 974 1 975-1 979 Birth cohort Inte rval, year s
by 25 by 30 by 35 by 40
On the one hand, the policy of the 1980s offered improved opportunities for childbirth and bringing up children, namely for the most advanced social groups, and it is entirely probable that it prevented a further decline in Russia for some period of time. On the other hand, however, the policy only temporarily postponed the final destruction of the traditional model of early family formation, which by that time was already going through a crisis and did not have a long-term future. In the new socio-economic conditions of the Transition Period in Russia, such a model of fertility and family formation had even less chance for survival, given that the previous dependence on the paternalism of the parents’ family and the state was no longer possible.
3.4 Family and population policies in the 1990s and 2000s
The economic and political reforms which had gathered strength in the middle of the 1990s triggered the transformation of marital and reproductive behaviour in the direction of an increase in the age of entry into marriage and the birth of children. At the same time, in the 1990s, no new initiatives in the area of family policy were put forward. The government supported a liberal economic model and the actions of the state in the area of social policy, under the pressure of powerful budget limitations, came down to reactive measures for ameliorating the most acute problems: pensions, enmployment and poverty (Eatwell et al 2000). Attempts to preserve the real value of the packet of family benefits and other payments for children in conditions of high inflation were timid, delayed and on the whole extremely unsuccessful. Expenditure on family allowance as a percentage of GDP dropped from 2% in 1991 to 0.36% in 2000; family allowance as a percentage of total household income decreased from 5.6% to 1.2%, respectively (A Decade of Transition 2001: 43). In 2004 these indicators fell even lower – 0.28% and 0.4%.
In President Putin’s budget address to the Federal Assembly (May 2006), a demographic theme occupied the central place. Priorities and solutions to the problem were placed by the President in the following order: reduction of mortality, increase in the attractiveness for immigration to Russia, and an increase in the birth rate. At the same time, the main accent was placed on the necessity to stimulate the birth rate, beginning in 2007. At the end of 2006, the legislative and executive organs made all necessary decisions and, in 2007, the new measures came into force. First of all, there were significant increases in the size of the basic forms of benefits:
The one-off payment at the birth of a child was set at 6000 roubles from 1 January 2006, paid out of federal sources (between 1997 and 2000, it was 1,250 and in the period 2002–2005, it was 4,500 roubles). However, at the regional level, starting in 2005, an additional benefit was paid, determined by the regional administration (for example, Moscow has the maximum benefit for Russia, which is tied to the annually determined official subsistence minimum in that city: for the first child, it is five times this minimum (25,000 roubles in 2007) and for the second, a multiple of seven, and for the third and subsequent children, ten times this minimum.
From 1 January 2007, the monthly maternity leave benefit for up to 1.5 years was established at 40% of the recipient’s average wages, but not less than 1,500 roubles for the first child and 3,000 for the second and subsequent children, payable also where the mother was unemployed, but not more than 6,000 roubles a month (in 2000, 167 roubles; in 2002, 500 and in 2006, 700 roubles, independent of birth parity but on condition of employment history).
The monthly federal benefit for children from 1.5 to 16 years of age (for those remaining in studies up to the age of 18) was repealed in 2005 (at that time, it was 70 roubles). From 2006, this is the prerogative of the regional authorities, who set differing levels (usually 100 –200 roubles) and some regions established the size of the benefit depending on birth parity and/or family income. In 2007, there was a recommendation to increase this benefit, which in fact occurred. For example, in Moscow the benefit, initiated on 1 January 2007, is paid only to families with a per capita income lower than the subsistence minimum (5,100 roubles in January 2007), and is 300 roubles (in 2006, it was 150 roubles), and for single mothers, 750 roubles (in 2006, it was 300 roubles).
Thus the size of the benefit was significantly increased but the basic system of measures did not undergo any significant change, if one does not consider the continuing tendency to strengthen the role of regional authorities and their financial responsibility for family policy.
It is important to note that the authorship of “maternal capital” as an innovative measure is unknown in expert circles. Not one of the variants of the conceptions worked out for “Demographic Policy in the period 2015–2020”, presented to a wide circle of specialists for expert evaluation in 2005–2006, mentioned this measure. A conception of demographic policy itself was adopted by the Russian government and signed by President Putin in October 2007. Thus, all the measures which came into force in 2007 are the work of Putin’s Administration, and the Ministry of Health and Social Development.
4. Signs of the Second Demographic Transition: A Quiet Revolution
in Family Formation in Russia since the mid-1990s
By the middle of the 1990s, signs of inevitable change in the Russian fertility pattern under discussion emerged, and arguments were made that Russia was on the threshold of the Second Demographic Transition (Zakharov and Ivanova 1996, Katus and Zakharov 1998, Zakharov 1999, Zakharov 2000).
Criticism develops around the fact that the available Russian data do not offer firm foundations for conclusions about the start of “westernization” of fertility in Russia: official marriage at an early age remains the only form of union and cohabitation is not widespread among Russian youth. The first child is unplanned, as was the case 100 years ago, and having children is not postponed to a later age (Barkalov 1999, Avdeev and Monnier 2000, Mills 2004). The fact that fertility decline in the first half of the 1990s had a quantum effect (Philipov and Kohler 2001) is frequently linked, exclusively, to the economic crisis, deteriorated standards of life, and cultural shocks rather than to the beginning of a fundamental transformation of the model of family formation itself. It should be noted that there is not enough empirical data to verify “the crisis hypothesis”, either (Kharkova and Andreev 2000, Kohlmann and Zuev 2001, Kohler and Kohler 2001).
(Maleva and Sinyavskaya 2006), indicate that the probability of an actual birth and the intention to have a first and second child in Russia are practically unrelated to factors of economic rationality (income, female employment). At the same time, the high significance of socio-cultural determinants and values are confirmed, which today are undergoing a powerful change in the direction of individualism.
In the industrialized world, the second demographic transition manifested itself in the generation born in the 1950s and 1960s. The former Yugoslavia (republics of Slovenia and Croatia, specifically) and Hungary were pioneers in this process among the Eastern European countries, with the cohorts of the 1960s leading. At least reducing the contribution of young mothers to completed fertility. The fertility postponement process in these countries started somewhat earlier than in other former socialist countries (Appendix, Table 12, see also: Sobotka 2002, p.14–15, Philipov 2004, p.2, 11). In Russia, no changes were observed before the cohorts born in the first part of the 1970s (Appendix, Tables 12, 14).
The Russian cohorts born in the 1970s and more recently, whose socialization had already begun in the “new, post-Soviet Russia,” tend to differ from their parents. They marry and become parents at more mature ages (fig. 7, 8, 9, Appendix, Tables 14–17). They delay the first and the second birth (Appendix, Table 18). They increasingly prefer to begin a partnership with cohabitation rather than with legal marriage. Family planning becomes more effective, i.e. contraception replaces abortion.
Figure 7: Age-specific fertility rates, per 1,000 women: Russia, 1980, 1985, 1990, 1995, 2000, 2005
0 20 40 60 80 100 120 140 160 180 200
15 20 25 30 35 40 45
Age
P
er 100
0
1980 1985 1990 1995 2000 2005
Figure 8: Age-specific fertility rates per 1,000 women: Russia, female birth cohorts 1949–50, 1959–60, 1969–70, 1974–75, 1979–80, 1984–85
0 20 40 60 80 100 120 140 160 180 200
15 20 25 30 35 40 45
Age
P
e
r 100
0
1949-50 1959-60 1969-70 1974-75 1979-80 1984-85
Source: Author’s calculations based on unpublished official data
Figure 9: Cumulative fertility by age, per 1,000 women: Russia, female
birth cohorts 1949–50, 1955–55, 1959–60, 1964–65, 1969–70,
1974–75, 1979–80
0 200 400 600 800 1000 1200 1400 1600 1800 2000
15 20 25 30 35 40 45 50
Age
P
er
10
00
1949-50 1954-55 1959-60 1964-65 1969-70 1974-75 1979-80
Data from the current registration of marriages, results of the 2002 Population Census and research carried out in the GGP Programme convincingly demonstrate that in Russia over the past two decades a “quiet revolution” has taken place with respect to the institution of legal marriage: the age at first marriage is increasing; cohorts of Russians born in the first half of the 1960s and later increasingly begin living together with a partner outside a legal marriage, i.e. cohabitation [“unregistered marriage”] is gradually crowding out the traditional form of marriage (Appendix, Tables 13, 17).
It cannot be said that cohabitation before marriage was not widespread in Russia. On the contrary, in the generations of Russians born before the war and, in the 1950s, establishing their families, up to 20% of men and women under the age of 30 began their first partner union with a non-marital relationship. Moreover, the tendency for an earlier start in partnership relations, as discussed above, was accompanied by a steady if slow growth of informal unions among youth (Figure 10). It is very probable that the family policy interventions of the 1980s are responsible for the drop in the proportion of those who began a first partnership with cohabitation in the 1955–1965 female cohorts. A legal marriage tended to bring more rewards.
However, among representatives of the cohorts born after 1960, the spread of informal unions take on an explosive character. Today, up to 25% of women by the age of 20, and up to 45% by age 25, do not register a marriage with their first partner. Data for men confirm these figures – 40 to 45% of first unions today are informal unions.
Informal relations (consensual unions) at the start of living together have the temporary character of a trial marriage for the majority. After some period of time for many couples the relationship becomes fully respectable and it is legally formalized in a marriage. At the same time, the RusGGS data indicate that registration of marriage in Russia is increasingly not simply postponed to a time when the stability of the relationship is proven, but does not happen at all (Figure 11). If in the cohorts born in the 1950s, 50% had already registered a marriage with their partner less than a year from the start of a consensual union, then in the cohorts born in the second half of the 1970s, this figure is 30%. The indicator also declines for those who live together a long time. Not long ago 70% of partners registered their marriage by the third year of a consensual union. Today it is 50%. By the fifth year of family life, the reduction is more than 10 percentage points. We note that if the relationship is not formalized within 3–5 years of living together, the chances the marriage will be registered at some time in this partnership are minimal: there is virtually no difference between the percentage of registered marriages by the fifth and the tenth year from the start of relations.
aged 20+ have become almost equal in the last 15 years (Appendix, Table 20). Non-marital pregnancy is losing a pusher role in contracting a marriage.
Figure 10: Cumulative percentage of women who had, by the specified age, entered a first partnership which was a consensual union: Russia, birth cohorts
Women, 1st partnership=cohabitation
0 5 10 15 20 25 30 35 40 45 50
- 1929 1935-39 1945-49 1955-59 1965-69 1975-79
Pe
r cen
t
by 20 by 25 by 30
Men, 1st partnership=cohabitation
0 5 10 15 20 25 30 35 40 45 50
- 1929 1935-39 1945-49 1955-59 1965-69 1975-79
Pe
r cen
t
by 25 by 30
Figure 11: Cumulative percentage of women whose first partnership was a consensual union later converted into marriage, by the time since start of first partnership: Russia, birth cohorts
Women, informal union ---> marriage
0 10 20 30 40 50 60 70 80 90
- 1929 1935-39 1945-49 1955-59 1965-69 1975-79 Birth cohorts
Pe
r c
e
nt
by 1st year by 3rd year by 5th year by 10th year
Source: Author’s estimates based on Russian GGS (2004).
Over the last ten years, the fertility of women under age 20 in Russia has halved (Appendix, Table 10), which indicates that a radical change in the behaviour of young people is taking place. Since 1995, fertility in Russia has been aging. The contribution of mothers at less than 25 years of age to the TFR is diminishing, while that of more mature mothers is increasing (Appendix, Table 11). Today, the mean age of mothers at first, second, and third births is higher than twenty years ago, and is close to that of the female cohorts born in the 1940s. The mean age at first marriage is increasing as well. The minimum mean age observed, in 1992–1993, was 23.9 for men and 21.7 for women. In 2004, as my estimate suggests, this indicator has increased to 26.1 for men and to 23.3 for women (Appendix, Table 17).
Figure 12: Abortion Rate (per 1,000 women 15–49) and Abortion Ratio (per 100 live births), Russia, 1959–2004
30 50 70 90 110 130 150 170 190
1955 1960 1965 1970 1975 1980 1985 1990 1995 2000 2005
P
e
r 10
00 wom
en 1
5
-49
100 125 150 175 200 225 250 275 300
P
er
1
0
0 l
iv
e bi
rt
hs
per 1000 women aged 15-49 per 100 live births
Source: Author’s calculations based on official data.
Table 5: Usage of contraceptive methods in Russia: selected survey data, percentage of women in reproductive ages using contraception
Region Year
W
it
hdrawal Rhy
thm
Vaginal
douche Condom
IUD
Hormonal
Ot
her
1. c. of Moscow 1982 14 30 17 21 11 4 4
2. Khaborovsky kray, rural* circa 1985 20.0 17.1 16.4 20.4 12.5 3.7 10.4 Tverskaya oblast, urban * 19.2 19.9 14.3 20.5 15.4 3.3 8.1 Chelyabinskaya oblast, urban* 20.3 20.5 18.7 16.7 11.7 2.4 10.8 3. c. of S.-Petersburg, c. of Kaluga 1988 18.4 24.4 14.7 16.9 24.4 3.3 Na 4.
Ivanovo oblast (urban+rural), c. of
Ekaterinburg, c. of Perm ** 1996 7.0 16.4 Na 17.1 42.3 10.3 6.8 Ivanovo oblast (urban+rural), c. of
Ekaterinburg, c. of Perm ** 1999 11.0 16.4 Na 21.9 34.2 11.0 5.5 5. Russia (RusGGS-2004)*** 2004 7.6 11.4 4.2 27.9 28.6 17.2 3.1
Source: (1) Popov et al. 1993; (2) Shneiderman 1991; (3) Kharkova 1994; (4) Goldberg et al. 1998, Goldberg and Serbanescu 2001; (5) Zakharov and Sakevich 2006.
Note: * Used contraception in the last two years; ** women having a partner; *** women having a partner, if a respondent reported several methods for this tabulation, the most effective method was chosen.
(1) 75% of women used any method at the time of survey; (2) in last two years before the survey, regularly used any method: 64% of women in Tverskaya oblast, 60% in Chelyabinsk oblast, and 57% in Khabarovsk kray. 14%, 15%, and 20% of women in corresponding regions never used contraception; (3) 59% of women at risk of pregnancy used any method at the moment of survey; (4) 71.9% of women used any method at the moment of survey in 1996, and 72.8% in 1999; (5) 83.8% used any method at the time of survey.
5. Conceptions of ideal and desired family size and differential
fertility in contemporary Russia
5.1 Ideal, desired, and actual family size
Figure 13: Mean ideal and mean desired number of children in a family. Russia, women aged 16 and older, nationally representative surveys of national opinion, 1991–2000
1.5 1.6 1.7 1.8 1.9 2.0 2.1 2.2 2.3
1991 1992 1993 1994 1995 1996 1997 1998 1999 2000 Year of Survey
Me
an
nu
mb
er
of
childr
e
n
"Ideal" number of children "Desired" number of children
Source: Surveys conducted by the Russian Centre for Public Opinion and Market Research (VCIOM). Bodrova V. (2002).
Note: "Ideal" number of children based on responses to question: "If one speaks of the 'ideal family’ then how many children do you think are in it?" Desired" number of children based on responses to question: "How many children in all, including those you already have, would you want to have, if you had all that is necessary for this situation?"
According to the latest representative survey (October 2006), the mean desired number of children per woman 18–34 years of age was 2.04 (58% would like to have two, one 21%, three or more 20%) (Arkhangelsky 2006). We may compare this data with the results of the survey carried out in the framework of the Population Microcensus of 1994, which took place under the evident influence of the social shock called forth by disappointment with the reforms: the mean desired number of children per woman 18–29 years of age was 1.78 (two children -- 52%, one -- 30%, three or more 13 %, none -- 5%) (Borisov 1997).
Thus we do not have any confirmation that Russian women's preferences have shifted in the direction of dominance of one child and childlessness.
Microcensus, which is compared with the estimate of the actual mean number of births for this same cohort, i.e. eight years later.In addition to data for Russia as a whole, the table also gives an estimate for two regions which represent two poles with respect to models of marital and family relations and fertility: a) the more traditional Dagestan, which has not completed the first demographic transition (a multi-ethnic republic in the Northern Caucasus, population 2.6 million, primarily of Muslim faith and with a very low proportion -- less than 5% -- Slavic); b) the capital city of Moscow, competing with St. Petersburg for the rank of territory with the lowest fertility and a population of 10.4 million, of which Russians, Ukrainians and Belorussians comprise almost 88%.
The first conclusion: the Russian population plans its fertility fairly well, in as much as the actual number of births does not strongly diverge from the expected number, according to the survey of eight years before. Muscovites achieve their goals the most consistently. But even in Dagestan, where effective family planning is notably much worse (modern contraceptive methods are less widespread, the attitude towards abortion less liberal), the overwhelming majority of families have the number of children they anticipated at the start of their reproductive cycle. And, moreover, the fulfilment of plans made in these or other socio-economic conditions is not a strict adherence to an unchanging programme.
The second conclusion is that the mass expectations of the population, formed in the very difficult economic conditions and low social expectations at the start of the 1990s deflated into pessimism. This is confirmed by the actual total fertility for the generation of women born in the second half of the 1960s, who turn out to have by the middle of the first decade of the 21st century not much more, but nonetheless more, than
Table 6: ‘Desired’ and ‘Expected’ mean number of children in a family of respondent (1994 Microcensus), and mean number of children actually born (2002 Census), female birth cohorts
1994 Microcensus 2002 Census
Birth cohort Age
‘Desired’ mean number*
‘Expected’ mean
number** Age Actual + extrapolated mean number***
Difference between “Expected”and “Desired”
Difference between Actual and “Desired”
Russia
1958–1962 31–35 1.99 1.85 40–44 1.83 –0.14 –0.16 1963–1967 26–30 1.87 1.66 35–39 1.73 –0.21 –0.14 1968–1972 21–25 1.74 1.47 30–34 1.62 –0.27 –0.12 City of Moscow
1958–1962 31–35 1.74 1.52 40–44 1.48 –0.22 –0.26 1963–1967 26–30 1.68 1.42 35–39 1.42 –0.26 –0.26 1968–1972 21–25 1.62 1.34 30–34 1.38 –0.28 –0.24 Dagestan Republic
1958–1962 31–35 3.08 2.93 40–44 2.81 –0.15 –0.27 1963–1967 26–30 2.74 2.58 35–39 2.63 –0.16 –0.11 1968–1972 21–25 2.61 2.40 30–34 2.42 –0.21 –0.19
Source: Marital status and fertility in Russia (according to the data of the 1994 Microcensus of the Population). Goskomstat of Russia. Moscow, 1995; Fertility. Results of the All-Russia 2002 Census of the Population. Volume 12, Rosstat. Moscow, 2005; Author’s calculations
Note: * ‘Expected’ number based on responses to question “How many children do you intend to have (including already present)?” ** ‘Desired’ number based on responses to question “What is your desired number of children?”
***To the actual number of children born by the 2002 Census is added the expected number of children, in accordance with current fertility statistics for 2002–2004.
Representatives of different social groups react in different ways to changes in social and economic realities. In Russia, as, by the way, in other countries, there are four basic factors differentiating fertility: marital or partnership status; geographical location (cities of different types, rural settlements); ethnic membership; and, educational status. The complex combination of these factors, expressed in population structures, is reflected in the regional and territorial variety of fertility Russia.
5.2 Regional variety in fertility
however, a tendency towards unification in fertility level predominated, and, currently, regional variety is lower than it was at the start of political and economic reforms.
In this way, the historical tendency toward reduction in interregional variation in fertility and regimes of population reproduction have been restored. (See Zakharov, 1994, Zakharov and Ivanova 1996). It is consequently possible to hypothesize that differential fertility, based on social indicators, will more likely decline rather than increase.
Figure 14: Regional mean TFR and coefficient of regional variation. Russia, 1989–2004.
10 12 14 16 18 20 22
1.0 1.2 1.4 1.6 1.8 2.0 2.2
Regional mean TFR
C
oe
ff
ic
ien
t o
f v
a
riat
io
n
(%
)
1989
2004
Source:Author’s calculations based on the Demographic Yearbook of Russia. Goskomstat/Rosstat. Moscow, corresponding years.
Note: Mean TFR is unweighted arithmetic mean for 79 administrative units of the Russian Federation; Coefficient of variation is ratio of standard deviation to arithmetic mean (%).
5.3 Differentials by marital status
change in marital status. As a result, the low overall fertility in Russia nowadays can be largely explained by the population’s sceptical attitude towards the advantages afforded by legal marriage. At the same time, informal partnership unions, which are rapidly becoming widespread, are still not seen by the majority of the population as an equally significant alternative to marriage in relationship to child-bearing.
Table 7: Period TFR for women in and out of legal marriage, and proportion
of legally married and unmarried women aged 15–49 and 18–34. Russia, 1993–1994 and 2003–2004
Year, age group All women
Women in registered
marriage*
Women out of registered marriage* 1993–1994
TFR 1.38 2.41 0.26
Distribution by marital status (percent)
15–49 100.0 61.1 39.9
18–34 100.0 61.5 39.5
2002–2003
TFR 1.29 2.01 0.36
Distribution by marital status (percent)
15–49 100.0 50.2 49.8
18–34 100.0 44.9 54.1
Source: Author’s calculations based on unpublished data of the 1994 Microcensus, of the 2002 Census, and birth statistics by marital status of women by single age group for corresponding years.
Note: Life-time TFR adjusted by expected duration in a specified uninterrupted marital status according to then-current marital structure by age (Microcensus 1994: expected duration of registered marriage by age of 50 was 21.2 years, and duration of being out of registered marriage, including never married, separated and widowed, was 13.8 years; Census 2002: 17.8 years and 17.2 years correspondingly).
5.4 Urban-rural differentials