University of New Orleans University of New Orleans
ScholarWorks@UNO
ScholarWorks@UNO
University of New Orleans Theses and
Dissertations Dissertations and Theses
5-14-2010
Molecular Probes for Biologically Important Molecules: A Study of
Molecular Probes for Biologically Important Molecules: A Study of
Thiourea, Hydroxyl radical, Peroxynitrite and Hypochlorous acid
Thiourea, Hydroxyl radical, Peroxynitrite and Hypochlorous acid
Sourav Chakraborty University of New Orleans
Follow this and additional works at: https://scholarworks.uno.edu/td
Recommended Citation Recommended Citation
Chakraborty, Sourav, "Molecular Probes for Biologically Important Molecules: A Study of Thiourea, Hydroxyl radical, Peroxynitrite and Hypochlorous acid" (2010). University of New Orleans Theses and Dissertations. 1132.
https://scholarworks.uno.edu/td/1132
Molecular Probes for Biologically Important Molecules: A Study of
Thiourea, Hydroxyl radical, Peroxynitrite and Hypochlorous acid
A Dissertation
Submitted to the Graduate Faculty of the University of New Orleans in partial fulfillment of the requirements for the degree of
Doctor of Philosophy in
Chemistry
by
Sourav Chakraborty
B. Sc. Chemistry (Honors) University of Calcutta, 1999
M.Sc. Wood Science and Technology, Forest Research Institute Deemed University, 2001
Acknowledgements
The journey from a small town of eastern India to University of New Orleans was not an
easy one. It could not have been a successful quest at all if I did not have the support of my
family and friends. I would like to share this milestone with my parents Sachindranath and Anita
Chakraborty, my wife Sanhita and my in laws Sadananda and Gita Hazra who have shown
immense faith and stood firm behind me during troubled and challenging times.
I have special thanks to my advisor Dr. Matthew Tarr for his unconditional guidance and
support during the dissertation writing. He unlocked the door of logic, helped me understand the
puzzles of science more clearly and stimulated my thoughts to pursue my goal all through out my
doctoral research career. During the last five and half years of research, he gave me freedom of
thoughts for which I shall remain ever grateful to him. I am proud to have him as my advisor.
My deepest appreciation goes to Dr. Yang Cai, who helped me understand the basis of
proteomics research and trained me to be a mass spectrometrist. Long discussions with him
always unraveled the fascinating threads of new and challenging problems. I am greatly indebted
to Dr. Richard Cole who was a great motivator and always a critical evaluator of my work to
provide excellent feedback.
Dr. Branko Jursic and Dr. Mark Trudell guided me through while I was stumbling with
synthesis and purifications of organic compounds. I would also like to thank Dr. Zeev
Rosenzweig for his critical evaluation of my research during general examination.
I extend my deepest gratitude to Dr. Vicki Colvin, Dr. James Tour and Rice University
for providing us lab and office space after hurricane Katrina. I am indebted to Dr. Alexander
grateful to Drs. Pijus Mandal and Gautam Biswas for their valuable suggestions with organic
synthesis and interpretation of NMR spectra of organic compounds.
Research Institute for Children, Children’s Hospital and their staff members always
shared their expertise and instrumentations during the last four years of my research at Cai lab. It
was a great pleasure to work with them.
Over the years, I have had the opportunity to work with an excellent group of colleagues
at Tarr and Cai lab. They enriched me both socially as well as scientifically. I would like to thank
Weixi Zheng, Sandra Lochhead, Anindya Pradhan, Brittany Oliva, Chanel Fortier, Curt Jarand,
Kaydian Vernon, Sarah Miller King, Gayatri Sahu, Ashley Quach, Arriel Wicks, Venkata
Kethineedi, Zhenzhen Mo and Jiang Qian for their help and support. It is a great pleasure to
thank each faculty and staff members of department of chemistry at UNO for their kind and
amicable approach during my stay at the department. I am deeply indebted to Dr. David Mobley
who shared his insight and gave me valuable suggestions which helped me choose my further
career.
Finally, I would like to thank all those who were not mentioned here but motivated me to
Table of Contents
List of Figures ... ix
List of Schemes... xiv
List of Tables ... xvi
List of Equations ... xviii
List of Abbreviations ... xix
Abstract ... xxi
Chapter 1. Introduction to fluorescence enhancement based fluoride sensing ... 1
1.1. Fluoride - friend or foe?... 1
1.2. Fluoride Detection ... 3
1.2.1. Ion selective electrode based detection of fluoride... 3
1.2.2. Fluorescence basics... 4
1.2.3. Example of typical fluorescence spectra... 7
1.2.4. Benefits of fluorescence measurements... 9
1.2.5. Fluorescence quenching and enhancement ... 11
1.3. Urea and thiourea in anion sensing ... 11
1.4. Fluoride Sensing ... 12
1.5. References... 20
Chapter 2. Fluoride detection based on fluorescence enhancement of naphthalene thioureido derivative... 24
2.1. Abstract ... 24
2.2. Introduction... 24
2.3. Experimental section... 37
2.3.1. Selected data for compound 1... 37
2.4. References... 39
3.2. Low density lipoproteins (LDL) ... 46
3.2.1. Lipoproteins ... 46
3.2.2. LDL function ... 46
3.2.3. Structure of apolipoprotein B-100 in LDL ... 49
3.3. Free radicals and other oxidants in physiological systems ... 50
3.3.1. Reactive oxygen species (ROS): Fenton Chemistry and hydroxyl radical... 50
3.3.2. Reactive Nitrogen Species (RNS)... 54
3.3.3. Peroxynitrite formation and reactions with proteins... 55
3.3.4. Hypochlorus acid (HOCl) ... 58
3.3.5. Biomacromolecule oxidation with HOCl ... 58
3.4. Apo B-100 oxidation in LDL... 59
3.4.1. Hydroxyl radical mediated direct oxidation of apo B-100 ... 59
3.4.2. Oxidation of amino acid via lipid intermediate ... 64
3.4.3. Peroxynitrite mediated oxidation of apo B-100 in LDL ... 67
3.4.4. Apo B-100 oxidation with hypochlorus acid ... 69
3.5. Atherosclerosis and oxidized LDL (ox-LDL)... 71
3.6. Targeted proteomics with LC-MS/MS based methodologies... 73
3.6.1. Database search... 75
3.6.2. Protein surface mapping by LC-MS/MS ... 77
3.6.3. LC-MS/MS studies on LDL... 77
3.7. Total hydroxyl radical quantitation... 78
3.8. Analysis of natural variants ... 81
3.8.1. What are natural variants? ... 81
3.8.2. Mass spectrometry database search on natural variants ... 81
3.9. References... 83
Chapter 4. Mapping oxidations of apo B-100 in human low density lipoprotein by LC-MS/MS 98 4.1. Abstract ... 98
4.2. Introduction... 99
4.3. Materials and methods ... 103
4.3.1. Quantitation of hydroxyl radical ... 103
4.3.4. MS setup ... 105
4.3.5. Database search... 106
4.4. Results... 106
4.4.1. Total hydroxyl radical quantitation using benzoic acid with HPLC... 107
4.4.2. Sequence coverage... 109
4.4.3. Oxidation of amino acid residues ... 111
4.4.4. Amino acid residues undergoing oxidation via lipid oxidation route... 122
4.4.5. Analysis of natural variants ... 124
4.5. Discussion ... 127
4.5.1. Methionine modification... 127
4.5.2. LDL oxidation... 128
4.6. Conclusions... 133
4.7. References... 135
Chapter 5. Hypochlorous acid and peroxynitrite treated apo B-100 in LDL: A study of the oxidized regions of LDL protein... 141
5.1. Abstract ... 141
5.2. Introduction... 143
5.3. Materials and methods ... 149
5.3.1. Synthesis of peroxynitrite ... 149
5.3.2. Characterization of peroxynitrite and quantification of 3-nitrotyrosine ... 150
5.3.3. Reagent hypochlorite characterization... 150
5.3.4. LDL oxidation... 151
5.3.5. LC-MS/MS of apo B-100 peptides ... 152
5.3.6. MS setup ... 153
5.3.7. Database search... 153
5.4. Results and discussion ... 154
5.4.1. Quantification of 3-nitrotyrosine with HPLC ... 154
5.4.2. Modification of apo B-100 by peroxynitrite... 156
5.4.3. Hypochlorous acid mediated oxidations of apo B-100... 158
5.5. References... 183
6.2. Future directions ... 191
6.3. References... 196
Appendix A... 198
Appendix B ... 203
List of Figures
Figure 1.1 Jablonski diagram. ... 6
Figure 1.2 An idealized fluorescence spectrum was shown. Both excitation and emission scans were depicted. Stokes shift was also pointed out... 8
Figure 1.3 Schematic of a fluorescence spectrophotometer. A 90° angle between incident light and the emitted light was depicted in the picture. Monochromators are wavelength selectors for excitation and emission beams.22... 10 Figure 1.4 Boron based analogue by Yamaguchi et. al.39 and aluminum based analogue reported by Badr et. al.40... 13 Figure 1.5 Calixarene based fluoride sensing molecule reported by Kim et. al.42... 13 Figure 1.6 Various thioureido analogues reported by Gunnlaugsson et. al.19, 27, 45. Both anthracene based receptors and thalimide based receptors were reported... 14
Figure 1.7 Thiourea compound reported by Nie and co-workers31. The compound showed fluorescence enhancement with acetate and fluoride... 15
Figure 1.8 Anthraquinone ureido and thioureido analogue reported by Jose et. al.48... 17 Figure 1.9 1,8-bis(phenylthioureido)naphthalene (Compound 1). ... 18
Figure 2.1 1H NMR spectra for compound 1. Frequency calculation data can be viewed at the end of the chapter in selective data for compound 1 section. DMSO was used as a NMR solvent. Two thioureido protons were missing from the spectra due to rapid exchange with the solvent. 26
Figure 2.2 13C NMR data for compound 1. Frequency calculation data can be viewed at the end of the chapter in selective data for compound 1 section. DMSO was used as NMR solvent... 27
Figure 2.3 MALDI-Mass spectrum of compound 1 in presence of 0.1 (M) AgNO3 solution. Mass of compound 1 is 428 amu. 535 amu and 537 amu masses were observed indicating the silver adduct formation. ... 28
Figure 2.4 Fluorescence spectra on fluoride addition to compound 1 in acetonitrile. Initial concentration of compound is 50 µM. Fluoride was added in 12.5 µM increments. Excitation wavelength = 345 nm; emission maximum = 447.5 nm... 29
Figure 2.5 Effect of chloride on compound 1 (50×10-6 M). 1 eq chloride per addition. A total of 9 eq of chloride was added. No perceptible change in the signal was observed. ... 30
Figure 2.7 Effect of iodide on compound 1 (50×10-6 M). 1 eq iodide per addition. A total of three eq of chloride was added... 31
Figure 2.8 Effect of dihydrogenphophate (H2PO4¯ ) on compound 1 (50×10-6 M). 1 eq H2PO4¯ per addition. A total of ten eq of H2PO4¯ was added. Slight increase in the signal was observed. ... 32
Figure 2.9 Effect of acetate on compound 1 (50×10-6 M). 1 eq acetate per addition. A total of ten eq of acetate was added... 32
Figure 2.10 Fluorescence enhancement with fluoride in presence of 1mM dihydrogenphophate (H2PO4¯ ) on compound 1 (50×10-6 M). 0.25 eq of fluoride per addition. A total of 2.5 eq of fluoride was added. Significant fluorescence enhancement after fluoride addition was observed. ... 33
Figure 2.11 Fluorescence enhancement with fluoride in presence of 1mM acetate (CH3COO¯ ) on compound 1 (50×10-6 M). 0.25 eq of fluoride per addition. A total of 2.5 eq of fluoride was added. Significant fluorescence enhancement after fluoride addition was observed. ... 33
Figure 2.12 : Partial 1H NMR (400 MHz) of compound 1 (5 mM) in DMSO-d6 upon the addition of tetrabutylammonium fluoride: (a) 0 µM, (b) 10 µM, (c) 20 µM, (d) 30 µM, and (e) 40 µM. .. 34
Figure 2.13 Absorbance of compound 1 (50 µM) before (green trace) and after 500 µM fluoride addition (red trace). ... 36
Figure 3.1 Deaths from Cardiovascular diseases chart. A decreasing trend after 1970 could be noted... 44
Figure 3.2 Trends in mean total serum cholesterol among adults of age 20 and older, by race/ethnicity survey. (NHANES: 1988-94, 1999-02. 2003-04, 2005-06)... 45
Figure 3.3 Schematic representation of an LDL particle. ... 47
Figure 3.4 Mechanism of LDL uptake by cells in the physiological systems. LDL was included in the cells after binding to LDL receptors. After going through Lysosomal degradation, cholesterol is released and used in cellular functions. ... 48
Figure 3.5 Free radical mediated oxidations of apo B-100 in LDL is shown in the above figure. Protein damage by both direct radical attack and lipid mediated intermediates were depicted. .. 61
Figure 3.6 Oxidized LDL formation in the endothelial cells and arterial intima. Ox-LDL was taken up by macrophages through scavenger receptor CD36. Lipid laden foam cell formation was depicted in the figure which showed high adhesion properties for binding to the arterial wall. ... 73
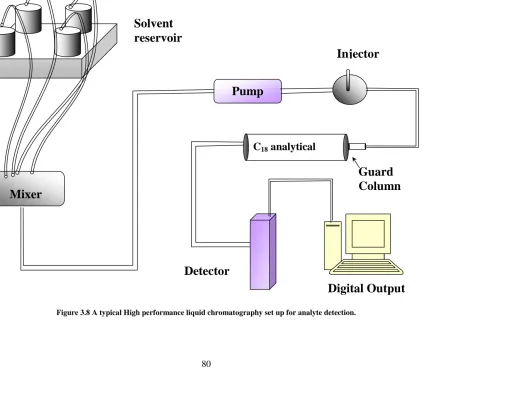
Figure 3.8 A typical High performance liquid chromatography set up for analyte detection. ... 80
Figure 4.1 Total hydroxyl radical produced by adding different hydrogen peroxide concentrations to 10 mM benzoic acid in the presence of 1 mM FeSO4.7H2O and 1 mM Na2EDTA in water. ... 108
Figure 4.2 Sequence coverage was represented by yellow region in apo B-100 sequence (P04114). Amino acid 1 through 4563 was shown in the above figure. “A” represents sample without H2O2 treatment (Blank). This sample was run twice and the sequence coverage data for both run was furnished. “B” represents low peroxide concentration exposure to LDL (9 µM) (duplicate experiment). “C” represents intermediate peroxide concentration (90 µM) (duplicate experiments). “D” represents exposure to high peroxide concentration (900 µM) (duplicate experiments). Sequence coverage decreases with increase in peroxide concentration. ... 110
Figure 4.3 MS/MS spectra of tryptic peptide 3996-4021 from low peroxide concentration depicting modification of 4019Phe (Phe+16 Da). Corresponding B- and Y- ions are shown. Unmodified peptide was not observed... 113
Figure 4.4 MS/MS spectra of tryptic peptide 1001-24 from low peroxide concentration depicting modification of 1020Tyr (Tyr+16 Da). Corresponding B- and Y- ions are shown. Unmodified peptide was observed and compared with. ... 114
Figure 4.5 MS/MS spectra of tryptic peptide 577-590 from low peroxide concentration depicting modification of 583Trp (Trp+32 Da). Corresponding B- and Y- ions are shown. Unmodified peptide was observed and compared with. ... 115
Figure 4.6 MS/MS spectra of tryptic peptide 4520–40 from low peroxide concentration depicting modification of 4529His (His+16 Da). Corresponding B- and Y- ions are shown. Unmodified peptide was not observed. ... 116
Figure 4.7 MS/MS spectra of tryptic peptide 655-69 from low peroxide concentration depicting modification of 663Pro (Pro+16 Da). Corresponding B- and Y- ions are shown. Unmodified peptide was observed, compared and accepted as partial modification... 117
Figure 4.8 Plot of observed apo B-100 oxidized amino acids by sequence number [P04114]. Lines indicate locations of amino acid modification by direct oxidation (upward line) and indirect oxidation/lipid mediated oxidation (downward line). Red, blue and green lines indicate observed oxidations at low, moderate and high peroxide concentrations, respectively. Black lines indicate oxidations observed at (low + high), turquoise represents (intermediate + high) and yellow represents (low + intermediate + high) hydrogen peroxide concentration. Numbers indicate amino acid residue in the apo B-100 sequence. ... 119
Figure 4.10 MS/MS spectra of tryptic peptide 2195-2210 from high peroxide concentration depicting modification of 2195Lys (K+138 Da) and 2208Lys (K+120 Da). Corresponding B- and Y- ions are shown. Unmodified peptide was not observed. ... 123
Figure 4.11 MS/MS spectra of tryptic peptide 2086–97 from untreated sample depicting presence of 2092Leu as a natural variant. Corresponding B- and Y- ions are shown. Ammonia loss from b5, b6, b7, b8, b9 was observed in the MS/MS spectra. ... 126
Figure 5.1 3-Nitrotyrosine formation from three different concentrations of peroxynitrite. An increase in 3-NT formation with increasing peroxynitrite concentration is apparent. Errors are represented as one standard deviation... 155
Figure 5.2 MS/MS spectra from tryptic peptide 1830-52. Tyr1840 was nitrated while Tyr1831 was hydroxylated. ... 160
Figure 5.3 MS/MS spectra from tryptic peptide 1499-1513 from low peroxynitrite treated samples. The only one cystein oxidation observed in peroxynitrite treated sample. Cys1505 (+48 Da) was oxidized in this peptide by peroxynitrite. ... 161
Figure 5.4 MS/MS spectra from tryptic peptide 2241-55 from intermediate peroxynitrite exposure. Trp2248 was oxidized to corresponding hydroxylated tryptophan. ... 162
Figure 5.5 MS/MS spectra from tryptic peptide 2523-34 from high peroxynitrite exposure. Tyr2524 was chlorinated. Met2523 and Met2526 were oxidized in this peptide... 163
Figure 5.6 MS/MS spectra from tryptic peptide 2523-34 from high peroxynitrite exposure (same run as the previous). Tyr2524 was now oxidized (+16 Da). Met2526 were oxidized in the same peptide. Since Met2523 is adjacent it will be difficult to coin the actual oxidation site. ... 164
Figure 5.7 MS/MS spectra from pronase peptide 1193-1202 from high hypochlorite exposure. Tyr1200 was chlorinated was (+34 Da). Notable factor in this peptide is presence of Lys1202 which can facilitate chloramines transfers. ... 167
Figure 5.8 MS/MS spectra from pronase peptide 4385-98 from high hypochlorite exposure. Trp4396 was oxidized to corresponding 2-oxindole (+16 Da) derivative by intermediate hypochlorous acid dose... 168
Figure 5.9 MS/MS spectra from tryptic peptide 3754-62 from intermediate hypochlorite exposure. Cys3761 was converted to cysteic acid (+48 Da). ... 169
Figure 5.10 MS/MS spectra from tryptic peptide 440-54 depicting chlorination of Tyr443 from high hypochlorite exposure. Tyr452 was not modified even though His453 and Lys454 in the vicinity. ... 170
Figure 5.12 MS/MS spectra of tryptic peptide 3293-3311 indicating monochlorination of Tyr3295 (+34 Da addition). ... 172
Figure 5.13 MS/MS spectra of tryptic peptide 3292-3311 depicting dichlorination of Tyr3295 (+68 Da). This peptide has even better match compare to the monochlorinated peptide... 173
Figure 5.14 MS/MS spectra from tryptic peptide 2535-59 depicting oxidation of Trp2553 and 2554 from high hypochlorite exposure. Corresponding B-/Y- ions are observed. ... 174
List of Schemes
Scheme 1.1. Dissociation of LaF3 in membrane electrode. ... 4 Scheme 1.2 Synthesis of 1,8 bis-(phenylureido) naphthalene analogue as presented by Xu et. al.46 and Cho et. al.47... 16 Scheme 1.3 Synthesis of 2,3 bis-(phenylureido) naphthalene analogue reported by Xu et. al.46. 16 Scheme 2.1 Synthesis of 1,8-bis(phenylthioureido)naphthalene (Compound 1). ... 25
Scheme 3.1 Mechanism of formation and detoxification of reactive oxygen species (ROS) in cells. ... 52
Scheme 3.2 Electrode potentials depicting the reactivity of different ROS. “Me” represents metal cation. More positive E depicts enhanced spontaneity in the reaction. ... 54
Scheme 3.3 Synthesis of nitric oxide from L-arginine in vascular endothelial cells and its reaction with superoxide to yield reactive peroxynitrite... 55
Scheme 3.4 Various reactions of peroxynitrite were depicted in the above scheme. Reaction of dissociation products of nitrosoperoxycarboxylate (a reaction product of peroxynitrite and carbon-di-oxide) to tyrosine was shown in the inset. Carbonate radical plays important role in the formation of 3-nitrotyrosine (3-NT). ... 57
Scheme 3.5 Oxidation of side chain of phenylalanine residue by hydroxyl radical yielding o-, m-, p- tyrosine (+16 Da) and dihydroxyphenylalanine (DOPA) (+32 Da). ... 62
Scheme 3.6 Oxidation of the side chain tyrosine residue by hydroxyl radical yielding dihydroxyphenylalanine (DOPA) (+16 Da). ... 62
Scheme 3.7 Histidine side chain oxidation product after reacting with hydroxyl radical (+16 Da). Corresponding ketone is more stable and shown in the scheme... 62
Scheme 3.8 Oxidation of tryptophan to Kynurenine (+4 Da) and N-formylkynurenine (NFK) (+32 Da). These products appear both in hydroxyl radical mediated oxidation as well as in presence of hypochlorus acid... 63
Scheme 3.9 Reaction of proline residue (in a generic peptide) with hydroxyl radical and formation of glutamic semialdehyde (+16 Da). ... 63
Scheme 3.10 4-Hydroxynonenal adduct (4-HNE) adduct on histidine residue (+156 Da). ... 65
Scheme 3.12 3-Nitrotyrosine (+45 Da) formation on peptides from peroxynitrite reaction on tyrosine side chain... 67
Scheme 3.13 Tryptophan nitration by peroxynitrite (+45 Da), 4, 5, 6-nitrotryptophan are all possible. ... 68
Scheme 3.14 Reactions of Tyrosine and hypochlorus acid to form of 3-chlorotyrosine (+34 Da) and 3, 5-dichlorotyrosine (+68 Da) in peptides and proteins... 70
Scheme 3.15 Methionine oxidation to methionine sulfoxide (+16 Da) is most common and can happen even with ambient oxygen... 70
Scheme 3.16 Oxidation of cystein (Cys) to cysteine sulfonic acid (+48 Da) in presence of HOCl. This product is also observed previously with peroxynitrite treated samples. ... 70
List of Tables
Table 4.1 List of oxidatively modified amino acids (hydroxyl radical mediated) previously reported in literature... 101
Table 4.2 Reported natural variants were compiled in seven small subsequence databases modified from published sequence (P04114) [http://srs.ebi.ac.uk/srsbin/cgi-bin/wgetz?-e+[UNIPROT:APOB_HUMAN]+-newId]. In order to efficiently identify the reported natural variants by MS/MS, these databases were constructed by incorporating a small group (3-10) of amino acid variants into the P04114 sequence. The sequence modification table given below demonstrates the subsequences [Seq mod 1, seq mod 2, and so on] created for database search. The natural variants observed by MS/MS in our LDL experiments are indicated by an asterisk (*). ... 125
Table 4.3 Modifications of amino acids observed in LDL exposed to three different hydroxyl radical concentrations. Numbers represent the position of the amino acid in the apoB sequence (P04114). All experiments were done in duplicate. The positions of the oxidized amino acids were compared with the control. The table includes only oxidations not also appearing in control experiments (no peroxide added). All modifications from each replicate were listed. ... 130
Table 4.4 List of natural variants observed in native and ox-LDL from LC-MS/MS experiments, for native LDL a total of two samples was analyzed. For ox-LDL six samples were analyzed and tabulated. ... 133
Table 5.1 Reported amino acid oxidations from literature and associated structural changes after oxidation by peroxynitrite.33, 35, 60-62... 147 Table 5.2 List of amino acid oxidations by hypochlorous acid. 36, 46, 48, 50, 63-66... 148 Table 5.3 Observed amino acid oxidations and associated mass changes from three different peroxynitrite exposures on LDL were tabulated. Trypsin was used as the proteolytic enzyme. All these modification are unique in nature. Sequence coverage was low in all experiments (data not shown)... 175
Table 5.4 Oxidation of amino acids with three different hypochlorous acid concentrations. Enzymatic digestion of apo B-100 was carried out by pronase. Results in the treated samples were compared with an untreated sample (blank containing no hypochlorous acid) were listed here... 176
Table A-1 List of peptides depicting various modifications observed in tryptic peptides (unique positive match) ]obtained from apo B-100 after low peroxide exposure (sample 1). ... 198
Table A-2 List of peptides depicting various modifications observed in tryptic peptides (unique positive match) obtained from apo B-100 after low peroxide exposure (sample 2)... 199
Table A-3 List of peptides depicting various modifications observed in tryptic peptides (unique positive match) obtained from apo B-100 after intermediate peroxide exposure (sample 3). Duplicate run (sample 4) did not reveal any unique peptide. ... 200
Table A-4 List of peptides depicting various modifications observed in tryptic peptides obtained (unique positive match) from apo B-100 after high peroxide exposure (sample 5) ... 201
Table A-5 List of peptides depicting various modifications observed in tryptic peptides (unique positive match) obtained from apo B-100 after high peroxide exposure (sample 6)... 202
Table B-1 List of peptides depicting various modifications observed in tryptic peptides (unique positive match) obtained from apo B-100 after low, intermediate and high peroxynitrite exposure. All matched peptides were listed in the following table. ... 203
Table B-2 List of peptides depicting various modifications observed in tryptic peptides (unique positive match) obtained from apo B-100 after another high peroxynitrite exposure. Unlike the last time four nitrotyrosines were nitrated. Relevant peptides were listed below. ... 204
Table B-3 List of peptides depicting various modifications observed in pronase digest (unique positive match) obtained from apo B-100 after low, intermediate and high hypochlorite exposure. All positive matches from duplicate experiments were shown below... 205
Table B-4 List of matched peptides after low hypochlorite treatment followed by a trypsin digestion of apo B-100. All peptides from duplicate analyses were shown. ... 206
Table B-5 List of matched peptides after intermediate hypochlorite treatment followed by a trypsin digestion of apo B-100. All peptides from duplicate analyses were shown. ... 207
List of Equations
Equation 3.1 ... 53
Equation 3.2 ... 53
Equation 3.3 ... 53
Equation 3.4 ... 53
Equation 3.5 ... 53
Equation 3.6 ... 53
Equation 3.7 ... 54
List of Abbreviations
3-NT 3-Nitrotyrosine
4-HBA 4-Hydroxybenzoic acid
4-HNE 4-Hydroxynonenal
ABC Ammonium Bicarbonate
ADA American Dental Association
AHA American Heart Association
Apo A-I Apolipoportein A-I
Apo B-100 Apolipoprotein B-100
Apo B-48 Apolipoprotein B-48
BLAST Basic Local Alignment Search Tool
CID Collision Induced Dissociation
Compound 1 1,8-bis(phenylthioureido)naphthalene
CVD Cardiovascular Diseases
DMSO Dimethyl sulfoxide
DOPA Dihydroxyphenylalanine
DTT Dithiothritol
EDTA Ethylenediammine Tetracetic Acid
e-NOS Endothelial Nitric Oxide Synthase
ESI-MS Electrospray Ionization – Mass Spectrometry
EST Express Sequence Tag
GC-MS Gas Chromatography – Mass Spectrometry
HACA 6-Hydroxy-2-aminocaproic acid
HAVA 5-Hydroxy-2-aminovaleric acid
H-bond Hydrogen bond
HDL High Density Lipoprotein
HNE-His 4-Hydroxynonenal – histidine adduct
HPLC High Performance Liquid Chromatography
LC-MS/MS Liquid Chromatography – Tandem Mass Spectrometry
LDL Low Density Lipoproteins
LTQ Linear Trapping Quadrupole
MALDI-TOF Matrix Assisted Laser Desorption Ionization – Time of Flight Mass
Spectrometry
MCO Metal Catalyzed Oxidation
MPO Myeloperoxidase
NFK N-formylkynurenine
NHLBI National Heart, Lung and Blood Institute
NMR Nuclear Magnetic Resonance spectrometer
Ox-LDL Oxidized Low Density Lipoprotein
PBS Phosphate Buffer Saline
PET Photon Induced Electron Transfer
PVDF Polyvinyldine Fluoride
RNS Reactive Nitrogen Species
ROS Reactive Oxygen Species
SDS-PAGE Sodium Dodecyl Sulfate – Polyacrylamide Gel Electrophoresis
SIN-1 3-morpholinosydnonimine hydrochloride
TBAF Tetrabutylammonium fluoride
TLC Thin Layer Chromatography
TMS Tetramethyl silane
TNF-α Tumor Necrosis Factor - α
WHO World Health Organization
Abstract
Numerous chemical species are important to the health of biological systems. Some
species can be beneficial at low doses and harmful at high doses. Other species are highly
reactive and trigger serious cell damage. Improved methods to detect the presence and activity
of such species are needed. In this work, several biologically important species were studied
using appropriate analytical techniques.
Fluoride is an important species in human physiology. It strengthens teeth and gives
protection against dental caries. However, elevated concentrations of fluoride in the body can
lead to health problems such as dental and skeletal fluorosis. Reported fluoride sensors used
fluorescence quenching methods in determining fluoride concentration. Our study explored
synthesis and characterization of 1,8-bis(phenylthioureido) naphthalene (compound 1) as a
fluoride sensing molecule. Compound 1 showed a remarkable 40 fold enhancement in
fluorescence with 5 eq of fluoride addition. Compound 1 also showed possibility of visual
colorimetric sensing with fluoride.
Free radical mediated oxidations of biomolecules are responsible for different
pathological conditions in the human body. Superoxide is generated in cells and tissues during
oxidative burst. Moderately reactive superoxide is converted to peroxyl, alkoxyl and hydroxyl
radicals by various enzymatic, chemical, and biochemical processes. Hydroxyl radical imparts
rapid, non specific oxidative damage to biomolecules such as proteins and lipids. Superoxide
also reacts with nitric oxide in cells to yield peroxynitrite, which is highly reactive and damages
biomolecules. Both hydroxyl radical and peroxynitrite readily react with amino acids containing
Low density lipoprotein (LDL) carries cholesterol in the human body. Elevated
concentration of LDL is a potential risk factor for atherosclerosis. Previous research drew a
strong correlation between oxidized low density lipoprotein (ox-LDL) and plaque formation in
the arterial wall. More importantly, oxidative damage causes structural changes to the LDL
protein (apo B-100) which might facilitate the uptake of LDL by macrophages. In this study
LDL was exposed to various concentrations of hydroxyl radical peroxynitrite and hypochlorite.
Thereafter oxidized amino acid residues in apo B-100 were mapped by LC-MS/MS methods. We
found widely distributed oxidative modifications in the apo B-100 amino acid sequence.
Keywords: fluoride, fluorescence enhancement, thiourea, chromogenic sensing, low
density lipoproteins (LDL), Fenton Chemistry, free radicals, hydroxyl radical, peroxynitrite,
Chapter 1.
Introduction to fluorescence enhancement based fluoride sensing
1.1.
Fluoride - friend or foe?
Fluoride is one of the most important elements of the periodic table. It belongs to the
halogen family (Group 17) of elements and showed high electronegativity. American Dental
Association (ADA) and World Health Organization (WHO) identified fluoride as one of the
most important elements in maintaining dental health.1 It helps in preventing dental caries. It also
gives protection against several other teeth and gum related diseases. Extensive research was
done on the ability of fluoride to prevent and combat against dental caries.2 This protection can
be achieved by multiple ways. Three chief mechanisms were previously reported in the
literature.2-6
• Inhibiting bacterial metabolism: Bacterial infection in the plaque region reduces the pH
of the plaque significantly. Fluoride from the plaque fluid readily combines with H+ and
yields HF. HF diffuses through the bacterial cell wall, acidifies the cell and releases
fluoride ion which inhibits enzymatic activities (enolase) inside the cell. The process
becomes cumulative due to the trapped fluoride.5, 7
• Inhibiting demineralization of the surface: Dentin or enamel crystals markedly adsorb
fluoride in their crystal surfaces thereby prevent dissolution of the teeth by acid.
Supplemental fluoride plays a critical role in this process. Incorporated fluoride is not
sufficient to prevent dental caries and fluoride supplement all through out the life span is
• Remineralization of the surface: In the cary lesion, fluoride from topical sources helps
in nucleating and remineralizing the partially demineralized surface by forming
fluorapatite [FAP: Ca10(PO4)6F2] which is less soluble than carbonated hydroxyapatite.6
However, elevated concentrations of fluoride can lead to several physiological symptoms.
Long term exposure to fluoride may cause dental, skeletal and crippling skeletal fluorosis. In
severe cases it leads to mottled and disfigured teeth. Also it increases bone density in case of
skeletal fluorosis. Therefore it makes the bone fragile and susceptible to fracture particularly at
the joints. One of the major problems with fluoride in the physiological system is the inability of
the system to remove fluoride by biochemical pathways.
Also, high concentrations of fluoride can initiate multiple problems in plants, aquatic and
marine environment. Aluminum fluoride can also play critical role in cellular biochemistry of
plants and animals.8
Additional resources provided results that were even more alarming and uncomforting.
Ayoob & Gupta’s most informative review9 on fluoride contaminated ground water revealed that
long term exposure to low level of fluoride (0.5, 0.7, 2.8 ppm) can cause wide geochemical
disease such as fluorosis. An interesting recent review on a book was published in Chemical and
Engineering News10 regarding fluoridation of water.11 Unfortunately, the book could not remain unbiased. It was coined that the book instead of revealing a clear picture took sides in favor of
fluoridation.
In recently published notes, the World Health Organization (WHO) recommended the
fluoride level of drinking water should be 1.5 mg/L (ppm).1 Interestingly, United States
Environmental Protection Agency (EPA) does not regulate the addition of fluoride to water.
only in water systems with naturally occurring fluoride level above the established regulatory
limits (≥2.0 ppm).12
The objective of this research, in this regard, is not to raise a new debate on fluoride, but
rather to emphasize the fact that the concentration of fluoride is extremely important in
physiological and environmental systems. Improved analytical methodology is necessary to
address some of the related problems in fluoride detection.
1.2.
Fluoride Detection
Anions are important in physiological and environmental systems13-17. Various methods
exist for determination of fluoride and other anions in solutions.13, 18, 19 Most commonly used
methods are ion selective electrodes (ISE)20, 21 and photoluminescence. Photoluminescence
methods are based on absorbance and fluorescence. In this chapter we will mostly discuss
fluorescence based methodologies over other methods.
1.2.1.
Ion selective electrode based detection of fluoride
Lanthanum fluoride, LaF3 is widely used as a crystalline membrane electrode for
determining the fluoride ion.22 Europium fluoride (EuF2) can enhance its semiconductor
property. The mechanism of the development of fluoride sensitive response (potential) are very
similar to glass or pH sensitive membranes. In short, in the membrane interface ionization
creates a charge on the membrane surface as shown by the following scheme (Scheme 1.1). The
magnitude of the charge depends on the activity (commonly termed as concentration) of the
Scheme 1.1. Dissociation of LaF3 in membrane electrode.
Commercially available LaF3 electrodes are rugged and can be operated in the range of 0
– 80 °C. The response is linear down to micromolar (106 M ~ 0.02 ppm) concentration.22 The
anionic interferences come from hydroxide ion. Other polyvalent cations can interfere in the
measurements too by disrupting the chemical equilibria for the fluoride in solution. Basicity of
F¯ can cause problems at lower pH. Thus the measurements for ISE’s are best within the pH
range of 5 – 9. Also, ISE theoretically measures activity of the ions in solutions not the actual
concentration.
Fluorescence based anion detection were a popular alternative to ISE in determining
anions in solutions. Both fluorescence and absorbance methods are extensively employed to
determine fluoride and other anion affinity towards various organic chromophores.
1.2.2.
Fluorescence basics
Matter can absorb and re-emit light by the phenomenon called luminescence.
Fluorescence and phosphorescence are the two different types of luminescence. Fluorescence
involves emission from a singlet excited state to a singlet ground state. In phosphorescence, the
emission involves a transition from a triplet excited state to a singlet ground state. Beacause the
spin flip results in a forbidden transition, the lifetime of phosphorescence is considerably longer
than that for fluorescence. Fluorescence lifetimes are around 10-8 sec, while those for
phosphorescence are 10-3 to 1 sec or sometimes even longer. Most interestingly, in fluorescence,
the energy of the emitted photons is at longer wavelength than that of the absorbed photons. LaF3 LaF2 F
Some of the absorbed energy of the photons was channeled into other processes (vibrational
level, phonons, thermal energy). The resulting emission wavelength is therefore longer (lower
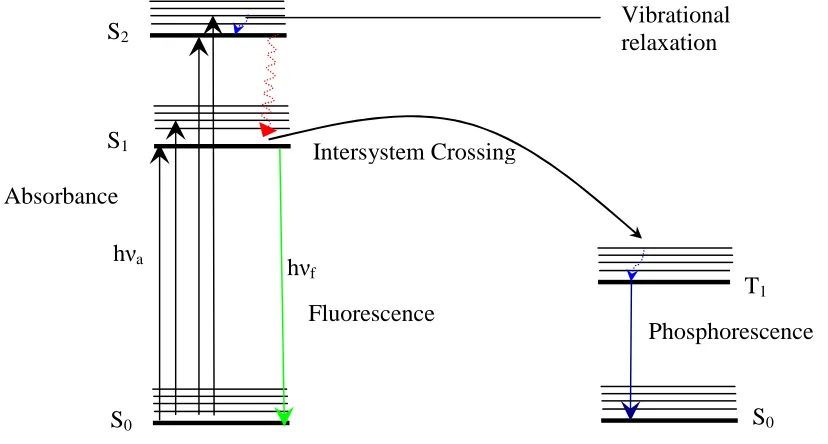
energy). The process is detailed in the energy diagram below called Jablonski diagram (Figure
1.1).22, 23
A photon with frequency ν and energy hνa was absorbed by the ground state (S0)
fluorophore (fluoresceing moiety) (typically 10-15 sec) and reached its singlet excited state S1 or
S2. At higher energy levels internal conversion (10-12 sec) occurs when the photons passes from
higher vibronic level to lower vibronic levels (blue dotted arrows). Also non radiative (red dotted
arrows) processes are associated with transfer of photons from high energy singlet state S2 to
lower energy singlet state S1. In short, the molecule will partially relax and reach the excited
state singlet state S1. It can further relax back to the ground state by emitting a photon of energy
hνf (which is of longer wavelength and lower energy than hνa) and show fluorescence
(represented by solid green arrow). Stokes shift is described as a shift to longer wavelength due
to vibrational relaxation and internal conversion. Fluorescence lifetime typically is 10-5 seconds
Figure 1.1 Jablonski diagram.
Intersystem Crossing
hνf hνa
S1 S2
S0
T1
S0 Phosphorescence Fluorescence
Vibrational relaxation
In phosphorescence, through an inter system crossing (ISC), a spin conversion of the
molecule from excited state singlet S1 to its triplet state (T1). This transfer represents a spin
forbidden transition. Due to spin-forbidden transition, phosphorescence (represented by a navy
blue arrow) lifetime is much longer than that of fluorescence life time. Chemiluminiscence is a
related emission process in which the excited state is achieved through a chemical reaction
instead of a photon absorbance. Once formed, the electronic excited state in chemiluminiscence
behaves the same as those observed in fluorescence.
Fluorescence has several different advantages over other analytical techniques.20-23 It is a
non-invasive technique in the first place. The detection limit can easily reach nanomolar to
sub-nanomolar levels. Fluorescence gives at least one to three orders of magnitude better detection
limits than that of absorbance.23 Also fluorescence has longer linear dynamic range compare to
absorbance spectroscopy. Fluorescence is also more selective because not all compounds
fluoresce. The compounds which show fluorescence have characteristic emission wavelength.
1.2.3.
Example of typical fluorescence spectra
A fluorescence emission spectrum is obtained by scanning emission wavelength with a constant
excitation wavelength (often at the absorbance maximum). An excitation spectrum can be
obtained by scanning the excitation wavelength while keeping the emission wavelength constant.
An idealized depiction of the excitation and emission spectrum is shown above. The
peak-to-peak distance between excitation and emission maximum was considered as Stokes Shift (Figure
Figure 1.2 An idealized fluorescence spectrum was shown. Both excitation and emission scans were depicted. Stokes shift was also pointed out.
Wavlength (nm) Stokes Shift
A B S O R B A N C E
F L U O R E S C E N C E Excitation maximum
1.2.4.
Benefits of fluorescence measurements
Fluorescence measurement exhibits some outstanding benefits over absorbance
techniques, primarily because it is based on a dark background. In a typical fluorescence
spectrophotometer the detector is placed at a 90° angle relative to the light source (Figure 1.3),
while in absorbance the setup is 180°. A 90° configuration minimizes the transmission and
reflection of non-fluorescent light reaching the detector. In other words scattered light does not
interfere with the experiment.22 The signal to noise (S/N) ratio is substantially enhanced, and an
approximately 10,000 times better detection limit can be achieved with a 90° setup.22, 23 The
excitation and emission monochromators are wavelength selectors which allow specific
wavelength to pass before and after the fluorescence events. Most interestingly, fluorescence
detection is highly sensitive due to a cyclic process which gives the instrument a better detection.
The same fluorophore when excited in a cyclic way can release thousands of photons during
detection. For absorbance the cyclic method does not yield any improvements since the detector
is in the same line with the light source.
Several different factors contribute to the fluorescence of a particular moiety. In general,
a rigid structure, extended conjugation and planarity in the fluorescing moiety play a crucial role
for a fluorophore to fluoresce.24 In addition; excitation and emission spectra also depend upon
Figure 1.3 Schematic of a fluorescence spectrophotometer. A 90° angle between incident light and the emitted light was depicted in the picture. Monochromators are wavelength selectors for excitation and emission beams.22
Slit Sample
Emission light beam
Excitation light beam
Source
Monochromator
Monochromator
1.2.5.
Fluorescence quenching and enhancement
The Term fluorescence quenching is related to the decrease in fluorescence of a
fluorescing moiety by any process. Several different processes including excited state reaction,
molecular rearrangements, energy-transfer, ground state complex formation and collisional
quenching can cause quenching of fluorescence signal.23
Collisional quenching is often termed as dynamic quenching as it involves the direct
encounter of the excited state fluorophore to the quencher in a dynamic way. When the
fluorophore interacts very strongly with the quencher and forms a non-fluorescent complex, it is
known as a static quencher.23 However, increase in fluorescence after complexation between the
fluorophore and the interacting ligand can also occur and has advantages. Such interactions
improve the signal to noise ratio. A lower limit of detection can also be achieved in the case of
fluorescence enhancement compared to quenching. Fluorescence reveals pertinent information
about the change in the electronic and molecular configuration during the fluorophore-ligand
interaction.
1.3.
Urea and thiourea in anion sensing
Hydrogen bonding was depicted as one of the most crucial events in anion sensing with
urea and thiourea.18, 19, 25-31 Highly electronegative atoms such as oxygen, nitrogen and fluorine
interact strongly with hydrogen forming a stronger interaction than dipole-dipole interactions.
The interaction is however weaker than the regular ionic or covalent bond. Previous researches
revealed the potential hydrogen-bond (H-bond) donor capability of urea and thiourea.19, 26, 27, 30-32
Stephan and co workers33 incorporated urea bond in lipophilic dendrimers. These unique
dendrimers showed classical host-guest chemistry in separating anions from aqueous solutions33.
Xie and co-workers34 reported a tripodal naphthylurea based moiety which fluoresces selectively
in the presence of dihydrogen phosphate (H2PO4¯ ). Nam et. al.35 explored a calix[4]diquinone compound where urea is appended in the structure of the compound. Interestingly, this
compound showed selective affinity towards HSO4¯ over H2PO4¯ , Cl¯ and CH3CO2¯ . In a
related but slightly different subject, a complex calix[4]arene based thiourea compound was
synthesized which showed better efficiency in transporting CsCl and KCl than other cation or
anion receptors.36
1.4.
Fluoride Sensing
Over the past few decades, several different fluoride sensing molecules were reported in
the literature.13, 17-19, 25, 37, 38 Boron, aluminum and calixarene based compounds showed
promising results. Yamaguchi and coworkers reported a boron based anthracene compound
where the boron π-orbital accepts electrons from fluoride39 (Figure 1.4). The extensively
conjugated boron anthracene compounds were highly colored. With these compounds,
fluorescence quenching was observed with fluoride. Also a dramatic color change indicated the
Figure 1.4 Boron based analogue by Yamaguchi et. al.39 and aluminum based analogue reported by Badr et.
al.40
Aluminum binds strongly to fluoride. Aluminum porphyrin based compounds can be
useful in sensing fluoride in solution. A thin polymer based sensor using aluminum (III)
octaethylporphyrin was reported (Figure 1.4) that can detect fluoride in the micromolar to
submicromolar range. This methodology, however, was based on absorbance detection.40
OH OH
O N N
O
O HN
NH O
N N
NO2 NO2
42
B
R
1R
2R
1= R
2= 9-anthryl
R1= 9-anthryl, R2= mesityl
R
1= R
2= mesityl
N N N
Several different calixarene based molecules functionalized by urea and thiourea moieties
were reported in the last two decades. Kim et. al. reported more than one calix[4]arene molecule
which can behave as cation as well as anion sensors.43 In 2006, a urea functionalized
calix[4]arene based molecule was synthesized (Figure 1.5) which showed excimer emission as
well as an increase in fluorescence in the presence of fluoride.44 However, it was apparent that
the amount of fluoride added was significantly high. Esteban-Gomez et. al. reported urea based
supramolecular compounds which showed color development in the presence of various
anions.26
Figure 1.6 Various thioureido analogues reported by Gunnlaugsson et. al.19, 27, 45. Both anthracene based receptors and thalimide based receptors were reported.
Ureido protons are somewhat acidic in nature. Highly basic anions such as fluoride or
acetate can easily abstract two hydrogen atoms from the urea bond. Although absorbance
represented poor detection limit compare to fluorescence, the possibility of chromogenic sensing
had revealed some interesting new sights in urea based sensing. Gunnlaugsson’s pioneering work
interact strongly with fluoride by strong hydrogen bond formation involving the ureido or
thioureido hydrogens. In the same context these groups also reported several different
naphthalimide based receptors which can be used for fluoride sensing based on absorbance as
well as fluorescence.19 These receptors work following the photoinduced electron transfer (PET)
mechanism.45 Several anthracene and naphthalimide based urea and thiourea moieties (Figure
1.6) were studied for fluoride, acetate, hydrogen phosphate and other halides. Both absorbance
and fluorescence results were presented for ureido and thioureido compounds. The majority of
these compounds showed PET based quenching which was originated from fluoride binding
leading to conformational changes in the respective compounds.19
N H3C
H3C HN NH
O
S
NH
NO2
Figure 1.7 Thiourea compound reported by Nie and co-workers31. The compound showed fluorescence enhancement with acetate and fluoride.
Nie and coworkers31 over the years reported several phenyl thiourea based compounds
(Figure 1.7) which showed fluorescence enhancement or quenching in the presence of acetate
even over fluoride.28, 30, 31 In most cases a clearly defined isosbestic point23 was observed after
addition of the host. This indicated the change in conformational structure after binding to the
host. Some of these studies showed fluorescence enhancement in presence of the analyte.
Scheme 1.2 Synthesis of 1,8 bis-(phenylureido) naphthalene analogue as presented by Xu et. al.46 and Cho et.
al.47
Scheme 1.3 Synthesis of 2,3 bis-(phenylureido) naphthalene analogue reported by Xu et. al.46
Naphthalene is a substantially rigid molecule with extended conjugation. Cho et. al.47 studied phenylurea immobilization on diaminonaphthalene based systems. Their work was
focused on chromogenic sensing of anions. Therefore the research was mostly emphasized on
absorbance measurement while the whole new vista of fluorescence remained unexplored. Xu et.
al.46 synthesized phenylurea analogues of 1,8-diaminonapththalene (Scheme 1.2) and . 2,3-diaminonaphthalene (Scheme 1.3). 1,8-bis(phenylureido)naphthalene showed fluorescence
enhancement with fluoride while the 2,3-analogue did not reveal any promising results. It was
indicated that the presence of fluoride could induce planarity to the 1,8-analogue to yield
extended conjugation and fluorescence enhancement. Jose and coworkers48 reported urea and
thiourea based anthraquinone compounds (Figure 1.8) which can act as a fluoride sensing
fluoride to the respective ureido and thioureido analogues. However fluorescence behavior of the
mentioned ureido and thioureido analogues were not explored extensively in Jose’s study.
X : O, S
O
O
HN
H
N HN HN
X X
Figure 1.8 Anthraquinone ureido and thioureido analogue reported by Jose et. al.48
Considering the above mentioned approaches we have synthesized
1,8-(bisphenylthioureido)naphthalene49 (Compound 1) as a potent fluoride sensing molecule (Figure
1.9). The compound was characterized by 1H, 13C NMR and MALDI-Mass spectrometry.
Fluorescence experiments were performed on the compound in the presence of fluoride and other
halides. Acetate and hydrogen phosphate were also added. A remarkable 40 fold enhancement in
fluorescence signal was observed in the presence of 5 equivalence of fluoride in acetonitrile.49 It
was selective to fluoride over other halides. Hydrogenphosphate and acetate did show
enhancement in fluorescence, but the increase in fluorescence signal was small compared to
fluoride. From the structure it is evident that four thioureido protons can interact strongly with
fluoride, which is small and has a high charge density.
In addition, Compound 1 (Figure 1.9) showed promising results (Chapter 2) in the area
fluoride in acetonitrile. The change in color was visually perceptible at high concentration of
fluoride.
NHHN S S
NH HN
Figure 1.9 1,8-bis(phenylthioureido)naphthalene (Compound 1).
Binding affinity of fluoride to the thioureido protons were discussed in previously
published articles.19, 44 Plausibly, the twisted structure of naphthalene, particularly after
isothiocyanate immobilization, could achieve higher degree of planarity in the presence of
fluoride ion. Fluoride being small could gain a high degree of accessibility to the thioureido
protons thereby enhancing the ability to form strong H-bond with the molecule. Remarkable
fluorescence enhancement after addition of fluoride to compound 1 suggests that interaction
with fluoride was forcing the twisted structure to become planar. In ureido compounds energy
minimization calculation (AM 1) supports the conformational changes around the naphthalene
ring for better planarity.46 In anthraquinone based thioureido analogues Jose et. al.48 calculated relevant energy minimization data (AM 1). Jose’s calculation revealed the insight that fluoride,
being the smallest among the halides, will reach closer to the thioureido protons. The other
halides being bigger could not fit themselves properly in the space near thioureido protons.
Compound 1 gives several advantages over the other reported fluoride sensing
molecules. While a large number of fluoride sensing molecule were based upon fluorescence
acetate or hydrogen phosphate can interfere slightly, although it can not completely undermine
1.5.
References
(1) Fawell, J. K.; Bailey, K.; Organization, W. H., Fluoride in drinking-water. World Health Organization: 2006.
(2) Featherstone, J. D., The science and practice of caries prevention. J. Am. Dent. Assoc.
2000, 131 (7), 887-899.
(3) Featherstone, J. D.; Glena, R.; Shariati, M.; Shields, C. P., Dependence of in vitro demineralization of apatite and remineralization of dental enamel on fluoride concentration. J. Dent. Res. 1990, 69 Spec No, 620-625; discussion 634-636-620-625; discussion 634-636.
(4) ten Cate, J. M.; Featherstone, J. D. B., Mechanistic Aspects of the Interactions Between Fluoride and Dental Enamel. Crit. Rev. Oral Biol. Medicine 1991, 2 (3), 283-296.
(5) Featherstone, J. D., Prevention and reversal of dental caries: role of low level fluoride. Community Dent. Oral Epidemiol. 1999, 27 (1), 31-40.
(6) Featherstone, J. D.; Lussi, A., Understanding the chemistry of dental erosion. Monogr. Oral Sci. 2006, 20, 66-76.
(7) Van Loveren, C., The antimicrobial action of fluoride and its role in caries inhibition. J. Dent. Res. 1990, 69 Spec No, 676-681; discussion 682-683-676-681; discussion 682-683. (8) Camargo, J. A., Fluoride toxicity to aquatic organisms: a review. Chemosphere 2003, 50
(3), 251-264.
(9) Ayoob, S.; Gupta, A. K., Fluoride in drinking water: a review on the status and stress effects. Crit. Rev. Environ. Sci. Technol. 2006, 36 (6), 433-487.
(10) Erickson, B. E., Never Ending Controversy. Chem Eng News 2009, 87 (36), 72-74.
(11) Jacobs, J. A., The Fluoride Wars: How a Modest Public Health Measure Became America's Longest-Running Political Melodrama. Ground Water 2009.
(12) Populations Receiving Optimally Fluoridated Public Drinking Water--United States, 2000. JAMA 2002, 287 (16), 2071-2072.
(13) Gale, P. A., Anion and ion-pair receptor chemistry: highlights from 2000 and 2001. Coord. Chem. Rev. 2003, 240 (1-2), 191-221.
(16) Sessler, J. L.; Davis, J. M., Sapphyrins: versatile anion binding agents. Acc. Chem. Res.
2001, 34 (12), 989-997.
(17) Suksai, C.; Tuntulani, T., Chromogenic anion sensors. Chem. Soc. Rev. 2003, 32 (4), 192-202.
(18) Gale, P. A., Anion receptor chemistry: highlights from 1999. Coord. Chem. Rev. 2001, 213 (1), 79-128.
(19) Gunnlaugsson, T.; Glynn, M.; Tocci, G. M.; Kruger, P. E.; Pfeffer, F. M., Anion recognition and sensing in organic and aqueous media using luminescent and colorimetric sensors. Coord. Chem. Rev. 2006, 250 (23+24), 3094-3117.
(20) Skoog, D. A.; West, D. M.; Holler, F. J.; Crouch, S. R., Fundametals of Analytical Chemistry. 8th ed.; Thomson: Singapore, 2004.
(21) Willard, H. H.; Lynne L. Merritt, J.; Dean, J. A.; Settle, F. A., Instrumental Methods of Analysis. 7th ed.; CBS: New Delhi, 2006.
(22) Skoog, D. A.; Holler, F. J.; Nieman, T. A., Principles of Instrumental Analysis. 5th ed.; Thomson: Singapore, 2003.
(23) Lakowicz, J. R., Principles of fluorescence spectroscopy. Springer: 2006.
(24) Lakowicz, J. R., Topics in Fluorescence Spectroscopy: Probe design and chemical sensing. Springer: 1994.
(25) Paul D. Beer; Philip A. Gale, Anion Recognition and Sensing: The State of the Art and Future Perspectives. Angew. Chem. Int. Ed. 2001, 40 (3), 486-516.
(26) Gomez, D. E.; Fabbrizzi, L.; Licchelli, M.; Monzani, E., Urea vs. thiourea in anion recognition. Org. Biomol. Chem. 2005, 3 (8), 1495-1500.
(27) Gunnlaugsson, T.; Kruger, P. E.; Jensen, P.; Tierney, J.; Ali, H. D. P.; Hussey, G. M., Colorimetric "Naked Eye" Sensing of Anions in Aqueous Solution. J. Org. Chem. 2005, 70 (26), 10875-10878.
(28) Wu, F.-Y.; Li, Z.; Guo, L.; Wang, X.; Lin, M.-H.; Zhao, Y.-F.; Jiang, Y.-B., A unique NH-spacer for N-benzamidothiourea based anion sensors. Substituent effect on anion sensing of the ICT dual fluorescent N-(p-dimethylaminobenzamido)-N'-arylthioureas. Org. Biomol. Chem. 2006, 4 (4), 624-630.
(30) Zhang, X.; Guo, L.; Wu, F.-Y.; Jiang, Y.-B., Development of Fluorescent Sensing of Anions under Excited-State Intermolecular Proton Transfer Signaling Mechanism. Org. Lett. 2003, 5 (15), 2667-2670.
(31) Nie, L.; Li, Z.; Han, J.; Zhang, X.; Yang, R.; Liu, W.-X.; Wu, F.-Y.; Xie, J.-W.; Zhao, Y.-F.; Jiang, Y.-B., Development of N-Benzamidothioureas as a New Generation of Thiourea-Based Receptors for Anion Recognition and Sensing. J. Org. Chem. 2004, 69 (19), 6449-6454.
(32) Quinlan, E.; Matthews, S. E.; Gunnlaugsson, T., Anion sensing using colorimetric amidourea based receptors incorporated into a 1,3-disubstituted calix[4]arene. Tetrahedron Lett. 2006, 47 (52), 9333-9338.
(33) Stephan, H.; Spies, H.; Johannsen, B.; Klein, L.; Vogtle, F., Lipophilic urea-functionalized dendrimers as efficient carriers for oxyanions[dagger][double dagger]. Chem. Commun. 1999, (18), 1875-1876.
(34) Xie, H.; Yi, S.; Yang, X.; Wu, S., Study on host-guest complexation of anions based on a tripodal naphthylurea derivative. New J. Chem. 1999, 23 (11), 1105-1110.
(35) Nam, K. C.; Kang, S. O.; Jeong, H. S.; Jeon, S., Urea derivative of calix[4]diquinone: HSO4− ion selective receptor. Tetrahedron Lett. 1999, 40 (41), 7343-7346.
(36) Chrisstoffels, L. A. J.; de Jong, F.; Reinhoudt, D. N.; Sivelli, S.; Gazzola, L.; Casnati, A.; Ungaro, R., Facilitated Transport of Hydrophilic Salts by Mixtures of Anion and Cation Carriers and by Ditopic Carriers. J. Am. Chem. Soc. 1999, 121 (43), 10142-10151.
(37) Gale, P. A.; Quesada, R., Anion coordination and anion-templated assembly: Highlights from 2002 to 2004. Coord. Chem. Rev. 2006, 250 (23-24), 3219-3244.
(38) Anzenbacher, P.; Jursikova, K.; Sessler, J. L., Second Generation Calixpyrrole Anion Sensors. J. Am. Chem. Soc. 2000, 122 (38), 9350-9351.
(39) Yamaguchi, S.; Akiyama, S.; Tamao, K., Colorimetric fluoride ion sensing by boron-containing pi-electron systems. J. Am. Chem. Soc. 2001, 123 (46), 11372-11375.
(40) Badr, I. H. A.; Meyerhoff, M. E., Highly Selective Optical Fluoride Ion Sensor with Submicromolar Detection Limit Based on Aluminum(III) Octaethylporphyrin in Thin Polymeric Film. J. Am. Chem. Soc. 2005, 127 (15), 5318-5319.
(41) Chiu, C. W.; Gabbai, F. P., Fluoride ion capture from water with a cationic borane. J. Am. Chem. Soc. 2006, 128 (44), 14248-14249.
(43) Kim, J. Y.; Kim, G.; Kim, C. R.; Lee, S. H.; Lee, J. H.; Kim, J. S., UV band Splitting of chromogenic azo-coupled calix[4]crown upon cation complexation. J. Org. Chem. 2003, 68 (5), 1933-1937.
(44) Kim, Y.-J.; Kwak, H.; Lee, S. J.; Lee, J. S.; Kwon, H. J.; Nam, S. H.; Lee, K.; Kim, C., Urea/thiourea-based colorimetric chemosensors for the biologically important ions: efficient and simple sensors. Tetrahedron 2006, 62 (41), 9635-9640.
(45) Gunnlaugsson, T.; Davis, A. P.; O'Brien, J. E.; Glynn, M., Synthesis and photophysical evaluation of charge neutral thiourea or urea based fluorescent PET sensors for bis-carboxylates and pyrophosphate. Org. Biomol. Chem. 2005, 3 (1), 48-56.
(46) Xu, G.; Tarr, M. A., A novel fluoride sensor based on fluorescence enhancement. Chem. Commun. 2004, (9), 1050-1051.
(47) Cho, E. J.; Moon, J. W.; Ko, S. W.; Lee, J. Y.; Kim, S. K.; Yoon, J.; Nam, K. C., A New Fluoride Selective Fluorescent as Well as Chromogenic Chemosensor Containing a Naphthalene Urea Derivative. J. Am. Chem. Soc. 2003, 125 (41), 12376-12377.
(48) Jose, D. A.; Kumar, D. K.; Ganguly, B.; Das, A., Efficient and Simple Colorimetric Fluoride Ion Sensor Based on Receptors Having Urea and Thiourea Binding Sites. Org. Lett. 2004, 6 (20), 3445-3448.
(49) Chakraborty, S.; Tarr, M. A., Fluoride detection based on fluorescence enhancement of thioureido naphthalene derivative. Can. J. Chem. 2007, 85 (2), 153-156.
(50) Pfeffer, F. M.; Gunnlaugsson, T.; Jensen, P.; Kruger, P. E., Anion Recognition Using Preorganized Thiourea Functionalized [3]Polynorbornane Receptors. Org. Lett. 2005, 7 (24), 5357-5360.
Chapter 2.
Fluoride detection based on fluorescence enhancement of
naphthalene thioureido derivative
2.1.
Abstract
A novel thioureido naphthalene derivative was synthesized and characterized. The
compound proved itself as an effective fluoride sensor with respect to selectivity and sensitivity.
In acetonitrile, the fluorescence intensity increased 40 fold with addition of 5 equivalents of
fluoride. Fluorescence intensity did not substantially change with other halides, suggesting that
the thioureido protons interact strongly with fluoride but not with other halides. The enhanced
fluorescence is due to increased quantum efficiency of the fluoride complex.
Keywords: Fluoride sensing; thioureido compound, fluorescence
2.2.
Introduction
Anions play various important roles in biological and environmental processes in
nature.1-6 Though considerable attention has focused on the selective detection of anions using
visible colorimetric sensors,7-19 less progress has been made with the more powerful technique of
fluorescence. Fluoride sensing is important since fluoride plays crucial roles in dental caries20
and other medical issues such as osteoporosis.21 Excess fluoride however causes fluorosis,22-25 a
type of fluoride toxicity that is typically related to an increase in bone density. The important
consequences of elevated and depleted fluoride concentration make effective fluoride sensing an
15-17, 26-41
by various researchers, there remains a strong practical impetus to improve the
detection at micromolar to submicromolar30 levels. In addition past research mainly focused on
urea based sensors27-29, 31 while the whole new vista of novel thiourea based sensors12, 15, 16, 36, 40, 41
was largely unexplored (Chapter 1). We therefore synthesized (Scheme 2.1) and characterized
1,8-bis(phenylthioureido)naphthalene as a fluorescent probe for fluoride detection as well as a
chromogenic fluoride sensor. The structure of compound 1 was confirmed by 1H (Figure 2.1) and 13
C NMR (Figure 2.2) and mass spectral analysis (Figure 2.3). In the presence of fluoride, this
compound shows a new fluorescence peak (with λmax = 447.5 nm), as shown in Figure 2.4.
Chloride (Figure 2.5), bromide (Figure 2.6) or iodide (Figure 2.7) addition did not cause any
change in the fluorescence intensity or shape.
Scheme 2.1 Synthesis of 1,8-bis(phenylthioureido)naphthalene (Compound 1).
NH2 NH2
NH HN S
S
NH HN
Et3N, RT, 24Hrs THF
Figure 2.3 MALDI-Mass spectrum of compound 1 in presence of 0.1 (M) AgNO3 solution. Mass of compound 1 is 428 amu. 535 amu and 537 amu masses were observed indicating the silver adduct formation.
0
200
400
600
800
1000
1200
500
520
540
560
580
600
620
m/z
A
rb
it
ra
ry
(M+
107Ag)
(M+
109Ag)
+
+
NHHN S
S