Author name / JHMTR 00 (2013) 000–000 40
40 1. Introduction
The solar updraft power plant system (SUPPS) is one of the modern renewable energy technologies which has the capability of economic competition in comparison with the conventional power plants. SUPPS harness and convert solar radiation to electrical energy by combination of the three well-known main parts. As shown in Fig. 1 SUPPS uses an open-solar-air collector to warm up entering air from ambient and makes buoyancy. The central chimney acts as a thermal engine and converts thermal energy to kinetic energy in flowing air inside the system. A portion of this kinetic energy is converted to electricity in aero-turbines that located in the base of chimney structure [1, 2]. The first SUPPS prototype was constructed in Manzanares, Spain in the early 1980s by Schlaich and his partners. This prototype consists of a solar collector with diameter of about 244m and 2m to 6m in height from inlet to center. The chimney has 194.6m in height and 20m in diameter. Manzanares power station operated with a peak output of 50 kW for over 7
years. After that, relevant researches on the SUPPS continued due to its prosperous future and considerable development occurred in numerical analysis and experimental prototype. Several research and industrial groups evaluate the possibilities of constructing SUPPS such as EnviroMission Company in Australia and in Arizona (USA) [3]. Based on Manzanras prototype, Pasumarthi and Sherif [4, 5] developed a comprehensive mathematical model to evaluate thermo-fluid analysis of SUPPS and they built small-scale SUPPS prototype to investigate the impact of miscellaneous parameters, such as geometrical dimensions and environmental conditions on thermo- fluid properties such as temperature, velocity and power output. They also examine several types of SUPPS prototype with consideration of the chimney shape, the collector construction in Florida in order to study on fluid flow and heat transfer of various scales of SUPPS [6]. Economic analysis and basic theory of large –scale SUPPS is presented by Schlaich et al which is utilized to design of a 200-MW
Click here, type the title of your paper, Capitalize first letter of each words
First Author
a, Second Author
b,*aFirst affiliation, Address, City and Postcode, Country
bSecond affiliation, Address, City and Postcode, Country
Journal of Solar Energy Research 12 (2016) 40-46
Journal of Solar Energy Research (JSER)
Journal homepage: jser.ir
A B S T R A C T
Click here and insert your abstract text. Click here and insert your abstract text. Click here and insert your abstract text. Click here and insert your abstract text. Click here and insert your abstract text. Click here and insert your abstract text. Click here and insert your abstract text. Click here and insert your abstract text. Click here and insert your abstract text. Click here and insert your abstract text. Click here and insert your abstract text. Click here and insert your abstract text. Click here and insert your abstract text. Click here and insert your abstract text. Click here and insert your abstract text. Click here and insert your abstract text. Click here and insert your abstract text. Click here and insert your abstract text. Click here and insert your abstract text. Click here and insert your abstract text. Click here and insert your abstract text Click here and insert your abstract text Click here and insert your abstract text Click here and insert your abstract text Click here and insert your abstract text Click here and insert your abstract text Click here and insert your abst
© 2013Published by University of Tehran Press. All rights reserved.
ARTICLE INFO Received:
Received in revised form: Accepted:
Available online:
Keywords:
Type 3-6 keywords here,
separated by semicolons ;
Experimental and Numerical Analysis of Ambient Crosswind Effects on a Floating
Solar Chimney Power Plant Performance
Rahimi Larki
a,M.
, Arefian
a,A.
, Hosseini Abardeh
a,*,R.
aDepartment of Mechanical Engineering, Amirkabir University of Technology (Tehran Polytechnic), 424, Hafez Ave., Tehran-Iran.
*E-Mail: [email protected]
Journal of Solar Energy Research (JSER)
Journal homepage: www.jser.ut.ac.ir
A B S T R A C T
Floating solar chimney (FSC) power plant is a novel kind of solar thermal technologies which uses the buoyant airflow and chimney (stack) effect to make an artificial airflow and generate electricity from aero -turbines. Also FSC has the capability of economic competition with conventional and other renewable power plants. Considering the FSC structure, it is obvious that, ambient cross wind (ACW) has significant influence on the FSC performance. The main purpose of this study is an investigation on the effect of ACW on updraft airflow inside a FSC which is a considerable parameter on system performance. In addition, FSC operation has been analyzed at different tilt angles when exposed to external crosswind. Hence, a geometrical model consisting of FSC and its surrounding ambience is simulated and mathematical model is proposed to demonstrate the fluid flow, heat transfer and performance of entire system are further developed. The variation of FSC updraft velocity is analyzed in different ACW velocities. In this research, design and construction of a small-scale (laboratory model) floating solar chimney is performed and numerical results are verified with experimental setup data. Analysis of numerical simulation indicates that when the ACW is relatively weak, it will deteriorate the updraft air flow velocity of fixed solar chimney or vertical floating chimney due to the tip vortices effects. Increasing the tilt angle of the floating chimney causes a decrease in tip vortices formation and finally make a considerable improvement in updraft velocity compared to the fixed (vertical) chimney. Although inclination of the floating chimney decreases the physical height, the performance of FSC is better than fixed type due to the reduction of the tip vortices effect in windy conditions. The present work can be useful to predict the performance of large-scale FSC by considering the influence of ACW.
© 2016 Published by University of Tehran Press. All rights reserved.
© 2016 Published by University of Tehran Press. All rights reserved.
ARTICLE INFO
Received: 16 August 2016 Received in revised form: 28 October 2016
Accepted: 30 October 2016
Keywords:
41 industrial-scale SUPPS [7]. Pretorius and Kröger presented a mathematical model to simulate SUPPS numerically and analyzed the influence of various calculating technique on output power [8]. Ming et al. studied and developed a thermodynamic model to investigate the performance of a SUPPS by evaluating the influence of different parameter on the relative pressure, driving force, power output and efficiency [9]. Also Zhou et al. performed different experimental investigation on mini- scale of SUPPSs [10]. Koonsrisuk and Chitsomboon modeled the operation of large scale SUPPSs by utilizing the dimensional analysis to obtain a dynamic similarity between its scaled models and prototypes [11, 12]. Zhou et al. investigated the impact of chimney height on the performance of SUPPS exposed to standard lapse rate of environment temperature [13]. Fluri et al. presented a detailed economic study on SUPPS [14]. Petela developed a simplified comprehensive mathematical model for SUPPS where 2nd law analysis has been used to determine and evaluation of exergy flow in the whole system [15]. The conventional solar chimney is usually built by reinforced concrete. Although it has a long life span, in order to generate sufficient buoyancy flow due to natural convection, the chimney height is required to be high enough which has creates some disadvantages such as high construction cost, restriction on the structure material and limited height due to the technological constraints. Also the natural event instant of possible earthquake can destroy very tall chimney easily as well as a cross wind produce vibration effects on the chimney structure. With increasing wind speed, a significant amplification of the cross flow forces occurs and large amplitude of cross flow oscillations is created which can destroy the solar tower [16]. Based on these facts, the idea of Floating Solar Chimney (FSC) technology was presented by Papageorgiou for the first time. The novelty of FSC technology is to avoid to major problems due to the ambient cross wind, heavy weight and the construction cost of solar chimney but its life span is shorter than rigid concrete solar chimneys. The FSC can be built for hundreds of meters without major considerations. It can be a significant improvement in power generation and omit the limitations of using of rigid concrete structure for solar chimney [17]. However, a precise attention on previous publications represent that scientific authors focused more on solar radiation effects rather than on the influence of ambient cross wind on SUPPS especially FSC. Existing research indicates that ambient cross wind causes very complex situation on SUPPS [18-20]. Up to now, few studies about the impact of ambient cross wind on the SUPPS have been carried out. Niemann et al. presented a model of SUPPS with consideration of cross wind in order to analyze the structural reliability of the high chimney [21]. Later, an analysis about structural dynamic aspects on the SUPPS was carried out by Borri et al [22]. Following that, Ming et al. studied the impact of ACW on the SUPPS operation through the collector inlet and chimney outlet. It is
found that an ACW affects the SUPPS in two ways. First, when the velocity of ambient cross wind is comparably low, it will degenerate the flow field and decrease the power generation of the SUPPS whereas if the ACW is strong enough, it may improve the updraft flow rate and SUPPS performance [1].
Figure 1. Schematic of solar chimney power plant and main parts
The objective of this paper is to investigate the effect of ACW on updraft air flow inside the FSC which is a considerable parameter on system performance. Hence, a numerical simulation is performed on geometrical FSC model in various tilt angels, when exposed to external crosswind. The numerical model is validated by small-scale FSC model which is designed and constructed by researcher group. Further, the influence of ACW on the chimney outlet is studied.
2. Materials and Methods
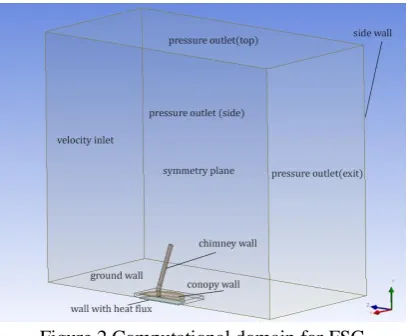
In this section, details of numerical modeling and experimental study are presented. In the field of numerical analysis, geometrical model, computational domain, mathematical model and governing equations and finally selected profile for simulating the ambient cross wind are discussed. Following that, the main steps of experimental study such as design, build and test of a floating solar chimney power plant laboratory model are described. Primary data obtained from lab model are used to validate the results of numerical solution. In order to realize the impact of ACW on entire FSC system, the model was located in the center of nonexistent cubical box as shown in Fig 2.
42 the chimney, radiation heat transfer is not necessary to evaluate [23].
Investigating fluid flow and heat transfer characteristics within the FSC and its ambience are is actually complicated. In this research, pure natural convection produced by solar radiation (here equivalent ground heat flux) is the main governing flow physics for the floating solar chimney system when the ACW is absent.
The non-dimensional number that can measure the intensity of the buoyancy-induced flow is the Rayleigh number as defined below:
3 g TL Ra (1)
where T is the maximum temperature increase within the FSC. α, β and L are the thermal diffusivity, thermal expansion coefficient and the collector height, respectively. However, the ACW plays considerable role in this study which causes the system to be combination of natural and forced convection. The non-dimensional number relates the influence of ACW to the whole FSC system and is represented as: 3 2 2 2 2 Re g TL
Gr g TL
u u L (3)
where, Gr and Re are Grashof and Reynolds numbers, respectively and u∞ is the average ACW velocity imposed to
FSC. In the collector, the fluid flow is much weaker than the chimney, so the flow region can be distinguished firstly according to dimensionless group numbers.
Figure 2.Computational domain for FSC numerical simulation and main boundary
conditions
Preliminary analysis showed that the fluid flow within FSC is turbulent even though the velocity of ACW is zero. The presence of ACW will cause the flow to be more turbulent [24, 25]. So the turbulent model should be chosen to determine the fluid flow and heat transfer in the FSC for which both forced and natural convection was considered.
The Boussinesq approximation can be assumed for the buoyancy force in the momentum equation where the density variation is a linear function of temperature change in the collector. This assumption can only be implemented with small temperature differences [1]. Also, realizable k – ε
turbulence model is selected throughout this research, and we propose that the flow is fully turbulent [26]. Governing equations for fluid flow, heat transfer and turbulent modeling can be written as follows:
Continuity: ( ) 0 i i u t x
(2)
Momentum:
( )
( )
( )
i j ij
i
j i j
u u
u p
g T T
t x x x
(3)
Energy:
( ) ( )
( )
( )
p p j i
ij
j j j j
j j
c T c u T T u
t x x x x
p p T u t x (4)
Realizable turbulent kinetic energy:
( )
( )
( )
i
eff k
j j j
k b
ku
k k
t x x x
G G (5)
Realizable turbulent energy dissipation:
1
2
2 1 3
( )
( )
( )
i
eff
i j j
b u
C S
t x x x
C C C G
k k (6)
( t)
eff k
k
(7)
( t)
eff
(8)
where Gk denotes the generation of turbulence kinetic
energy caused by the mean velocity gradients and can be
defined as: k i j j
i u
G u u
x or 2 k t
G S where S is the modulus of the mean rate-of-strain tensor and described as:
2 ij ij
S S S . The generation of turbulence kinetic energy
due to buoyancy,Gb is expressed as ( )
Pr t b i T G g x
and the turbulent viscosity,tis defined as:
2 t k C
where Cis based on the mean rate of strain and rotation, the angular velocity, and the system rotation. The value of this constant is 0.09.k and show the turbulent Prandtl
43 additionc1 ,c2,c1, c3 are constant for turbulent
model:c1=1.44,c2=1.9, 1 max 0.43, 5
k k
c S S
and c1 tan v
u
which is a relationship between the velocity vector parallel and perpendicular to the gravitational vector. Both natural (buoyancy effect) and forced (ACW effect) convection have been considered, respectively, by the first and second terms of in the right side of momentum equation. If ACW is strong enough, forced convection will overcome the effect of natural convection and if ACW is weak, natural convection will dominate the forced convection and press. Force item can be neglected. The boundary condition for numerical simulation to investigate the influence of ACW on the whole system are represented in Table 1.
Table 1.boundary condition for numerical simulation
Faces Boundary type Value
Ambient inlet (x=0) Velocity inlet 1.85 m/s
Ambient outlet Press. outlet 0 pa
Ground surface (under
canopy) Heat flux
500-2080 W/m2
Ground surface (outside canopy)
Constant
temperature 300 k
Chimney surface Adiabatic wall 0 W/m2
Collector canopy
surface Wall couple
Symmetry surface (y=0) Symmetry -
The wind speed profile can be described as the logarithmic function which is defined as:
0
ln( / ), 0
uA z z v w (10)
where A is a constant and z is the height. Also, is defined as aerodynamic roughness length of the ground. Ambient outlet contains 3 faces: the top surface of the model, the surface parallel to the ambient inlet surface and the surface parallel to the symmetry surface. Ambient outlet contains 3 faces: the top surface of the model, the surface parallel to the ambient inlet surface and the surface parallel to the symmetry surface. Also, the boundary condition for cubic box is shown briefly in Fig 2.
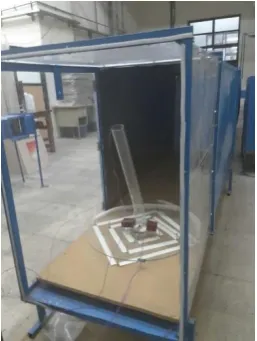
A simple lab scale experimental setup of a floating solar chimney is used in order to simulate real filed studies and validate numerical results. The main dimensions of experimental setup are the same as mentioned previously. Equivalent ground heat flux is achieved by using electrical heating elements. The quantity of heat flux is calculated by production of whole element voltage in current divided by collector area. Collector roof and chimney wall are made of transparent glass. 5 chimneys with different tilt angles 0, 10, 20, 30 and 35 degree are used instead of a flexible floating chimney. FSC setup is located in the test section of a low speed wind tunnel to evaluate the effect of ACW on the whole system. Free stream wind speed reaches 1.85 m/s
during the test and all the tests are performed in this speed. Voltage is regulated to generate ground heat fluxes in quantities of 500, 787, 1143, 1565 and 2080 W/m2.
Experimental data from multi-meter, thermometer and turbine flow meter are captured after steady state condition is achieved. A view of experimental setup in wind tunnel is shown in Fig. 3.
Figure 3. Experimental setup for Floating Solar Chimney located at the test section of a low speed wind tunnel
3. Results & Discussion
At the beginning of this section, the distribution ambient cross wind produced by wind tunnel is shown in Fig. 4. Curve fitting on experimental data shows that the produced velocity profile obeys logarithmic profile in an acceptable match or, in other words, natural wind profile is simulated in wind tunnel test section.
44 The results of comparison between wind and no-wind conditions are shown in Fig. 7 for the vertical chimney. Ambient cross wind performed on solar collector and solar chimney causes a significant reduction in updraft velocity compared with no wind conditions. The main reason of this phenomenon is the formation of tip vortices at the chimney outlet. These vortices reduce actual cross section of chimney and make a wind induced pressure drop in the updraft flow path.
0 0.1 0.2 0.3 0.4 0.5 0.6 0.7 0.8
1.2 1.3 1.4 1.5 1.6 1.7 1.8 1.9
Height from ground surface y [m]
A
C
W
v
el
o
ci
ty
u¥
[
m
/s
]
Experimental data (wind tunnel) Experimental data (wind tunnel) Curve fitted (u=0.0281·ln(y/0.001) ) Curve fitted (u=0.0281·ln(y/0.001) )
Figure 4. Ambient Cross Wind velocity profile produced by wind tunnel in experiments
100 200 300 400 500 600 700
1 1.2 1.4 1.6 1.8
Q [W]
U
p
d
ra
ft
v
el
o
ci
ty
,
V
[m
/s
]
Numerical simulation Numerical simulation Experimental data Experimental data
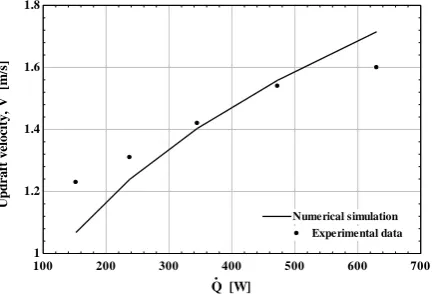
Figure 5. Variation of updraft velocity versus input heat rate with experimental data and numerical
simulation
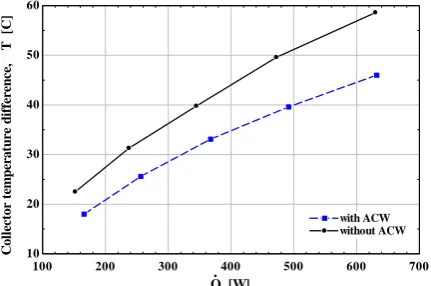
Considering Fig. 8, Collector temperature difference in windy conditions has little value due to mixing cold air entering the collector by wind and hot air generated by natural convection. Finally, Fig. 9 shows updraft velocity results for various tilt angles of the floating chimney with/without ACW. As can be seen in no-wind conditions, increase in tilt angle causes a decrease in chimney vertical height and natural convection is weakened. It is clear that, without ACW, floating chimney has no tilt angle and updraft velocity remains at 1.25 m/s for this study. For windy conditions, updraft velocity has a maximum value that occurs in a non-zero tilt angle. For this case, the angle of 10 degree has the maximum value for updraft velocity. In this region of tilt angle the effect of tip vortices and reduction of buoyancy due to reduction in vertical height will be minimum and finally solar chimney performance will reach the maximum as a result. For lower and higher values for tilt angles, a significant tip vortices effect and
reduction in driving force (buoyancy) decrease updraft velocity.
100 200 300 400 500 600 700
20 30 40 50 60 70
Q [W]
C
o
ll
ec
to
r
te
m
p
er
a
tu
re
d
if
fe
re
n
ce
, D
T
[C
]
Numerical simulation Numerical simulation
Experimental data Experimental data
Figure 6. Variation of collector temperature difference versus input heat rate for experimental data and numerical
simulation
100 200 300 400 500 600 700
1 1.1 1.2 1.3 1.4 1.5 1.6
Q [W]
U
p
d
ra
ft
v
el
o
ci
ty
,
V
[
m
/s
]
with ACW with ACW without ACW without ACW
45 4. Conclusions
A numerical and experimental study is investigated on ambient cross wind effect on the performance of the floating solar chimney power plant model. Updraft velocity inside the chimney and collector temperature difference were selected as the output parameters. Analysis of experimental and numerical result show that for regular week ACW velocity, updraft velocity inside the chimney and thus whole system performance will be reduced for fixed and floating chimney. Formation of tip vortices is the main reason for this deterioration and increasing of tilt angle of floating solar chimney leads to a significant improvement in system performance. The floating solar chimney has a capability to overcome the negative effect of ACW by decreasing the tip vortices within certain angles (in this study about 10 deg.) whereas fixed chimney has more problems in windy conditions. By the analysis performed in this study, some design methods can be obtained for large-scale floating chimney structure, especially for determine buoyant gas trapped in the structure and equilibrium tilt angle of chimney exposed to regular ACW. Further research on direct effects of ACW on the floating solar chimney structure is recommended.
100 200 300 400 500 600 700
10 20 30 40 50 60
Q [W]
C
o
ll
ec
to
r
te
m
p
er
a
tu
re
d
if
fe
re
n
ce
, D
T
[C
]
with ACW with ACW without ACW without ACW
Figure 8. Comparison between collector temperature differences versus input heat rate with/without ACW
0 5 10 15 20 25 30 35
1 1.05 1.1 1.15 1.2 1.25
Floating chimney tilt angle, q [deg]
U
p
d
ra
ft
v
el
o
ci
ty
,
V
[m
/s
]
without ACW without ACW with ACW with ACW
Figure 9.Variation of updraft velocity versus floating chimney tilt angle with/without ACW at constant heat flux
Nomenclature
Cε1, Cε2, Cε3 constants for turbulent model
cp specific heat at constant pressure(J/kg K)
g acceleration of gravity(m/s2)
G solar radiation intensity
Gr Grashof number
Gk turbulence kinetic energy generation due to
mean velocity gradients (J)
Gk turbulence kinetic energy generation due
to turbulence (J) L collector height (m)
q heat flux through the ground underneath the collector (W/m2)
Re Reynolds number (dimensionless) T temperature (K)
u velocity in y-direction (m/s) x,y,z Cartesian space coordinates (m/s) α thermal diffusivity (m2/s)
ν kinetic viscosity (m2/s)
β volume coefficient of expansion (1/K) ρ density (kg/m3)
τ shear stress caused by viscosity (N/m2)
Subscripts
s surface value
i,j,k any direction of x,y and z
References
[1] Ming, T., Wang, X., de Richter, R. K., Liu, W., Wu, T., & Pan, Y. (2012). “Numerical analysis on the influence of ambient crosswind on the performance of solar updraft power plant system.” Renewable and Sustainable Energy Reviews, 16(8), 5567-5583.Author, A., 1986. Book Name. Publisher Name, Address.
[2] Al-Kayiem, H. H., & Aja, O. C. (2016). “Historic and recent progress in solar chimney power plant enhancing technologies”. Renewable and Sustainable Energy Reviews, 58, 1269-1292
[3] Cormier, D., Magnan, M. and Van Velthoven, B. (2005). Environmental disclosure quality: do firms respond to economic incentives, public pressures or institutional conditions? European Accounting Review, 14(1), 1–37. [4] Pasumarthi, N., & Sherif, S. (1998). Experimental and theoretical performance of a demonstration solar chimney model—Part I: mathematical model development. International Journal of Energy Research, 22(3), 277-288. [5] Pasumarthi, N., & Sherif, S. (1998). Experimental and theoretical performance of a demonstration solar chimney model—Part II: experimental and theoretical results and economic analysis. International Journal of Energy Research, 22(5), 443-461.
[6] Padki, M., & Sherif, S. (1999). On a simple analytical model for solar chimneys. International Journal of Energy Research, 23(4), 345-349.
46 [8] Pretorius, J., & Kröger, D. (2006). Critical evaluation of solar chimney power plant performance. Solar Energy, 80(5), 535-544.
[9] Tingzhen, M., Wei, L., & Guoliang, X. (2006). Analytical and numerical investigation of the solar chimney power plant systems. International Journal of Energy Research, 30(11), 861-873.
[10] Zhou, X., Yang, J., Xiao, B., & Hou, G. (2007). Experimental study of temperat. field in a solar chimney power setup. Applied Thermal Engineering, 27(11), 2044-2050.
[11] Koonsrisuk, A., Lorente, S., & Bejan, A. (2010). Constructal solar chimney configuration. International Journal of Heat and Mass Transfer, 53(1), 327-333.
[12] Koonsrisuk, A., & Chitsomboon, T. (2009). Partial geometric similarity for solar chimney power plant modeling. Solar Energy, 83(9), 1611-1618.
[13] Zhou, X., Yang, J., Xiao, B., Hou, G., & Xing, F. (2009). Analysis of chimney height for solar chimney power plant. Applied Thermal Engineering, 29(1), 178-185. [14] Fluri, T., Pretorius, J., Van Dyk, C., Von Backström, T., Kröger, D., & Van Zijl, G. (2009). Cost analysis of solar chimney power plants. Solar Energy, 83(2), 246-256. [15] Petela, R. (2009). Thermodynamic study of a simplified model of the solar chimney power plant. Solar Energy, 83(1), 94-107.
[16] Zhou, X., Yang, J., Wang, F., & Xiao, B. (2009). Economic analysis of power generation from floating solar chimney power plant. Renewable and Sustainable Energy Reviews, 13(4), 736-749.
[17] Papageorgiou, C. D., Psalidas, M., & Sotiriou, S. (2011). Floating solar chimney technology scale analysis. Paper presented at the Proc. IASTED Int. Conf. on Power and Energy Systems Crete, Greece.
[18] Ming, T., Wang, X., de Richter, R. K., Liu, W., Wu, T., & Pan, Y. (2012). Numerical analysis on the influence of ambient crosswind on the performance of solar updraft power plant system. Renewable and Sustainable Energy Reviews, 16(8), 5567-5583.
[19] Ming, T., Gui, J., de Richter, R. K., Pan, Y., & Xu, G. (2013). Numerical analysis on the solar updraft power plant system with a blockage. Solar Energy, 98, 58-69.
[20] Pastohr, H., Kornadt, O., & Gürlebeck, K. (2004). Numerical and analytical calculations of the temperat. and flow field in the upwind power plant. International Journal of Energy Research, 28(6), 495-510.
[21] von Backström, T. W., Harte, R., Höffer, R., Krätzig, W., Kröger, D., Niemann, H., & Van Zijl, G. (2008). State and recent advances in research and design of solar chimney power plant technology. VGB powertech, 88(7), 64-71.
[22] Borri C, Lupi F, Niemann H-J. Innovative modelling of dynamic wind action on Solar Updraft Towers at large heights. In: Proceedings of the eighth interna- tional conference on structural dynamics, EURODYN 2011. Leuven, Belgium; 4–6 July 2011.
[23] Xu, G., Ming, T., Pan, Y., Meng, F., & Zhou, C. (2011). Numerical analysis on the performance of solar chimney power plant system. Energy Conversion and Management, 52(2), 876-883.
[24] Zheng, Y., Ming, T., Zhou, Z., Yu, X., Wang, H., Pan, Y., & Liu, W. (2010). Unsteady numerical simulation of solar chimney power plant system with energy storage layer. Journal of the Energy Institute, 83(2), 86-92.