Max Planck Institute for Demographic Research Konrad-Zuse Str. 1, D-18057 Rostock·GERMANY www.demographic-research.org
DEMOGRAPHIC RESEARCH
VOLUME 20, ARTICLE 22, PAGES 541-558
PUBLISHED 20 MAY 2009
http://www.demographic-research.org/Volumes/Vol20/22/ DOI: 10.4054/DemRes.2009.20.22
Research Article
Keeping a learned society young
Herbert Dawid
Gustav Feichtinger
Joshua R. Goldstein
Vladimir M. Veliov
c
°2009 Herbert Dawid et al.
2 Incorporating the concern over the aging of members into recruitment policy 544
3 Simple explanations of the bimodal recruitment policy using ideas from mathematical
demo-graphy 547
4 Formal discussions and the derivation of the bimodal shape of recruitment 550
5 A case study: the Austrian Academy of Sciences 553
6 Conclusions 556
7 Acknowledgement 557
Keeping a learned society young
Herbert Dawid1
Gustav Feichtinger2
Joshua R. Goldstein3
Vladimir M. Veliov4
Abstract
Aging organizations – regardless of whether they are firms, faculties, societies, political bodies, teams, or national academies – seek ways to rejuvenate. This paper demonstrates that the best way to keep an organization young is through a mixed strategy of recruiting both young and old, and that, contrary to intuition, recruiting those of middle age is the least effective strategy for maintaining a younger age structure.
The aging of learned societies is a problem in many national academies. Faced with rising life expectancy, particularly for older persons, the average age of academy members is increasing. Another reason for “overaging” is an increase in the age at election.
In an organization with a fixed size the annual intake is strictly determined by the number of deaths and the statutory retirement age. This can, among many learned so-cieties, lead to a fundamental dilemma: the desire to maintain a young age structure, while still guaranteeing a high recruitment rate. We derive an optimal recruitment policy which is bimodal, i.e., it entails shifting recruitment partly to younger ages and partly to older ages, while decreasing the recruitment of middle-aged candidates. Although the optimization problem explicitly involves only the average age and the recruitment rate as objectives, the methodology implicitly allows us to take into consideration all other objectives (formal or informal) used in the actual election practice.
1Chair for Economic Policy, University of Bielefeld, P.O. Box 100131, 33501 Bielefeld, Germany.
E-mail: [email protected].
2Institute of Mathematical Methods in Economics, Vienna University of Technology, Argentinierstrasse 8,
A-1040 Vienna, Austria. E-mail: [email protected].
3Max Planck Institute for Demographic Research, 18057 Rostock, Germany.
E-mail: [email protected].
4Institute of Mathematical Methods in Economics, Vienna University of Technology, Argentinierstrasse 8,
1. Introduction
The demography of professional organizations, such as learned societies, has recently been the focus of several studies (Leridon 2004; van de Kaa and de Roo 2006; Feichtinger et al. 2007; Cohen 2003, 2006). Leridon (2004), who studied the development of the French Academy of Sciences, has drawn attention to an important aspect of the age dy-namics of this learned society. He states:“To counteract the spontaneous trends in aging in the institution new members would have to be elected at increasingly young ages year after year, which would have the drawback of reducing the rate of population replace-ment.”
In a similar vein, the Austrian Academy of Sciences (ASA) is concerned that an aging membership could have a significant negative impact on the representative, advisory, man-agerial, and other services that the members are expected to provide. Recently, the pres-ident of the ASA asked the authors for their view on what kind of measures should be taken to address the problem of increasing aging.
The Academy is limited to 90 full members, evenly divided between two sections: mathematical and natural sciences, and social sciences and humanities. The current bers elect newcomers when positions fall vacant. When they reach the age of 70, mem-bers gain emeritus status, and cease to count towards the 90 positions; elderly memmem-bers are also no longer eligible to be officers of the Academy. Thus mortality, out-migration or leaving the Academy for other reasons, and retirement (Emeritierung) provide the main opportunities for the election of new members.
In principle the population dynamics of the Academy can be studied using the same methods as those employed when studying any other population. However, the Academy’s vital events differ from those of a conventional population. The population dynamics in hierarchical bodies in which the total membership size remains constant is determined by the rate of intake, the age distribution at entry into a given status, the number of exits (deaths or dismissals), the statutory retirement age, and the population size. The intake itself is strictly determined by the number of deaths and retirements. The only scope for modifying the age structure lies in the age distribution of entries, e.g., at election. To counteract the trend of aging, new members have to be elected at increasingly young ages. However, this would have the drawback of reducing the inflow of new members. Thus, there is a fundamental dilemma in a constant-sized, age-structured population, such as in an academy of sciences: a desire to maintain a young age structure, while ensuring a high recruitment rate.
even simply of preventing further increases. At the same time, the recruitment rate could be maximized by increasing the age at election. Clearly the first approach involves re-cruiting a greater number of young members, while the second strategy entails rere-cruiting a greater number of older members (who will retire soon, and thus open up new places). In this context, what constitutes a reasonable trade-off? There are (at least) two qualitative possibilities: (i) to recruit more people in the middle of the age range (a compromise), and (ii) to recruit a mixture of young and old members. Our analysis shows, however, that the first strategy actually produces the opposite of the intended result, maximizing the average age and minimizing the recruitment rate. This is especially significant because the current election practice in the ASA shows a strong preference for middle-aged candidates (see the solid line in Figure 1). Indeed, current practice might have been designed to achieve a high average age of the Academy. Here we show that a trade-off of the second (bimodal) kind—i.e., recruiting a mixture of new members, some of whom are as young as possible, while others are as old as possible—is optimal if the average age is to be minimized, given the recruitment rate. The precise form of the optimal age distribution of recruitment is ob-tained by formulating the problem as an one of intertemporal optimization, and by using the optimality conditions of Pontryagin’s maximum principle. Although the optimization problem under consideration explicitly involves only the average age and the recruitment rate as objectives/constraints, all other objectives (formal or informal) used in the election practice in reality are implicitly taken into account in the form of constraints on the age density of the inflow, which define the class of “possible” (admissible) distributions.
There may also be significant non-demographic arguments in favor of a bimodal
recruitment. For example, Warren Sanderson5has pointed out that electing young
mem-bers means rewarding excellence, while the election of older memmem-bers is a recognition of lifetime achievement.
The dynamics of a fixed-sized population, and the problem of minimizing its aver-age aver-age without reducing the recruitment rate, are described formally in the next section using a standard continuous-age model of a stationary population. Particular attention is given to the constraints on the age distribution of the recruitment, which encapsulate all other objectives. The optimal age distribution of recruitment is characterized in Section 2, although the proof using the Pontryagin maximum principle is presented in Section 4. This naturally leads us to the principle of a bimodal distribution for the election of new members. In Section 3, we provide some intuitive explanations for the bimodal policy, using some simple ideas from mathematical demography. Section 5 presents the numeri-cal results for the case study of the Austrian Academy of Sciences.
5 Warren Sanderson, Professor of Economics, SUNY-Stony Brook, Stony Brook, N.Y. 11794-4384, USA.
2. Incorporating the concern over the aging of members into
recruit-ment policy
The following problem has been posed by several European Academies of Sciences, in particular in the ASA, in the context of a clear aging trend: How can we counteract this trend, while making only minor changes to the rules and traditions in the Academy? Formal demography provides a clear answer: by electing somewhat younger members. However, since these younger members would have longer durations of membership, their recruitment would lead to an unwanted decrease in the number of elections per year, given the fixed size of the organization.6 Therefore, a modified formulation of the problem is
as follows:How can we achieve a lower average member age through minor (moderate)
changes to the election traditions, while at the same time ensuring the same number of elections per year at present.7
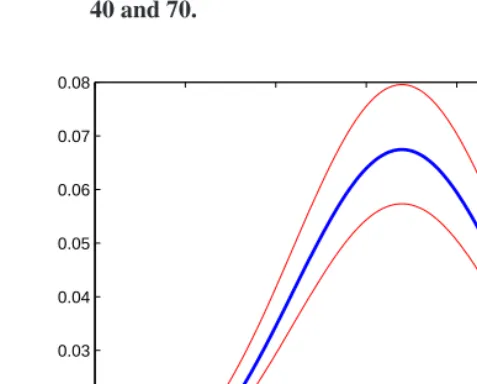
In general, the selection of new members of an organization is a multi-objective de-cision problem with performance indexes that are difficult to specify even informally, let alone in a formal model. Nevertheless, the demographic aspects of the existing election policy in a given organization are exhibited by the age density,u#(a), of the recruitment8. The solid line in Figure 1 represents the smoothed statistical data for the age density of newly elected members of the Austrian Academy of Sciences during the years 1996-2005. If the average age of members is considered to be too high, then the age density of recruitment should be changed from the density seen in Figure 1. This should be done
in such a way that the size of the stationary population remains the same, sayM¯, and
the number of elections per year remains the same,R. Moreover the change should be
small, to avoid any significant compromising of the election criteria that is currently used. We formalize the last requirement by restricting the age density of recruitment,u(a)as follows:
(1−ε)u#(a)≤u(a)≤(1 +ε)u#(a), (1)
with a small positivetolerance parameterε. The thin lines in Figure 1 bound the tolerance area corresponding toε= 0.2. Thus all densitiesu(a)with a graph that lies in this area (that is, (1) holds) do not appear to compromise the present election criteria to a significant degree.
6There are several reasons why a decrease in the number of elections is undesirable. The frustration among
the corresponding members and the scientific community is one.
7Equally, one can consider a multi-objective problem for finding an (optimal) trade-off between the average
age and the number of elections. In this paper we present the story in the terms of a fixed number of elections.
8When referring toage density, we always mean the normalized (probability) density, while we useage profile
Figure 1: Age density of recruitment in the Austrian Academy of Sciences during the years, 1996-2005, and the 20% tolerance area around it. The age interval [0,30] corresponds to real ages between 40 and 70.
0 5 10 15 20 25 30
0 0.01 0.02 0.03 0.04 0.05 0.06 0.07 0.08
The freedom that the tolerance gives us in choosing the recruitment age densityu(a) provides the scope for decreasing the average age of the organization as much as possible.
Thus we can express it as the following formal problem, where the ageais considered as
a continuous variable, andM(a)is the age profile of the members:
minimize 1¯
M Z ω
0
aM(a)da, (2)
subject to
M0(a) = −µ(a)M(a) +Ru(a), M(0) = 0, (3)
Z ω
0
M(a)da= ¯M , (4)
u(a)≤u(a)≤u¯(a), Z ω
0
whereµ(a)is the departure rate at agea(not counting retirement) andωis the retirement
age. At ageωall members retire and are no longer counted as contributing to the total
size of the Academy and to the average age.
Equation (3) is well known in the demographic literature. It says that, for a stationary
population, the change in the number of members with age at a given ageaequals the
number of recruitsRu(a), minus the number of departures, µ(a)M(a). Equation (4) requires that the size of the population equals the numberM¯. In equation (5)u(a) ≤ ¯
u∗(a)two functions define the bounds for the age densityu(a)(for example,u(a) =
(1−ε)u#(a),u¯(a) = (1 +ε)u#(a)as in (1)), and the last equation implies that the
densityuis normalized. The expression in (2) represents the average age.
We can note that the valuesu(a)andu¯(a), which define the tolerance around the present election profile, may also be used to take into account some administrative reg-ulations. For example, if no recruitment is allowed above a certain age, one has to take
u(a) = ¯u(a) = 0above this age.
Our main result characterizes the structure of the optimal recruitment policy,u(a), using the following assumption.
Assumption. The mortality rate,µ(a), is a non-negative continuously differentiable
convex function, which may be equal to zero on some interval [0, a0], and increases
strictly on(a0, ω].
Proposition 1 The optimal recruitment policy,u(a), has the following structure: there are (possibly degenerate) intervals[0, θ]and[τ, ω]such that
u(a) =
½
¯
u(a) fora∈[0, θ]∪[τ, ω]
u(a) fora∈(θ, τ).
The message of the above proposition is clear: the optimal strategy is to balance recruitment between as many candidates as possible of both young and old ages, but to recruit as few as possible who are middle-aged. “Possible” is defined here by the tol-erance levelsu(a)andu¯(a)resulting from the present election practice. Thus the qual-itative policy implication is that, if a recruiting committee faces a problem of aging in a fixed-sized organization with a fixed recruitment rate, it has to avoid (ceteris paribus) middle-aged candidates, opting instead for selecting an appropriate mixture of competi-tive candidates of younger and older ages.
This principle ofbimodal recruitmentis established, and has been proven within a
the organization, then this has a polarizing effect on the optimal recruitment policy: it shifts recruitment away from candidates of middle ages, while causing the organization to concentrate its recruitment efforts partly on candidates of younger ages, and partly on candidates of older ages.
We stress that the assumption made before the proposition is formulated is essential for the validity of the bimodal recruitment principle. It is usually satisfied by the mortality rate for human populations of ages between 40 and 70 (as may, for example, be the case in an academy), where mortality progressively increases with age. If, however, in some contexts (e.g. for members of political parties), the departure rateµhappens to achieve the maximum at some intermediate age, then any form of bimodal recruitment may not be optimal.
3. Simple explanations of the bimodal recruitment policy using ideas
from mathematical demography
In this section we use some basic results from population mathematics to illustrate why the bimodal recruitment mode holds and to provide the basis for an intuitive understanding of the issue of recruitment. The results are easily presented for the case in which there is no mortality (µ(a) = 0).
First we note that the constraints of a fixed size of the society and a given annual number of elections requires us to fix the average duration of membership,d. This follows from the stationary population identity, which holds for populations of constant size with fixed age-specific rates of entry and exit,
¯
M =Rd.
The society size (in equilibrium) will be the number of elections per year times the
average duration of membership. This relationship implies that the duration of staydis
fixed atM /R¯ . The average duration can be expressed as
d=
Z ω
0
(ω−a)u(a)da=ω−
Z ω
0
au(a)da=ω−m,
wheremis the first moment ofuaround zero, i.e., the mean age of recruitment.
Second, we observe that, in the absence of mortality, the stationary population has an age structure that is simply the cumulation of the distribution of age at election. The
number of members of ageais given by
M(a) =
Z a
0
With the constraint defined and an explicit representation of the age structure, we can now formulate the problem of minimizing the average age of the Academy:
A=
Rω
0 aM(a)da Rω
0 M(a)da .
Substitution forM(a)gives,
A=
Rω 0 a
Ra
0 u(s)dsda Rω
0 Ra
0 u(s)dsda .
Reversing the order of integration and simplifying, we obtain
A=
1
2(ω2−m2) ω−m ,
wherem2is the second moment around zero of the election distributionu(a). Lettingσ2=m2−m2be the variance of the distributionu(a), we can write
¯
A=1 2
µ
ω+m− σ
2
ω−m 
. (6)
This expression is the core of our demonstration. It tells us that the mean age is a function of only three quantities: the age at “retirement”ω, the mean age of recruitment
m, and the variance of the recruitment distributionσ2. In this paper, the optimization
problem is conditional on fixed values ofω andm, the latter indirectly because the size and the recruitment rate are fixed. Therefore the only available “decision variable” isσ2.
Maximizing the varianceσ2 subject to the constraint thatm is fixed will minimize the
mean age of membersA.
the department in steady state will be 60, since there will two persons of every age from 50 to 70.
Now, if instead of hiring two 50-year-olds, the department hires one person aged 49 and one person aged 51, the mean duration of 20 years will still be satisfied, but now the steady state will have one person aged 49, one person aged 50, and two persons with an average age of 51+. The mean age of the population will be half a year younger, since in effect we have replaced, in the steady state, a 50-year-old with a 49-year-old.
Indeed, we can make the population even younger by hiring a 48-year-old and 52-year-old, rather than the 49-year-old and 51-year-old.
The only limit to this is when we reach the bounds of the hiring window. In this case, we should hire one 30-year-old and one 70-year-old each year – allowing the 70 year old to retire at the end of his or her 70th year. The department size will still be 40 people, two people can still be hired each year, and the mean age of the department will now be 50, rather than the 60 we started with.
The formal derivation we provide extends this logic to cases in which there is some arbitrary number of new recruits over some arbitrary age range. In practice, the solution is consistently found to lie in hiring at the extremes allowed, with appropriate shares at each extreme needed to keep the mean age of hiring at the desired level.
Here we have dealt only with the steady state of the Academy. But it is worth noting that the convergence to a steady state is also a function of the variance of the age at elections. The larger the variance, the faster a steady state is reached. Thus, by electing a mix of young and old members, the Academy will avoid large echoes of any booms and busts in recruitment.
A different approach for gaining an intuitive understanding of the optimality of bi-modal recruitment is to consider the choice of the recruitment age for a single seat in the Academy. If we assume for the sake of simplicity that the recruitment ageˆafor that seat will stay constant over time, and that there is no mortality, then the average number of recruitments per period generated by this seat is1/(ω−ˆa). The constraint of at leastR
per-period recruitments for the whole Academy implies a minimal number of per-period recruitments to be generated by this seat. Depending on the recruitment age decisions for the other seats, this constraint may or may not be binding. Furthermore, the average age of the member filling this seat is¯a(ˆa) = 0.5(ω+ ˆa) =ω−0.5t, wheret=ω−ˆadenotes the tenure of a member filling that seat. We can now rewrite the problem to choose the recruitment age for the considered seat as
min
t∈[0,ω](ω−0.5t)−α
1
t,
seat,αis positive, and then obviously the tenure of the member filling this seat should be as close to zero as possible. Put differently, the recruitment ageˆashould be as close as
possible toω, where the assumed upper bound on recruitment intensity for a given age
might rule out choosingˆaexactly equal toω. If the constraint on the minimal number
of per-period recruitments is not binding for the considered seat, the multiplierαis zero, and it is optimal to choose the duration of tenure as close as possible to the upper bound
t=ω, which corresponds toˆa= 0. In our continuous framework, the measure of every
single t’t’seat” is zero, which implies that the question of whether the minimal recruitment constraint is binding for a certain seat is not influenced by the choice of recruitment age for that seat. Therefore, this argument can be made for any Academy seat and we find that any optimal choice of the recruitment age must be as close as possible to one of the two boundaries. Noting that the recruitment constraint would be slack if the recruitment age were at the upper bound for all seats, but would be violated if the recruitment age were at the lower bound for all seats, we conclude that, in the best case each of the optimal choices described above must occur for a certain fraction of seats. This gives rise to bimodal recruitment.
4. Formal discussions and the derivation of the bimodal shape of
recruitment
We return to the analysis of the optimization problem (2)–(5).
If the exogenous data,u(a),u¯(a)andµ(a), are piece-wise continuous, then problem (2)–(5) has a solution9, provided at least one admissible age-profileu(a)(that is, for which the constraints (3)–(5) are satisfied) exists.
The first question that must be answered is the following: Does an admissible age profileu(a)exist?
To answer this question, we define the functionsu∗andu∗as
u∗(a) = ½
u(a) fora≤τ∗,
¯
u(a) fora > τ∗, u∗(a) = ½
¯
u(a) fora≤τ∗, u(a) fora > τ∗,
whereτ∗andτ∗are determined from the equations
Z τ∗
0
u(a)da+
Z ω
τ∗
¯
u(a)da= 1, Z τ∗
0
¯
u(a)da+
Z ω
τ∗
u(a)da= 1.
The existence of solutions for the last equations is obviously implied by the inequali-tiesR0ωu(a)da ≤ 1 andR0ωu¯(a)da ≥ 1, which is further assumed. Note that these
inequalities are apparently fulfilled if the bounds u(a) andu¯(a)come from (1), since
Rω
0 u#(a)da = 1. Clearly, u∗ is the recruitment policy with highest average age of
recruitment, whileu∗is the policy with the lowest average age.
The average duration of membership for a policyu(satisfying (5)) is
d(u) =
Z ω
0
ϕ(a)u(a)da, (7)
where
ϕ(a) =
Z ω
a
e−Rasµ(θ)dθds
is the expected remaining duration of membership of a member of agea. Hence,
R(u) = M¯
d(u)
is the number of recruitments per unit of time for recruitment policyu. Then givenµ(a),
u(a),u¯(a)andM¯, the society can be sustained at sizeM¯ if and only ifR∗ =R(u∗)≤
R≤R(u∗) =R∗. Explicitly,
¯
M Rτ∗
0 ϕ(a)¯u(a)da
≤R≤ Rω M¯
τ∗ϕ(a)¯u(a)da
. (8)
A formal derivation of this condition can be carried out by expressing the solution of equation (3) by the Cauchy formula, substituting in (4), and changing the order of inte-gration.
In Section 5, we determine the boundsM∗andM∗numerically for the case study of
the Austrian Academy of Sciences.
Now we return to the optimization problem (2)–(5). We apply the Lagrange principle, adding (4) and the equations in (5) to the objective function with the Lagrange multipliers
λ, andRν, correspondingly, which transforms the problem into
min
u(·)
Z ω
0
[(a+λ)M(a) +Rνu(a)]da, (9)
subject to
0≤u(a)≤u¯(a). (10)
The classical Pontryagin maximum principle (Pontryagin, Trirogoff, and Neustadt 1962) applied to this problem implies that the optimal recruitment controlu(a)satisfies the condition
(ξ(a)−ν)u(a) = max
whereξ(a)is the solution of the (so-called adjoint) differential equation
ξ0(a) =µ(a)ξ+a+λ, ξ(ω) = 0. (12)
Thus the optimal recruitment density,u(a), is determined by the solution of equation (12)
and (11), where the Lagrange multiplierνshould be determined from the condition that
Rω
0 u(a)da= 1, andλshould be determined in such a way that equality (4) holds from
the resulting solution. This is, in fact, the basis for the numerical solutions given below. The optimality conditions (11) and (12) also allow us to prove easily Proposition 1 using also the assumption formulated in Section 2.
Proof of Proposition 1.All we have to prove is that ifu(a) = ¯u(a)for somea, then eitheru(b) = ¯u(b)for allb ∈ [0, a], oru(b) = ¯u(b)for allb ∈ [a, ω]. The analogous claim foru(a)can be proven similarly.
Due to (11), the above statement that we have to verify follows from the following one: ifξ(a)≥ν for somea, then eitherξ(b)> ν for allb ∈[0, a], orξ(b) > νfor all
b∈[a, ω].
Assume that the last statement is false. Then there exista1 < a < a2in[0, ω]such that
ξ(a)≥ν, ξ(a1)≤ν, ξ(a2)≤ν.
Thenξachieves a maximum at a pointα∈(a1, a2)and
ξ0(α) = 0, ξ00(α) =µ0(α)ξ(α) + 1≤0. (13)
We consider two cases:
1.ξ(α)≥0. Then the second inequality in (13) impliesµ0(α)<0, which contradicts the
assumptions.
2.ξ(α)<0. Sinceξ(a2)≤ξ(α)<0andξ(ω) = 0, a pointβ ∈(α, ω)exists, whereξ
obtains a local minimum andξ(β)≤ξ(α). Then we have
0≤ξ00(β) =µ0(β)ξ(β) + 1≤µ0(β)ξ(α) + 1≤µ0(α)ξ(α) + 1 =ξ00(α)≤0.
If at least one of the inequalities is strict, another contradiction becomes apparent. Thus
−1 =µ0(β)ξ(β) =µ0(β)ξ(α) =µ0(α)ξ(α).
This implies thatµ0(β) 6= 0andξ(α) = ξ(β). Henceξ(a) = ξis constant on[α, β].
From (12) we obtain that0 = µ(a)ξ+a+λ, and µturns out to be linear in(α, β). Thenµ0is not strictly increasing in this interval. From the assumptions forµwe obtain
thatµ(a) = 0on[α, β], which contradicts the last inequality in (13). This completes the
Theoretically, it is possible that one of the intervals of recruitment,[0, θ]or[τ, ω]is
void. However, this may happen only ifR = R∗ (then the reqruitment is concentrated
only at old ages, i.e.θ= 0) orR=R∗(thenτ =ω).
Remark 1 Proposition 1 implies that the optimal solution is unique. Indeed, ifu1(a)and
u2(a)are two optimal solutions, then, due to the linearity,0.5(u1+u2)is also an optimal solution. Then it must have the “bang-bang” structure described in Proposition 1. This is possible only ifu1(a) =u2(a)for (almost) alla. Thus the solution is unique.
5. A case study: the Austrian Academy of Sciences
The size of the Austrian Academy of Science (ASA) is fixed:M¯ = 90. As members age
70 and above are not counted, and members below age 40 are rather rare exceptions, we
haveω = 30(which corresponds to the age interval 40–70 years). The age-dependent
mortality rate is identified from data that are specific for the Academy members (the mortality of the members in the above age interval is considerably lower than that of the average population in Austria (Feichtinger et al. 2007)).
The statistical information about past elections (years 1996-2005) is used to determine the age profileu#(a), given in Figure 1.
If we now consider the problem of optimal reduction of the average age of members,
we define the tolerance bounds as in (1), taking however, u(a) = 0. In addition, we
assume that there are no elections at ages 69 and 70, although this is not required by the rulesn of the Austrian Academy: that is, we setu¯(a) = 0fora >28.
Some results and analysis for the Austrian Academy of Sciences follow in which we have taken the tolerance parameterε= 1, so thatu(a) = 0,u¯(a) = 2u#(a). Moreover,
the young-to-old ratioρis defined as
ρ=
Rθ 0 u¯(a)da Rω
τ u¯(a)da
,
whereθandτare the numbers from Proposition 1.
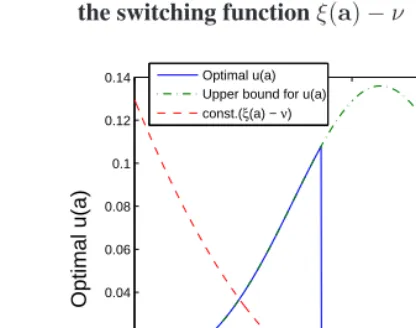
1. The optimal solution forR= 7.The optimal solution for this case is presented in Figure 2 (solid line). The dash-dotted line plots the upper bound for the control,u¯(a). The dotted line represents the functionξ(a)−ν(the so-called switching function, re-scaled to fit to the same plot) which is to be maximized by the optimal controlu(a), according to the maximum principle (11).
Figure 2: The optimal recruitment densityu(a), the upper bound¯u(a), and the switching functionξ(a)−ν
0 5 10 15 20 25 30
−0.02 0 0.02 0.04 0.06 0.08 0.1 0.12 0.14
Age a
Optimal u(a)
Optimal u(a) Upper bound for u(a) const.(ξ(a) − ν)
θ τ
2. The admissible range of elections, [R∗,R∗]. The minimal and the maximal
number of elections per year for which the size of the Academy can be sustained at level ¯
M = 90areR∗ ≈5.3andR∗ = 10.7, respectively. The average age of the Academy
members forR = 5.3would beA ≈20.7, and forR = 10.7would beA ≈24.9, that is, 60.7 and 64.9 years of age, respectively. Figure 3 shows the optimal solutions,u, for valuesR = 5.4andR = 10.6, which are close to the ends of the admissibility domain [R∗, R∗]. The optimal densitiesu(a)are close to the “extreme” controlsu∗(a)andu∗(a),
defined in Section 4.
3. The dependence of the minimal average age on the number of elections,R.
Table 1 gives the optimal average (real) age for different admissible values ofR, and the marginal increase of the average age withR.
Figure 3: The optimal recruitment densities,u, for values of the recruitment rate,R, close to the lower bound,R∗(left panel) and to the upper bound,R∗(right panel)
0 5 10 15 20 25 30 0
0.02 0.04 0.06 0.08 0.1 0.12 0.14
Age a
Optimal u(a)
Optimal u(a) Upper bound for u(a)
θ τ 00 5 10 15 20 25 30
0.02 0.04 0.06 0.08 0.1 0.12 0.14
Age a
Optimal u(a)
Optimal u(a) Upper bound for u(a)
θ τ
4. The role of mortality.The mortality of Academy members in Austria is lower than for the total population, and the rate per year reaches 0.01216 for the ages between 65 and 70. Nevertheless, the following results show that the effect of the mortality on the optimal solution of the problem of minimizing the average age of the members is not negligible,
even for the modest toleranceε= 1. We know already that forR= 7elections per year
the optimal average age of the members is 60.95. The young-to-old ratio isρ≈1.02. If zero mortality is assumed in the age range[40,70], then the calculated minimal average age is61.35, and the young-to-old ratio becomesρ≈0.75. Thus, the presently existing mortality “contributes” to a younger Academy, as is to be expected. On the other hand, somewhat surprisingly, in the case of zero mortality the optimal election policy shifts to older ages (ρis considerably smaller). The reason for this effect is that greater number of elections at older ages increase the intensity of exits due to reaching the maximal age
Table 1: Probability of dying between ages 40 and 70 by educational attain-ment and marital status, males and females, Finland, Bulgaria, and the United States in the 1990s
Elections per year Average age Marginal “cost” of election
6 60.51
7 60.95 0.44
8 61.76 0.81
9 62.78 1.02
10 64.00 1.22
6. Conclusions
Henry (1971, 1972, 1975) pioneered the study of hierarchical organizations. In his stud-ies on the French civil service, he showed how fluctuations in the rate of intake influence promotion through the ranks and the age structure of the organization. Another impor-tant contribution goes back to Keyfitz (1973, 1977) who studied the differences in career opportunities in growing and stagnating organizations.
In a recent study, Leridon (2004) provided a remarkable analysis of the dynamics of the French Academie des Sciences between 1666 and 2030. In a follow-up paper, (Feichtinger et al. 2007) reconstructed the population of the Austrian Academy of Sci-ences from 1847 to 2005. Based on alternative scenarios of the age distribution of incom-ing members, we then projected the population of the Austrian Academy forward in time. In the present paper, we introduced an optimal control model to determine the optimal trade-off between the two conflicting goals: average age of the society and number of recruitments per year. Our results indicate that it is optimal to elect new members who are either young or old, with as few middle-aged recruits as possible.
It should be noted that the U-shaped recruitment policy is precisely the opposite of the observed election pattern seen in national academies (compare Leridon 2004 and Feichtinger et al. 2007).
Extensions of the problem considered in the paper for a non-stationary population are presented in Feichtinger and Veliov (2007).
after five years? This brings us back to learned societies in which corresponding members wait for a promotion to full membership. We may ask which promotion policies with respect to quantum and timing should be implemented by an academy. Drastic cuts in the chances of tenure may severely diminish the loyalty of lower-level members. The design of optimal recruitment and promotion patterns would be an interesting task for future research.
7. Acknowledgement
References
Cohen, J. (2003). How many members could the National Academy of Sciences have? Mimeo. New York, NY, USA: Rockefeller University and Columbia University. Cohen, J. (2006). The resident membership of the American Philosophical Society:
De-mographic aspects. Manuscript from the author. New York, NY, USA: Rockefeller University.
Feichtinger, G. and Veliov, V. (2007). On a distributed control problem arising in dynamic
optimization of a fixed-size population. SIAM Journal of Optimization18(3): 980–
1003.doi: 10.1137/06066148X.
Feichtinger, G., Winkler-Dworak, M., Freund, I., and Prskawetz, A. (2007). On the Age Dynamics of Learned Societies: Taking the Example of the Austrian Academy of Sci-ences. Technical report. VID Working Paper 02/2007.
Henry, L. (1971). Pyramides, statuts et carrières. I. Avancement à l’ancienneté. Sélection.
Population26(3): 463–486.
Henry, L. (1972). Pyramides, statuts et carrières. II. Avancement au choix. Population
27(4-5): 599–636.
Henry, L. (1975). Perspectives d’évolution d’un corps.Population30(2): 241–270.
Keyfitz, N. (1973). Individual mobility in a stationary population. Population Studies
27(2): 335–352.doi: 10.2307/2173401.
Keyfitz, N. (1977).Applied Mathematical Demography. New York: Wiley & Sons.
Leridon, H. (2004). The demography of a learned society. The Académie des Sciences
(Institut de France), 1666-2030.Population-E59(1): 81–114.
Pontryagin, L., Boltyanskii, V., Gamkrelidze, R., and Mishchenko, E. (1962). The
math-ematical theory of optimal processes. NY: Wiley.
van de Kaa, D. and de Roo, Y. (2006). The Members of the Royal Netherlands Academy of Arts and Sciences: 1808 to 2000. A demographic view. Manuscript.
Vaupel, J. (1981). Over-tenured universities: the mathematics of reduction.Management