in the population sciences published by the Max Planck Institute for Demographic Research
Konrad-Zuse Str. 1, D-18057 Rostock·GERMANY
www.demographic-research.org
DEMOGRAPHIC RESEARCH
VOLUME 16, ARTICLE 7, PAGES 195-218
PUBLISHED 08 MARCH 2007
http://www.demographic-research.org/Volumes/Vol16/7/ DOI: 10.4054/DemRes.2007.16.7
Research Article
Demographic transitions and children’s
resources: Bonus or divergence?
Parfait M. Eloundou-Enyegue
C. Shannon Stokes
c
°2007 Eloundou-Enyegue & Stokes
1 Introduction 196
2 Theory 196
2.1 Dilution and divergence 196
2.2 Integration 197
2.3 Implications 200
2.3.1 Additivity 200
2.3.2 Interactivity 201
2.3.3 Distributional considerations 201
3 Empirical illustration 202
3.1 Data and measures 202
3.1.1 Family size (Sjt) 202
3.1.2 Family structure (wjt) 203
3.1.3 Resource dilution coefficients (βSandβT) 203
3.2 Methods of analysis 204
3.3 Findings 206
3.3.1 Cameroon’s transition 206
3.3.2 Resource implications 206
3.3.3 Decomposition results 208
3.3.4 Simulation results 211
4 Conclusion and discussion 213
5 Acknowledgement 214
Demographic transitions and children’s resources:
Bonus or divergence?
Parfait M. Eloundou-Enyegue1
C. Shannon Stokes2
Abstract
How do fertility transitions affect childrenŠs resources? Existing perspectives provide two seemingly different answers: ¸SDilution ˇT arguments focusing on family size predict growth in average resources, while ¸Sdivergence ˇT arguments focusing on family structure predict increased inequality. We suggest that these two perspectives are complementary and reconcilable within an integrated framework. Under this expanded framework, fertil-ity transitions affect both average resource levels and inequalfertil-ity, and these effects depend on both the quantum and locus of fertility change, as well as on accompanying changes in family structure. Failure to consider these various characteristics of transitions and their interactions can bias estimation of transition-related changes in childrenŠs outcomes. We illustrate with data from Cameroon.
1P.M. Eloundou-Enyegue is Associate Professor of Development Sociology and Demography, Cornell
Uni-versity. E-mail: [email protected]
2C.S. Stokes is Professor of Rural Sociology and Demography, The Pennsylvania State University. E-mail:
1.
Introduction
How do demographic transitions affect the family resources available to children? Cur-rent demographic theory offers two seemingly distinct predictions. On the one hand, “resource dilution” perspectives predict a bonus: As fertility declines, societies concen-trate resources on smaller birth cohorts in ways that raise the average endowments of individual children (Blake 1981; Lloyd 1994; Downey 1995; Birdsall, Kelly and Sinding 2001). On the other hand, a more recent perspective (hereafter labeled “divergence”) pre-dicts growing inequality, warning that “trends associated with the second demographic transition [notably changes in family structure . . . are] leading to greater disparities in children’s resources” (McLanahan 2004:607).
Both perspectives are insightful but partial in their focus, whether on the left-hand or right-hand sides of the transition-resource link. On the left-hand side, dilution arguments emphasize changes in family size while the divergence argument emphasizes change in family structure. On the right-hand side, dilution arguments address average resource levels while the divergence argument addresses resource inequality. An integration of these two perspectives is warranted since contemporary fertility transitions often involve changes in both family size and structure but also because the welfare of children depends on both average endowments and inequality. The benefits of integration would be twofold: It would (1) broaden theoretical focus and (2) refine empirical estimation of the changes in children’s resources associated with demographic transitions.
The purpose of this paper is to attempt such integration. The paper is organized around two main sections. The first, theoretical, section summarizes and integrates the dilution and divergence arguments, then draws the implications of this integrated framework. A second, empirical, section illustrates these implications with data from Cameroon. The main caveats in this theoretical argument and its empirical illustration are discussed in a concluding section.
2.
Theory
2.1 Dilution and divergence
proportion of children living in large families (Knodel et al. 1990; Bhat 2002) or age dependency ratios (Birdsall et al. 2001). Despite these differences, dilution arguments concur on three points that contrast with the divergence perspective. First, they define fertility transitions quantitatively in terms of the number of births or closely-related out-comes like family size or age dependency, whereas the divergence argument focuses on qualitative changes in the structure of families and the family contexts under which births occur (McLanahan 2004). Second, dilution arguments focus on changes in average re-sources while divergence arguments emphasize inequality. Third, dilution arguments are today usually invoked for high-fertility settings, whereas divergence arguments are em-phasized in lower-fertility settings undergoing their “second” transition, i.e., such changes as “delays in fertility and marriage; increases in cohabitation, divorce, and non-marital childbearing; and increases in maternal employment” (McLanahan 2004:607).
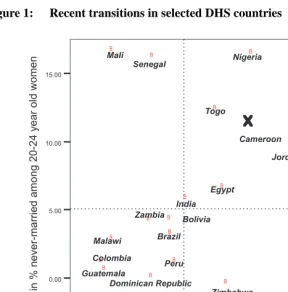
While it is tempting to restrict divergence to the second transitions in lower-fertility nations and to restrict dilution processes to high-fertility countries, such a two-tiered the-ory is limiting: The changes in family structure identified as hallmarks of the second transition do not occur uniformly across developed nations (Raymo et al. 2004) nor are they confined to these nations (Lloyd 2005; Williams et al. 2005). Figure 1 shows recent changes in family size and marriage in 23 developing nations. Over this period, some countries (Columbia, The Dominican Republic, Guatemala; Malawi, Rwanda, Uganda) experienced little change in either marriage or fertility. Other countries experienced uni-dimensional transitions, whether in fertility (Zimbabwe, Kenya) or marriage (Mali, Sene-gal). Finally, a cluster of countries experienced changes in both fertility and marriage (Cameroon, Egypt, Jordan, Ghana, Nigeria, and Togo). For such countries, focusing ex-clusively on family size would miss part of the picture. A fuller appraisal of the effects of fertility transitions requires insights from both dilution and divergence perspectives.
2.2 Integration
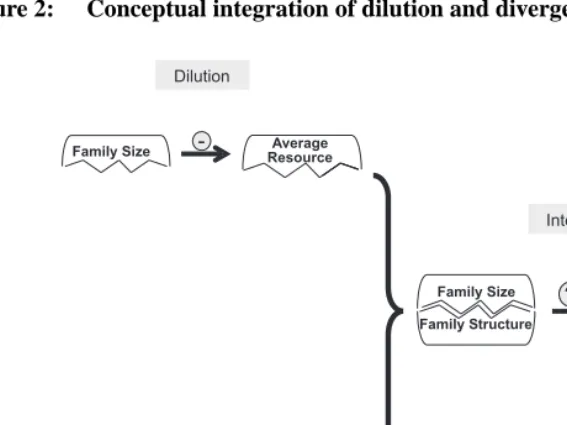
Conceptually, the proposed integration merely juxtaposes the dilution and divergence ar-guments, as they play out at a macro-level (Figure 2). While dilution arguments link declines in fertility to growth in average resource endowments, and the divergence argu-ment links changing family structure to increased inequality, their juxtaposition covers both aspects of fertility transitions (changes in family size and structure) and both out-comes (average resources and resource inequality).
Figure 1: Recent transitions in selected DHS countries
Notes: Selected countries include countries where at least two DHS surveys were fielded over the last two
decades, with an inter-survey period of 7+ years (6 years in the case of India). For specific survey years per country, see www.measuredhs.com. Since the inter-survey period varied across countries, the changes were pro-rated to a 10-year period.
Figure 2: Conceptual integration of dilution and divergence arguments
can be expressed at any time (t) as a weighted average of resource levels within family types
Rt=
j wjtXjt
[1]
wherewjt= proportion of children in families of typej
Xjt= level of resource per child in this family type.
Further, Xjt=C−(βSSjt+βTTj) [2]
whereC= the resource endowment for a child in the reference family type
βSandβT = resource dilution coefficients associated with
family size (S) and family structure (T), respectively.
The change in average resource levels between two time points is:
∆R= [∆wj∗Xj] + [∆Xj∗wj] [3]
∆R= [∆wj∗Xj] + [βs∗∆Sj∗wj] [4]
whereXjandwjrepresent the average resource endowment and prevalence
of each family type during this period (e.g.wj = [wj(t+1)+wj(t)]/2).
Expression [4a] thus indicates that the change in average resource level results from addition of a “family structure component” associated with changes in the distribution of family types, and of a “family size component” associated with changes in family size within family types.
One can similarly decompose the change in resource inequality. A decomposable measure of inequality is the mean logarithmic deviation (MLD):
MLDt
j wjt
log(1/rjt) [5]
whererjtis the resource ratio of groupj,rjt=Xjt/Rt. [6]
Following work on income inequality by Firebaugh and Goesling (2004), the change in MLD can be decomposed as:
∆MLD∼= [
j (rj−lnrj)∆wj] + [
j (wjrj−wj)∆ ln(rj)] [7]
∆MLD≈[Structure component] + [Size component]. [7a]
As in [4], the total change in resource inequality results from addition of a “family structure component” and of a “family size component”.
2.3 Implications
The proposed framework implies that the dilution and divergence perspectives are com-plementary and reconcilable. They can in fact be seen as two special cases of the same framework. The dilution argument can be viewed as a special case where one assumes a uni-dimensional transition in family size only (i.e., allwj = 0). In this case, equa-tion [4] reduces to its second bracketed term. A decline in fertility (mostSj <0) will increase the average level of resources (sinceβsis also negative) as predicted by dilu-tion arguments. Conversely, the divergence argument can also be seen as a special case involving no change in the quantum and distribution of fertility (i.e., allSj = 0) but some change in aggregate family structure, i.e., in the prevalence of different family types (i.e., somewj = 0). In this case, equation [7] reduces to its first bracketed term. In practice, fertility transitions often combine the two idealized types outlined above. Ac-cordingly, their resource implications will reflect the joint influences of changes in family size and structure. As we argue below, this warrants attention to the additive, interactive and distributional influences of fertility transitions.
2.3.1 Additivity
component.” These “size” and “structure” components can offset or compound each other.
Proposition P1. The resource implications of fertility transitions depend ad-ditively on two components reflecting the influences of “family size” and “family structure,” respectively. Failure to add the two components can bias understanding of the magnitude or even direction of the resource implications of transitions.
2.3.2 Interactivity
While the resource implications of transitions require adding two components, either com-ponent reflects in fact some interaction between family size and structure. These interac-tions are visible in the formulas in [4] and [7]. In [4] for instance, the “size component” depends on changes in family size (theSj) but also on the average prevalence of each family type (thewj). Conversely, the “structure component” depends on changes in fam-ily structure (thewj) but also on the average resource endowment (theXj). Overall, how much a decline in fertility affects the resources of children depends on patterns and changes in family structure. Conversely, how much a change in family structure affects the resources of children will depend on the levels and changes in fertility. For these rea-sons, one expects the following:
Proposition P2. The implications of a dual fertility transition (i.e., one in-volving change in both family size and structure) are more than the mere sum of two uni-dimensional transitions (i.e., one involving change in family size only and the other involving change in family structure only).
2.3.3 Distributional considerations
The resource implications of a decline in national fertility depend not only on the mag-nitude of this decline, but also on how it is distributed across the national population. Intuitively, an even decline is less likely to exacerbate inequality than one concentrated among high SES groups. The relevance of distributional aspects can be seen in formulas [4] and [7] where the size component depends on group-specific changes in family size (theSj) or in resource ratios (therj). Put differently, the resource implications of fertility transitions depend not only on the quantum of fertility change but also on its lo-cus, i.e., how this change is distributed across family types. A third proposition is thus
fertility will have different implications depending on how evenly this decline occurs across the national population.
3.
Empirical illustration
3.1 Data and measures
Although our argument is framed at the macro-level – it examines the national changes in average resources and resource inequality that accompany demographic transitions – its empirical illustration requires micro-level data. The data used in this paper came from a demographic survey (Enquête Population Scolarisation II or EPS II) completed in 1999 in Cameroon. The survey used life history calendars to retrospectively reconstruct the demo-graphic histories of a nationally representative sample of 3,369 women and their families. These data were used to create appropriate fertility history and schooling history data sets to generate estimates for the key framework measures, including period-specific measures of fertility and family structure (theSjtandwjt) but also resource dilution coefficients associated with family size and structure (βS andβT). Details on this survey and data can be found elsewhere (Eloundou-Enyegue and Williams 2006). The resulting data were consistent with other national estimates of fertility, schooling, and employment, and with known trends and patterns in these outcomes. In particular, our TFR estimates for 1991 and 1998 (5.8 and 4.6, respectively) were close to the Cameroon DHS estimates for these years (5.8 and 4.8 respectively). However, because maternal residence is measured here as time-varying (rather than time-invariant as is the case in the CDHS), our estimates of rural fertility (6.5 for 1991 and 5.4 for 1998) were higher than CDHS estimates (6.3 and 5.4) and our estimates of urban fertility (4.9 and 3.7) were lower than CDHS estimates (5.2 and 3.8, respectively).
3.1.1 Family size (Sjt)
3.1.2 Family structure (wjt)
Family structure, at the aggregate level, reflects the relative representation (wjt) of dif-ferent family types. Types can be defined on the basis of several criteria, but we selected maternal marital status and residence, as well as father’s employment, because of their direct relevance for the material resources and opportunities available to children. All three variables were dichotomized. Maternal residence distinguished between rural and urban mothers; marital status distinguished between married versus unmarried mothers (whether single, divorced/separated, or widowed); father’s employment distinguished be-tween fathers employed off-farm and those who were not. Based on these dichotomized criteria, five family types were created, including families with mothers that were “rural and unmarried,” “rural married,” “urban unmarried,” “urban married with an unemployed partner,” “urban married with an employed partner,” respectively. Among married rural women, no distinction was made between women with employed and those with unem-ployed partners because few women were found in the latter category.
3.1.3 Resource dilution coefficients (βSandβT)
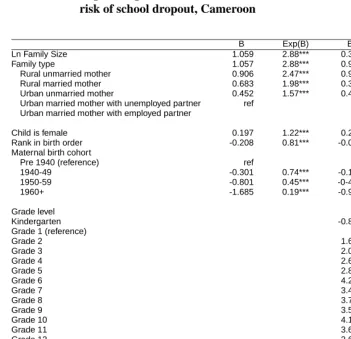
Family size and structure are both expected to affect/dilute the resources available to children, including material resources (e.g., money) and non-material ones (e.g., time, attention, parenting experience). While both material and non-material resources are im-portant (Blake 1989; Mauldon 1990; McLanahan 2004), they are not fungible or easily convertible into the same unit, making it difficult to evaluate their dilution along a com-mon metric. Our conversion strategy was to use as a comcom-mon metric the statistical effects on an important resource-related outcome such as school dropout. Since this outcome is dichotomous, the dilution coefficients associated with family size and type (βS andβT, respectively) were derived from logistic regression analysis of the effects of correspond-ing variables on school dropout (see Table A1 in appendix) and were expressed in odds ratio units. For the same reasons, instead of being obtained by subtraction from a baseline (as per the additive model in equation [2]), resource dilution is obtained by division from a baseline, specifically
Xjt=C/[(βSSjt)∗(βTT j)]. [2a]
to an unemployed partner is expected, on average, to have a resource index of about
100/[(1.1)3∗(1.2)]or about 62.6.
3.2 Methods of analysis
Three analyses are used to meet the study objectives, and they include a basic estimation, decomposition, and simulation. The first step is to estimate the implications of fertility transitions for average resource levels and for inequality. Using the input measures de-scribed above, the resource indices at the group level are computed by applying equation [2a]. Group-specific values are then aggregated (using equation [1]) to obtain the national resource level. Likewise, equation [6] is applied to calculate group-specific resource ra-tios (rjt), and then these values are aggregated (as per equation [5]) to obtain the overall resource inequality. Marginal changes in average values and inequality (respectively) in-dicate the bonus and divergence from transitions (respectively). Following this overall estimation, decomposition (as per formulas [4] and [7]) is used to illustrate our theoreti-cal proposition P1, about the additivity of “size” and “structure” components of fertility transitions.
To illustrate the theoretical propositions P2 and P3, simulation is used. Two hypothet-ical scenarios are considered. The first is designed to illustrate P2 (about interactivity) and involves estimating resource implications under different assumptions about the makeup of Cameroon’s transition. Specifically, we simulate the resource implications that would be observed if a) Cameroon’s transition had involved change in fertility with no change in family structure, and b) Cameroon’s transition had conversely involved a change in family structure with no change in fertility. The presence of an interaction is inferred from comparison of the sum of these two unidimensional transitions with Cameroon’s ac-tual transition, which involved change in both family size and structure. If the influences of family size and family structure do not interact, then the sum of the resource impli-cations of the two uni-dimensional transitions should equal the resource impliimpli-cations of Cameroon’s dual transition.
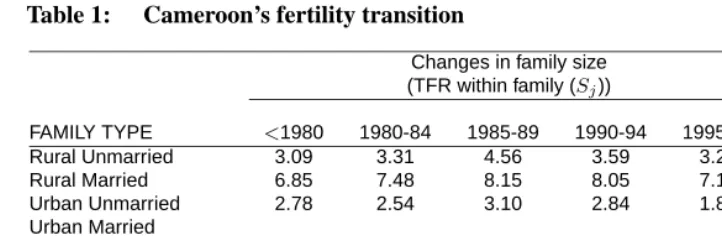
Table 1: Cameroon’s fertility transition
Changes in family size (TFR within family (Sj))
Sj
FAMILY TYPE <1980 1980-84 1985-89 1990-94 1995-98 Rural Unmarried 3.09 3.31 4.56 3.59 3.26 0.17
Rural Married 6.85 7.48 8.15 8.05 7.16 0.31
Urban Unmarried 2.78 2.54 3.10 2.84 1.88 -0.90 Urban Married
Unemployed Partner 7.01 7.62 7.19 7.74 5.68 -1.33 Urban Married
Employed Partner 7.08 7.79 7.92 6.32 5.71 -1.37
AVERAGE 5.86 6.21 6.54 5.67 4.66 -1.20
Changes in family structure (proportion in family type (wj))
From mother’s perspective
wj
FAMILY TYPE <1980 1980-84 1985-89 1990-94 1995-98
Rural Unmarried 0.182 0.138 0.130 0.147 0.174 -0.008 Rural Married 0.500 0.441 0.411 0.371 0.360 -0.140 Urban Unmarried 0.111 0.162 0.208 0.280 0.304 0.193 Urban Married
Unemployed Partner 0.081 0.078 0.074 0.054 0.042 -0.039 Urban Married
Employed Partner 0.126 0.181 0.177 0.148 0.120 -0.006
TOTAL 1.0 1.0 1.0 1.0 1.0
Changes in family structure (proportion in family type (wj))
From children’s perspective
wj
FAMILY TYPE <1980 1980-84 1985-89 1990-94 1995-98
Rural Unmarried 0.098 0.074 0.091 0.093 0.122 0.025 Rural Married 0.595 0.535 0.514 0.527 0.556 -0.040 Urban Unmarried 0.054 0.067 0.099 0.140 0.123 0.070 Urban Married
Unemployed Partner 0.099 0.096 0.082 0.074 0.051 -0.047 Urban Married
Employed Partner 0.155 0.228 0.215 0.165 0.148 -0.007
3.3 Findings
3.3.1 Cameroon’s transition
Table 1 shows Cameroon’s transition in some detail. It shows, for successive time peri-ods (<1980, 1980-84, 1985-89, 1990-94, and 1995-98), the fertility levels within family type as well as the prevalence of each family type. The trends in national fertility were plateau-shaped, similar to many African countries over the last three decades. Compared to pre-1980 levels, the national TFR increased and stayed above 6 in the 1980s, then de-clined in the 1990s. This decline was more pronounced among urban than rural women. However, it was more uniform across the marital and employment categories considered here. Importantly, Cameroon’s decline in fertility was accompanied by changes in family structure, specifically an increase in the percentage of urban unmarried mothers (from 11.1 percent before the 1980s to 30.4 percent in 1995-98) and a remarkable decline in the percentage of rural married mothers (from 50 percent before the 1980s to 30.4 percent in 1995-98). Such transformations in family structure should affect the resource endow-ments of children at the national level, if family types vary in the resources availed to children. Transformations in family structure can be examined from the perspective of mothers or from the perspective of children (Preston 1976), the latter being more relevant here. An analysis from children’s perspective shows similar, but less dramatic, changes in family structure. The percentage of children born to rural married mothers decreased from about 59 to 55 percent, while the percentage born to urban unmarried women in-creased from 5 to 12 percent. Although these changes were not linear, the main point here is that Cameroon’s transition was dual in nature, affecting both fertility levels and family structure.
3.3.2 Resource implications
Figure 3: Trends in children’s resource levels and inequality
bonus. The next issue is to understand which aspects of Cameroon’s transition account for these changes.
3.3.3 Decomposition results
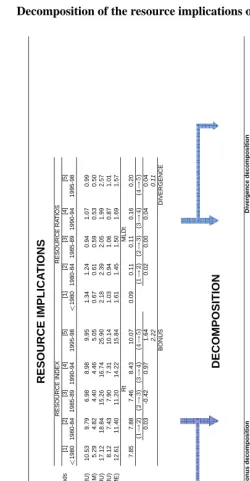
The decomposition results are presented in detail in Table 3 and summarized in Fig-ure 4. The leftmost frame in FigFig-ure 4 shows the change in average resource endow-ment (bonus) between consecutive periods while the rightmost frame shows the change in average resource inequality (divergence). The frames also show the decomposition re-sults in nominal units, specifically, how much the “size” and “structure” components of Cameroon’s transition contributed to the national bonus and divergence, respectively. Re-sults are shown for adjacent periods but also (in Table 3) for the overall change between the pre-1980 and 1995-98 periods.
Figure 4: Decomposition results for the contributions of “size” and “structure” components to changes in resource levels and inequality (Cameroon)
riod between the pre-1980s and 1995-98, the decomposition results (Table 3) indicate that the “size component” of Cameroon’s transition accounted for about 55 percent of the bonus while the “structure component” accounted for 45 percent of the bonus. The findings in Figure 4 and Table 3 thus illustrate the study proposition about the additiv-ity of “size” and “structure” components of fertiladditiv-ity transitions (P1). Because each of these two components accounts for a sizeable portion of the total bonus, focusing exclu-sively on either one component would substantially bias estimation of the total bonus. The direction and extent of this bias vary. For the overall change between the pre-1980 and 1995-98 periods, the contributions of the “size” and “structure” components to the bonus were both positive (1.21 and 1.01, respectively). Therefore, failure to consider ei-ther component would under-estimate the total bonus. For some of the marginal changes between adjacent periods (e.g., between pre-1980s and 1980-84 (point A in Figure 4) or between 1985-89 (point B in Figure 4)), failure to consider the influences of changing family structure would under-estimate the bonus. For other periods (between 1995-98 pe-riod (point D in Figure 4)), failure to consider the influences of changing family structure would overestimate the bonus.
gen-erally increased over time, with much of this divergence occurring during the 1990s. De-composition analysis for the entire period between the pre-1980s and 1995-98 (Table 3) indicates that the "size" component of Cameroon’s transition accounted for 74% of this divergence, while the “structure” component accounted for the remaining 26%. Again, failure to consider either component would bias estimation of the total change in resource inequality during this period. Remarkably, the “size” component –not the “structure” component– explains a larger share of the divergence in children’s resources, a finding that draws attention to the distributional aspect of fertility change. This point is consid-ered further in the following section. For now, the key insight from this decomposition is to underscore the importance of adding the “size” and “structure” components, if one is to fully estimate the resource transformations accompanying fertility transitions.
3.3.4 Simulation results
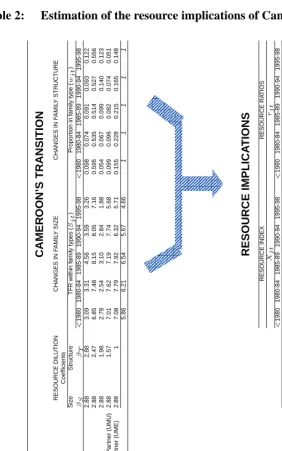
The framework’s second proposition (P2) posits an interaction between changes in fer-tility and family structure. The question here is whether the impact of a dual transition (in family size and structure) is the mere sum of changes from the corresponding uni-dimensional transitions (one in family size only and the other in family structure only). This proposition was tested through simulation. The results, shown in Table 4, indicate the following. A uni-dimensional transition in fertility would yield a 12% bonus (rather than the 28% under the actual scenario) and a 78% divergence (rather than the 122% un-der the actual scenario). Likewise, a uni-dimensional transition in family structure would yield a 10% bonus and a 22% divergence. The sum of these two uni-dimensional tran-sitions amounts to a bonus of 22% and a divergence of 100%, i.e., lower values than observed under Cameroon’s actual (dual) transition. The difference in results between this dual transition and the sum of its corresponding uni-dimensional transitions reflects the interaction between change in family size and structure. These interactions are im-portant. Even for an analyst solely interested in the influences of changing family size on children’s outcomes, these influences depend on patterns and change in family structure.
Table 4: Simulation of the resource implications of Cameroon’s transition, under different hypothetical scenarios
4.
Conclusion and discussion
We suggest in this paper that an integration of existing dilution and divergence perspec-tives can improve understanding of the resource implications of fertility transitions. The integration broadens analytic focus by jointly considering the influences of family size and structure, while also documenting change in both average resource level and inequal-ity. One basic point made throughout the paper is that transitions affect both average resource levels and inequality, with the nature and magnitude of these changes reflect-ing the joint influences of transformations in family size and structure. Additionally, the integrated framework refines estimation, by drawing attention to interaction and distri-butional considerations. The resource implications of fertility transitions do not depend only on the quantum of fertility decline, but on its locus. Furthermore, it is important to consider the make-up of transitions, i.e., the extent to which fertility declines occur along-side changes in family structure. Ignoring these interactions and distributional aspects can bias understanding of the resource implications of transitions, as the case of Cameroon indicates.
Several caveats must be considered in discussing this framework’s insights and its purported link between fertility transitions and children’s resources. The first is about causation, i.e., whether it is reasonable to view fertility transitions as exogenously caus-ing changes in children’s resources. Rather than exogenous developments, fertility tran-sitions could instead be the result of changing preferences and norms regarding parental investments in children, themselves driven in part by changes in the returns to invest-ments in child quality. While one can view many recent transitions as a response to the exogenous influences of economic downturns or family planning programs (NAS 1993; Bongaarts 1994; Tsui 2001), at least some of these declines may also reflect change in parental quantity/quality tradeoffs (Becker 1960; Pritchett 1994; Galor and Weil 2000). In the latter case, the observed changes in children’s resources should be viewed at best as accompanying –rather than stemming from– transitions.
and the regression coefficients associated with family size (structure, respectively) is not unproblematic. Research in this area acknowledges the difficulty in making causal in-ferences about the effects of family size or structure (Ginther and Pollack 2004; Moffit 2005). Despite control for many covariates (grade level, child’s ability, birth order, mater-nal birth cohort, sex, and selection), estimates of these coefficients can be biased if other family-level and supply-side determinants are missing. At the other end, over-control for covariates –some of which could be mediator variables– can obscure the total relationship between these family factors and schooling outcomes (see Psacharapoulos and Patrinos (2003) in the case of earning returns to education). We presented both the gross and net di-lution coefficients but used only the gross coefficients. Analyses based on net coefficients yield similar conclusions. However, the relative contributions of family size and structure depend on how adjustment for covariates affects their respective dilution coefficients.
A third general caveat is about generalization. Since our empirical study is based on a single country, the question arises how the patterns noted in this study apply else-where. As Figure 1 indicates, recent national transitions in developing countries vary in their makeup. One would therefore expect cross-country variation in the bonus and di-vergence that accompany fertility transitions. To study this variation, our future research will use DHS data and extend analysis to a sample of countries with contrasting transition experiences.
5.
Acknowledgement
References
Becker, G. S. 1960. “An Economic Analysis of Fertility.” Pp. 209-231 in National Bu-reau of Economic Research (ed). Demographic and Economic Change in Developed Countries. Princeton: Princeton University Press.
Bhat, P.N. 2002. Demographic Transition, Family Size and Child Schooling. National Council of Applied Economic Research Working Paper Series no 86. (New Delhi, India).
Birdsall, N., A. Kelly and S. Sinding (eds.) 2001. Population Matters: Demographic Change, Economic Growth, and Poverty in the Developing World. New York: Ox-ford University Press.
Blake J. 1981. “Family Size and the Quality of Children.” Demography 18(4):421-442.
Blake, J. 1989. Family Size and Achievement. University of California Press.
Bongaarts, J. 1994. “The Impact of Population Policies: Comment.” Population and De-velopment Review 20:616-620.
Cassen, R. (ed.). 1994. Population and Development: Old Debates, New Conclusions. Washington D.C. Overseas Development Council.
Demographic and Health Surveys (DHS). 2004. StatCompiler, ORC, Macro. Measure DHS+ Project. Available on line at http://www.measuredhs.com.
Downey, D.B. 1995. “When Bigger is not Better: Family Size, Parental Resources, and Children’s Educational Performance.” American Sociological Review 60 (October): 746-761.
Easterlin, R.A. 1987. Birth and Fortune: The Impact of Numbers on Personal Welfare. Chicago: University of Chicago.
Eloundou-Enyegue P.M. and L.B. Williams. 2006. “Family Size and Schooling in Sub-Saharan African Settings: A Reexamination.” Demography 43(1):25-52.
Firebaugh, G. and B. Goesling. 2004. “Accounting for the Recent Decline in Global In-come Inequality.” American Journal of Sociology 110(2):283-312.
Ginther, D.K. and R.A. Pollack. 2004. “Family Structure and Children’s Educational Out-comes: Blended Families, Stylized Facts, and Descriptive Regressions.” Demogra-phy 41(4):671-696.
Knodel, J., N. Havanon, and W. Sittitrai. 1990. “Family Size and the Education of Chil-dren in the Context of Rapid Fertility Decline.” Population and Development Review 16 (1):31-62.
Lesthaeghe, R. 1995. “The Second Demographic Transition in Western Countries: An Interpretation.” Pp. 17-62 in Gender and Family Change in Industrialized Countries, edited by K. Mason and A. Jensen. Oxford: Clarendon Press.
Lloyd, C.B. 1994. “Investing in the Next Generation: the Implications of High Fertility at the Level of the Family.” Research Division Working Papers, No. 63. New York: The Population Council.
Lloyd, C.B. 2005. Growing Up Global. Washington DC. National Academy Press.
Mauldon, J. 1990. “The Effect of Marital Disruption on Children’s Health.” Demography 27(3):431-446.
McLanahan, S. 2004. “Diverging Destinies: How Children Are Faring Under the Second Demographic Transition.” Demography 41(4):607-627.
Moffit, R. 2005. “Remarks on the Analysis of Causal Relationships in Population Re-search.” Demography 42(1):91-108.
National Academy of Sciences (NAS). 1993. Demographic Effects of Economic Reversals in sub-Saharan Africa. Washington DC: National Academy Press.
Preston, S. H. 1976. “Family Sizes of Children and Family Sizes of Women.” Demogra-phy 13(1):105-114.
Pritchett, L. H. 1994. “Desired Fertility and the Impact of Population Policies.” Population and Development Review 20:1-55.
Psacharapoulos G. and H.A. Patrinos. 2004 “Returns to Investments in Education: A Further Update.” Education Economics 12(2):111-134.
Raymo J.M., L. Bumpass, and M. Iwasawa. 2004. “Marital Dissolution in Japan.” Demo-graphic Research vol. 11-14:396-419.
Tsui, A. O. 2001. “Population Policies, Family Planning Programs, and Fertility: The Record.” Global Fertility Transition (Supplement to Population and Development Review 27:184-204.) Eds. R. A. Bulatao and J. B. Casterline.
Appendix
Table A1: Logistic regression results for the effects of selected variables on the
risk of school dropout, Cameroon
B Exp(B) B Exp(B)
Ln Family Size 1.059 2.88*** 0.317 1.37***
Family type 1.057 2.88*** 0.914 2.50***
Rural unmarried mother 0.906 2.47*** 0.945 2.57***
Rural married mother 0.683 1.98*** 0.381 1.46***
Urban unmarried mother 0.452 1.57*** 0.495 1.64***
Urban married mother with unemployed partner ref ref
Urban married mother with employed partner
Child is female 0.197 1.22*** 0.257 1.29***
Rank in birth order -0.208 0.81*** -0.098 0.91***
Maternal birth cohort
Pre 1940 (reference) ref ref
1940-49 -0.301 0.74*** -0.191 0.83***
1950-59 -0.801 0.45*** -0-494 0.61***
1960+ -1.685 0.19*** -0.927 0.40***
Grade level
Kindergarten -0.846 0.43***
Grade 1 (reference) ref
Grade 2 1.636 5.13***
Grade 3 2.015 7.50***
Grade 4 2.608 13.58***
Grade 5 2.885 17.90***
Grade 6 4.293 73.19***
Grade 7 3.490 32.78***
Grade 8 3.778 43.72***
Grade 9 3.514 33.58***
Grade 10 4.147 63.24***
Grade 11 3.600 36.61***
Grade 12 3.645 38.29***
Grade 13 3.881 48.46***
Grade 14 3.216 24.92***
Grade 15 3.867 47.81***
Grade 16 5.283 196.88***
Grade 17+ 4.083 59.34***
Child repeats current grade 1.185 3.27***
Child repeats current grade for nth time (n>1) 1.149 3.16***
Index of inordinate ability 0.355 1.43
Constant -4.522 0.01*** -4.366 0.01***
N person years=63,338; N events=2,684