Patron: Her Majesty The Queen Rothamsted Research Harpenden, Herts, AL5 2JQ
Telephone: +44 (0)1582 763133 Web: http://www.rothamsted.ac.uk/
Rothamsted Repository Download
A - Papers appearing in refereed journals
Williams, R. J. B. and Cooke, G. W. 1962. Measuring soluble phosphorus
in soils, comparisons of methods, and interpretation of results. The
Journal of Agricultural Science. 59 (2), pp. 275-280.
The publisher's version can be accessed at:
•
https://dx.doi.org/10.1017/S0021859600015318
The output can be accessed at:
https://repository.rothamsted.ac.uk/item/96y4q/measuring-soluble-phosphorus-in-soils-comparisons-of-methods-and-interpretation-of-results
.
© Please contact [email protected] for copyright queries.
Printed in Great Britain
275
Measuring soluble phosphorus in soils, comparisons of
methods, and interpretation of results
BY R. J. B. WILLIAMS AND G. W. COOKE
Rothamsted Experimental Station, Harpenden, Herts
(Received 27 April 1962)
The only extensive correlations between soluble P in soils and responses of crops to P fertilizers published in Britain are those for sugar beet made by the late E. M. Crowther and summarized by Warren & Cooke (1962). Since Crowther's work was done, new methods of assessing ' available' P in soils have been developed but they have not been correlated with the results of field experiments. We thought that the following newer extractants were worth testing: (i) a mildly acid sodium acetate-acetic acid buffer solution developed by Morgan (1937) which is now used by some advisory chemists in England ; (ii) 0-5M sodium bicarbonate solution, developed in U.S.A. by Olsen, Cole & Watanabe (1954), is now used on calcareous soils in many countries; (iii) a neutral 0-01M solution of calcium chloride in water, suggested by Schofield (1955), measures the ionized phosphate immediately avail-able to crops.
In our work we have analysed soils from field experiments testing phosphate fertilizers both by some older methods and by these modern ones. The values for soluble soil P obtained by seven methods were compared with each other, and with the responses of the crops grown to superphosphate; they were also used to show a possible way of setting limiting values for soluble P that define ' deficient' soils.
EXPERIMENTAL SITES, SOILS AND CROPS
The field experiments, done from 1951 to 1956, were described by Cooke (1956) and by Cooke & Widdowson (1959); they were collaborative work between the U.K. Advisory Services and Rotham-sted Experimental Station. The main crops were potatoes, swedes and grass. A few experiments on other crops have been excluded, as have those where the field data were incomplete, or where there was no soil sample; 179 suitable experiments remained. Most of the experiments were in England and Wales, with some in eachN. A. A.S. Province, afew were in the east and north of Scotland, and some in Northern Ireland.
The experiments compared phosphate fertilizers,
and the sites were chosen by Advisory Soil Chemists in the expectation that the soils were' deficient' in P. This choice should have excluded all soils 'satis-factory' in 'available' P, but on some fields the crops did not respond to phosphate fertilizer. As the sites did not represent the full range of P-fertility met in practice, the series was unsuitable for general correlations between soil analyses and crop performance; but, as the soils had already been selected as 'P-deficient', the experiments tested drastically the use of the methods of analysis for distinguishing ' deficient' soils.
The results of 66 experiments on swedes, 72 on potatoes and 41 on grass are used in this paper. There were two types of experiments on both swedes and on potatoes, different phosphate ferti-lizers being compared in each (Cooke, 1956). Type I experiments were mostly in the west, and Type II in the east of U.K.; the two sets of data for each crop were treated separately. Most of the experiments tested 0, 0-33 and 0-66 cwt. P2O6/acre as
super-phosphate and three other super-phosphates, each applied at 0-5 cwt. P2O5/acre. Responses to 0-5 cwt. PaO6/
acre were calculated by averaging responses to the two rates of superphosphate. The level of soil P influences both yield of crops grown without added P and response to fertilizer P, so both quantities were correlated with soil analyses. The P contents of grass and swedes were treated in the same way as yields, but, as they provided no extra information on the comparisons between methods, details are not discussed here.
ANALYTICAL METHODS
Total P was determined on soil ground to pass a 0-5 mm. round-holed sieve; 'soluble' P was deter-mined on soil passing a 2 mm. round-holed sieve.
Total P
2 g. of soil was digested with 10 ml. of boiling 60 % HC1O4 for 5 hr. The digest was diluted with water
276
R. J. B. WILLIAMS AND G. W. COOKEHCl soluble P
12 g. of soil was shaken for 1 min. with 28 ml. 0 - 3 N - H C 1 a n d filtered. P was determined by a molybdenum blue method (Truog & Meyer, 1929), which was also used with t h e other methods described below.
H2SO4 soluble P
2 g. of soil was shaken for 30 min. with 400 ml. of 0 - 0 0 2 N - H2S O4 containing 3 g. (NH4)2SO4 per litre
a n d brought t o p H 3-0 (Truog, 1930).
Citric acid (H3Ci) soluble P
10 g. of soil was shaken for 24 hr. with 100 ml. of 1 % (w/v) H3Ci solution on an end-over-end shaker
(additional citric acid was added for calcareous soils (Dyer, 1894)). Before determining P , organic m a t t e r was removed b y ashing (Metson, 1956).
Acetic acid (HAc) soluble P
5 g. of soil was shaken for 6 hr. with 200 ml. of 0 - 5 N - H A C (Williams & Stewart, 1941).
Acetic acid-sodium acetate, buffer (HAc-NaAc) soluble P
5 g. soil was shaken for 15 min. with 25 ml. of Morgan's solution (at p H 4-8) (Tinsley & Pizer's (1946) modification of Morgan's (1937) method was used).
NaHCO3 soluble P
5 g. of soil was shaken for 30 min. with 100 ml. of 0-5M-NaHCO3 solution, buffered to p H 8-5 with
N a O H (Olsen et al. 1954). Decolorizing carbon was used when needed t o give a colourless extract.
P in equilibrium with CaCl2 solution
20 g. of soil was shaken a t intervals during 15 min. with 100 ml. of 0-1 M-CaCl2 solution (Schofield, 1955).
R E L A T I O N S H I P S B E T W E E N SOLUBLE P H O S P H O R U S I N SOILS AND
CROP R E S P O N S E
Increases in crop yields from superphosphate supplying 0-5 cwt. P2O6/acre were examined b y
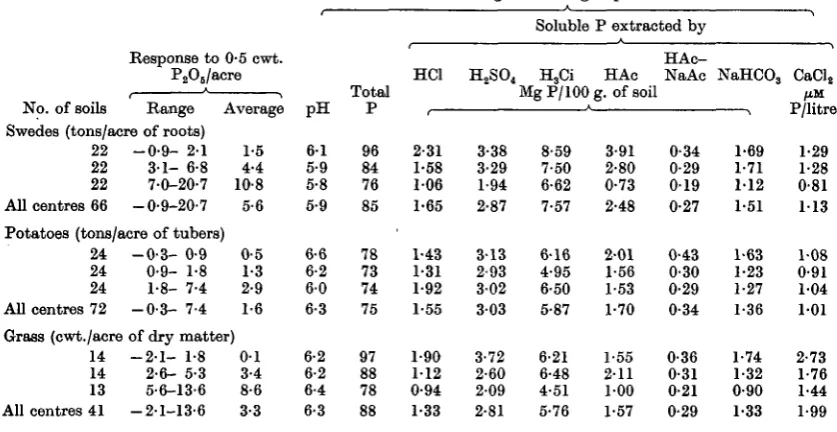
dividing all experiments on each crop into three groups, each of nearly equal numbers of centres, according to size of response. Table 1 gives average values for each group of soil p H , t o t a l soil P , a n d soluble soil P measured b y seven methods. I n t h e swede and p o t a t o experiments, b u t n o t in t h e grass series, t h e more responsive crops tended t o be on t h e more acid soils. The average a m o u n t s of total P in t h e soils were inversely proportional t o average responses b y swedes a n d grass to added super-phosphate, whereas average responses in t h e p o t a t o experiments were not related to total soil P . I n t h e swede experiments all t h e methods used to measure soluble P gave lowest average values in t h e group of experiments giving t h e largest responses; t h e HCl a n d H A c methods gave t h e largest contrasts between t h e average values for groups of sites showing large and small responses. All methods were much less successful in differentiating between groups of p o t a t o experiments showing low and high
Table 1. Relationships between soluble soil phosphate and crop responses to applied superphosphate
Average data for groups of soils
No. of soils
Response to 0-5 cwt. P2O6/acre
Range Swedes (tons/acre of roots)
22 22 22 All centres 66
- 0 - 9 - 2-1 3 1 - 6-8 7-0-20-7 -0-9-20-7
Potatoes (tons/acre of tubers) 24
24 24 All centres 72
Grass (cwt./acre 14 14 13 All centres 41
- 0 - 3 - 0-9 0-9- 1-8 1-8- 7-4 - 0 - 3 - 7-4
Average 1-5 4-4 10-8 5-6 i 0-5 1-3 2-9 1-6
3 of dry matter) - 2 - 1 - 1-8
2-6- 5-3 5-6-13-6 -2-1-13-6 0-1 3-4 8-6 3-3 pH 6 1 5-9 5-8 5-9 6-6 6-2 6 0 6-3 6-2 6-2 6-4 6-3 Trvtnl J. Utal P 96 84 76 85 • 78 73 74 75 97 88 78 88 HCl 2-31 1-58 1 0 6 1-65 1-43 1-31 1-92 1-55 1-90 1 1 2 0-94 1-33
H2SO4
3-38 3-29 1-94 2-87
3 1 3 2-93 3-02 3 0 3
3-72 2-60 2-09 2-81
Soluble
H3Ci
Mcr P/lAfl
P extracted by
HAc l u g JC1 1\J\J t±. VJ. a m
8-59 7-50 6-62 7-57 6-16 4-95 6-50 5-87 6-21 6-48 4-51 5-76 3-91 2-80 0-73 2-48
2 0 1 1-56 1-53 1-70 1-55 2-11 1-00 1-57 HAc-NaAc 0-34 0-29 0 1 9 0-27 0-43 0-30 0-29 0-34 0-36 0-31 0-21 0-29 NaHCOs 1-69 1-71 1 1 2 1-51 1-63 1-23 1-27 1-36 1-74 1-32 0-90 1-33 CaClj fJLaL P/litre 1-29 1-28 0-81 1 1 3
average responses; HAo, HAc-NaAc, and NaHCO3 all gave lower average values for soluble P in soils of t h e more responsive group; the other methods failed. I n the grass experiments, t h e HAc and H3Ci methods gave average values for soluble P t h a t were not regularly related to average responses; the other methods were better and the largest differences between the groups of experiments showing low and high average responses were with the HC1, NaHCO3 and CaCl2 methods.
Correlations were calculated between unmanured yields, increases in yields caused by superphosphate, and the soluble P values obtained by each of the methods used. Many of the correlations between soluble P in soil and crop performance were signi-ficant, but few of the coefficients were much greater than 0- 5 and detailed data are not presented. As the Type I and Type I I potato and swede experiments were treated separately, there were five sets of correlations between soil and crop results. The methods are ranked in Table 2 in order of correlation; 1 represents the highest correlation in each set, and 8 t h e lowest. Soil analyses and crop performance were poorly correlated in t h e potato and grass experiments, only three coefficients were significant out of 14 in the grass experiments and two out of 28 in t h e potato experiments, but half of the correlations in the swede experiments were signi-ficant. There were no significant correlations between soluble P in soils and the increases in the P contents of the crops caused by giving superphosphate in any of the groups of experiments, and data are not shown in Table 2. There were, however, many significant correlations between amounts of P taken from soil by crops receiving no superphosphate and the values for soluble P in the soils (Table 2). (The potato crops were not analysed.)
If an analytical method is to be generally useful, it must be consistently good for different crops and different kinds of soil; consistency was tested by listing t h e numbers of significant correlation coef-ficients achieved by each method for the sets of data in Table 2:
Numbers of significant correlations
Yield P in increases Yields crops grown
from P without P without P fertilizer fertilizer fertilizer With total soil P
With soil P soluble HC1
HaSO4 H3Ci HAc HAc-NaAc NaHC03 CaCl,
1 in 3 2 0 0 2 3 1
1
1 2 1 0 1 2 1
1
3 3 1 1 2 3 1
Table 2 shows t h a t this method was consistently better than most of the others for predicting both response to added P , and also the amount of P in the unmanured crops, but it was much less successful in predicting yields of grass and potatoes grown with-out P fertilizer. The other extractants that were generally useful were HC1, H2SO4 and HAc-NaAc buffer solution. The H3Ci, HAc and CaCl2 methods were generally poor, but the CaCl2 method was best for predicting unmanured yields of potatoes in both series.
The relationships between analytical values for soluble P by the seven methods, used singly and together, and the crop data were also examined by partial regression analyses. The results showed t h a t when one of the better methods of extraction was used, no more useful information was obtained by using a second method as well; details are not given here.
RELATIONSHIPS B E T W E E N D I F F E R E N T METHODS OF MEASURING SOIL
PHOSPHORUS
I n the whole series of 179 soils the ranges of values for p H (in water), total P and soluble P were:
PH Total P P soluble in
HC1
H2S O4 H3Ci HAc HAc-NaAc NaHCO3 CaCl,
4-4-8-2
22-270 mg.P/100 g. of soil
0-04- 7 0-8 -13 10 -42 0-1 -29 0-1 - 1 0-4 - 5 0-1 -llfiMP/1.
mg. P/100 mg. soil
Values for P soluble in NaHCO3 solution were most consistently related to crop performance.
278 R. J. B. WILLIAMS AND G. W. COOKE
CALCAREOUS SOILS ™efs)' .H5J ^ b l e * , ™ aJf°n rQlafd *?
NaAc soluble P (r = 0-73* and 0-90** in the grass In the swede and grass experiments 16 of the soils and potato experiments respectively),
contained more than 1 % CaCO3. There were only
eight centres on each crop and soluble P by any m m G S O L U B L E g 0 I L P H 0S P H A T E VALUES methodwasnotsjgnificantlyrelatedtotheresponses F Q R A ^ g - r ^ 0 N F E R TI L I Z I N G of the crops to superphosphate. There were two
consistent relationships between analytical values Measurements of soluble P in soils are used in obtained by different methods: H2SO4 soluble P advising on fertilizing, to adjust average recom-and HC1 soluble P were closely related (r = 0-91** mendations to the needs of crops on individual in grass experiments and 0-87** in potato experi- fields; less than average fertilizer is recommended
Table 2. Correlations between values for soluble soil phosphorus and crop performance
(Methods are ranked for degree of correlation, 1 = highest, and marked * for significance (P = 005 or less) of the appropriate coefficient.)
Experimental series
No. of centres...
Grass
40
Potatoes I
(West)
49
Correlations with increases in yield ct
Total P P soluble in
HC1 HaSO4
H3Ci
HAc HAc-NaAe NaHCO3 CaCla 5 3* 2* 6 8 4 1* 7 Correlations Total P
P soluble in HC1 H2SO4
H3Ci
HAc HAc-NaAc NaHCC-a CaCl2 8 2 3 6 1 5 7 4 Correlations with Total P
P soluble in HC1 H2SO4
H3Ci
HAc HAc-NaAc NaHCOa CaCl2 8 1* 2* 7 6 3* 4* 5 3 7 4 5 6 1* 2 8 Potatoes II (East) 24 uased by added
8 7 5 6 4 3 1 2 Swedes I (West) 40 L phosphate 5* 1* 2* 8 7 3* 4* 6*
with yields without added phosphate
6 5 4 8 3 2 7 1*
P in crops grown '
— — — — 6 5 2 7 4 3 8 1 without added — — — — 4* 2* 1* 8 7 3* 5* 6 phosphate 4* 1* 3* 8 7 5* 2* 6* Swedes II (East) 31 4 1* 3 7 5 6 2* 8 8 6 3* 2* 4 5 1* 7 8 5* 3* 4* 2* 6 1* 7
Table 3. Relationships between values for soluble P in soils measured by several methods (Numbers of significant correlations out of five possible.)
P soluble in
H.SO, H,Ci HAc HAc-NaAc NaHCO, CaCl,
1
1 3 — — 4 2 3 —
1 2 1 3
0 0 1 4
P soluble in HC1 H2SO4
H3Ci
279
on the richer soils and more than average on poor land. Soil analysis used in this way can improve fertilizer efficiency, but Boyd (1961) found that few farmers use soil analyses to adjust their manuring. Most farmers lack confidence in soil analysis for purposes other than liming. This may be partly because unsuitable chemical methods of determining soluble P and K are sometimes used, and, in some areas, there have been too few field experiments testing fertilizers to 'calibrate' the analyses. But probably the main reason is the lack of a generally accepted numerical definition of ' deficiency' in soil P (or K). Interpreting soil analysis is complicated because some crops thrive at levels of soil P in-adequate for others, and because responses to fertilizers depend on season, on the health of crops, and on physical properties of soil. Perhaps because of these difficulties, no published work has defined the levels of soil P above which any given crop is unlikely to respond to fertilizer; but this must be done if advice on fertilizing is to be based on soil analyses. Acceptance of pH in planning liming, and non-acceptance of P and K soil analyses in planning fertilizing, may be because pH 7 (or a lower agreed figure) serves as a ' limiting value' to show whether soil contains enough calcium. As there is no obvious value, like the middle point of the pH scale, in setting ' limiting values' for soluble P, the applica-tion of soil analysis is hindered.
Most advisers try to use soil analyses by setting a limit for soluble P arbitrarily and recommending heavy fertilizer dressings on soils well below the limit, moderate dressings for soils around the limit, and either light dressings or none at all for those well above. If the limit is placed too low, many spectacular responses -will demonstrate the value of soil analysis, but the remaining fields above the limit will include many where moderate, but profi-table, responses to fertilizer would have been obtained. If the limit is set too high much fertilizer may be wasted. The occasional soils with 'high' values for soluble P, where P fertilizers nevertheless increase yields profitably, may not be eliminated by using better analytical methods because ferti-lizers sometimes increase crops on 'rich' soils when attack by a pest or disease, or adverse weather or physical conditions of soil, are overcome by a high concentration of nutrients near to the roots of seedlings or young plants. Because a few anomalous experiments of this kind usually exist in any set of field experiments, tables relating average responses to fertilizers with average values for soluble P (such as Table 1) cannot be used to set limits for classifying ' deficient' soils. Any method of using soil analyses to advise on P-manuring should have a 'built-in' statement of the degree of confidence associated with limiting values. If the limit is taken as the highest analytical figure where a significant, or alternatively
a profitable, response to fertilizer has ever been recorded, farmers will be protected from wrong advice on the basis of existing information; but this limit will usually be so high that fertilizer would be advised on very many fields where the crops would not benefit. The loss caused by heavy manuring of many unresponsive crops may be lessened by setting a limit which rej ects a proportion of the experiments where crops responded to fertilizer, soils with the highest soluble-P being rejected first. The pro-portion of soils to be rejected when setting limits in this way depends on the degree of risk that farmers are willing to take in accepting advice based on the limiting value chosen. Risk of serious loss is lessened when 'optimum' fertilizer dressings are advised on all 'deficient' soils and a small dressing is given to crops on 'non-deficient' soils to insure against advice being wrong by preventing failures on the few anomalous soils.
This method of setting limiting values is illustrated in a simple way in Table 4 which shows, for four methods of analysis and each crop, the highest values at which significant (P = 0-05) responses to superphosphate were recorded; it also gives the highest values after discarding first one in twenty, and then one in ten, of the experiments; (sites with the highest values for soluble P were rejected in turn from each set of data). This series of experiments was not suitable for setting 'limits' for general advisory work, because the soils did not represent a normal range of phosphate levels; Table 4 is intended only to illustrate a new way of using soil analyses in advisory work. Satisfactory limits could be established if the results of all existing field experiments and related analyses were pooled, the 'best' analytical method selected, and a correct
Table 4. Selecting limiting valicesfor soluble P
to define deficient soils
(The values listed in each group are the highest for sites where crops responded significantly (P = 0-05) to superphosphate. There were 21 grass experiments, 46 on potatoes and 57 on swedes.)
Soluble P (mg.P/100 g. of soil) extracted by
HC1 H3Ci HAc-NaAc NaHC03 Highest values over all centres
Grass 2-5 24 0-7 2-1 Potatoes 6-6 34 0-8 3-1 Swedes 5-6 36 0-8 5-3 Highest values after discarding one-twentieth of centres Grass 1-9 8 0-4 1-9 Potatoes 5-0 12 0-8 2-8 Swedes 4-3 25 0-6 4-4
280
R. J. B. WILLIAMS AND G. W. COOKE statistical process used to establish the limitingvalues for soil P that define 'deficiency' for each crop. The confidence limits associated with the values should be stated so that farmers know the degree of risk they run in accepting advice. If this can be done farmers will become more confident that soil analysis is a useful advisory tool.
SUMMARY
Soil samples from 179 field experiments testing phosphate fertilizers on potatoes, swedes and grass were analysed for total phosphorus, and for phos-phorus soluble in the following solutions:
0-3N-HC1, 0 ' 0 0 2 N - H2S O4, 1% citric acid (H3Ci), 0-5N
acetic acid (HAc), acetic acid-sodium acetate buffer (HAc-NaAc) at pH4-8, 0-5M-NaHCO3, and 0-01 M
CaCla.
Average values for soluble P were closely related to average crop responses to superphosphate in the experiments on swedes, but not in the grass and potato experiments. The extractants that dif-ferentiated best between responsive and unrespon-sive groups of experiments were HAc, HAc-NaAc, and NaHC03 for potatoes, and HC1, H2SO4,
HAc-NaAc, NaHCO3 and CaCl2 for grass.
For the experiments as a whole 0-5M-NaHCO3
was the 'best' extractant. The HC1, H2SO4, and
HAc-NaAc buffer solution methods were roughly equally effective, though inferior to NaHC03; the
other three extractants (HAc, H3Ci, CaCl2) were of
little general use. Total P in soil was also related to response to superphosphate, though less well than values for soluble P obtained by the better methods. Estimates of soluble P by different solvents were often related. Estimates by HC1 and H2SO4 methods
were most closely related; values for P soluble in H2SO4 and in HAc-NaAc were also often
signi-ficantly correlated, as were estimates by HAc-NaAc and CaCl2. The H3Ci and CaCl2 methods gave results
that were least related to those with other methods.
The use of soil analyses in advising on P-manuring is discussed and a tentative method is proposed of establishing the analytical limits for soluble P that define 'deficient' soils. If the confidence attached to the limiting values that separate ' deficient' and 'non-deficient' soils is stated, farmers will be able to assess the risk entailed in accepting advice based on soil analysis.
We thank J. H. A. Dunwoody for the statistical correlations of soil analyses and crop yields on which this paper is based.
REFERENCES
BOYD, D. A. (1961). Proc. Fertil. Soc. no. 65. COOKE, G. W. (1956). J.,Agric. Sei. 48, 74.
COOKE, G. W. & WIDDOWSON, F. V. (1959). J. Agric. Sci. 53, 46.
DYER, B. (1894). J. Chem. Soc. 65, 115. HANSON, W. C. (1950). J. Sci. Fd Agric. I, 172. METSON, A. J. (1956). Methods of Chemical Analysis
for Soil Survey Samples. Soil Bur. Bull. N.Z. no. 12. MORGAN, M. F. (1937). Bull. Conn. Agric. Exp. Sta.
no. 392.
OLSEN, S. R., COLE, C. V., WATANABE, F. S. & DEAN, L. A. (1954). Circ. U.S. Dep. Agric. no. 939.
SOHOFIELD, R. K. (1955). Soils & Pert. 18, 373.
TINSLEY, J. & PIZER, N. H. (1946). J. Soc. Chem. Ind., Lond. (Trans.), 65, 208.
TRUOO, E. & MEYER, A. H. (1929). Industr. Engng
Chem. (Anal.), 1, 136.
TBUOO, E. (1930). J. Amer. Soc. Agron. 22, 874.
WARREN, R. G. & COOKE, G. W. (1962). J. Agric. Sci.
(in the Press).
WILLIAMS, E. G. & STEWART, A. B. (1941). J. Soc.