http://www.sciencepublishinggroup.com/j/ajtas doi: 10.11648/j.ajtas.20170602.17
ISSN: 2326-8999 (Print); ISSN: 2326-9006 (Online)
On Bootstrap Confidence Intervals Associated with
Nonparametric Regression Estimators for A Finite
Population Total
Nicholas Makumi, Romanus Odhiambo, George Otieno Orwa, Stellamaris Adhiambo
Department of Statistics and Actuarial Sciences, College of Pure and Applied Sciences, Jomo Kenyatta University of Agriculture and Technology, Nairobi, Kenya
Email address:
[email protected] (N. Makumi)
To cite this article:
Nicholas Makumi, Romanus Odhiambo, George Otieno Orwa, Stellamaris Adhiambo. On Bootstrap Confidence Intervals Associated with Nonparametric Regression Estimators for A Finite Population Total. American Journal of Theoretical and Applied Statistics.
Vol. 6, No. 2, 2017, pp. 117-122. doi: 10.11648/j.ajtas.20170602.17
Received: February 17, 2017; Accepted: March 1, 2017; Published: March 21, 2017
Abstract:
The precision of an estimator is at times discussed regarding the variance. Usually, the exact value of the variance is unknown. The discussion relies on unknown populace quantities. When a researcher obtains the survey data, an estimate of the variance can, therefore, be calculated. When survey results are presented, it is good practice to provide variance estimates for the estimator used in the study. The estimator of the variance can further be used to construct confidence interval, assuming that the sampling distribution of estimator is approximately normal. This study proposes estimation of standard error and confidence interval for a nonparametric regression estimator for a finite population using bootstrapping method. The idea behind bootstrapping is to carry out computations on the collected data. Computation activity assists in estimating the disparity of statistics that are themselves computed from the same data. The variance of the Nadaraya-Watson estimator is derived, based on bootstrap procedure. This operation has led to the derivation of confidence interval associated with Nadaraya-Watson estimator of the population total. A simulation study has been carried out. The overall conclusion is that the confidence interval associated with Nadaraya-Watson estimator is tighter than all the other estimators (Horvitz-Thompson estimator, Local linear estimator, and Ratio estimator).Keywords:
Bootstrap, Nonparametric Regression Model, Confidence Interval, Finite Population Total1. Introduction
The theory and application of sample surveys have in many extents grown over the last 50 years. A good survey should present a measure of precision for each estimate computed from survey data collected by survey design. A commonly used measure of precision is the variance of a survey estimator. There are several methods in literature for estimating the variance of an estimator. However, researchers are faced with a challenge to choose an appropriate variance estimator.
Kish and Frankel [16] asserts that variance estimate should be computed according to the complexity of the sample design, neglecting this complexity results to a mistake. On the other hand, obtaining more exact and complicated statistics like measures of variation (variance, standard error,
mean squared error) of first order statistics becomes more sophisticated with non-linear statistics from complex surveys.
Efron [11] proposed Bootstrap method. This technique is a computer-based technique for estimating standard errors, biases, confidence interval and other measures of statistical accuracy and does not require any assumption about how your numbers are distributed.
bootstrap distribution in various ways to arrive at confidence interval.
Non-parametric regression provides a computationally intensive estimation of unknown finite population quantities. Such estimation is frequently more flexible and robust than inference tied to design-based approaches. In this case, the use of nonparametric regression for inference on finite populations will be basically within the model based approach. In this framework, the study is concerned with the estimation of confidence interval associated with a nonparametric estimator for a finite population using bootstrapping method.
1.1. Review of Nonparametric Estimation of Finite Population Total
The use of nonparametric regression for inference on finite populations is firmly within the model–based approach.
Dorfman [10], compared population total estimators constructed from the Nadaraya–Watson estimator (nonparametric regression estimator) and design–based Horvitz–Thompson estimator and he found that nonparametric regression based estimator of a finite population total is a potent rival to familiar design–based estimators. It has the quality of automaticity associated with design–based estimators, but can better reflect the structure of the data and hence yields greater efficiency. In his finding, he also discovered that this regression estimator suffered boundary bias besides bandwidth selection challenges.
F. J. Breidt and Opsomer [4] proposed a type of model– assisted nonparametric regression estimator for the finite population total, based on local polynomial smoothing under two–stage sampling. They found out that nonparametric regression with application to local polynomial regression technique did better compare to Horvitz–Thompson estimator and to a great extent it improved the Nadaraya–Watson estimator.
In their study, Zheng & Little [25], were concerned with inference about the finite population total from probability– proportional–to–size (PPS) samples. Model–based, jackknife and balanced repeated variance estimation methods for the p– spline based estimators were developed. The simulation study showed that p–spline point estimators and their jackknife standard errors lead to an inference that is superior to Horvitz–Thompson or generalized regression (GR) based inferences. This suggested technique that nonparametric model–based prediction approaches can be successfully applied in the finite population setting by avoiding strong parametric assumptions.
F. Breidt et al. [5] Estimation of finite population totals in the presence of auxiliary information was considered. A collection of estimators based on penalized spline regression (nonparametric estimator) was proposed. Simulation experiments showed that the nonparametric estimators are effective than parametric regression estimators when the parametric model is misspecified while being approximately as efficient when the parametric specification is correct.
1.2. Review of the Variance Estimation Techniques for Finite Population Total
In the study by Royall & Cumberland [19], based on estimating the variance for setting large sample confidence interval about the best linear unbiased estimator when the model generating this estimator is inaccurate was considered. A robust variance estimator was derived, and its asymptotic properties were shown to compare favorably with those of the weighted least squares variance estimator. The robust variance estimator was shown to be asymptotically equivalent to the jackknife variance estimator under rather general conditions.
Binder [2], considered the problem of specifying and estimating the variance of estimated parameters based on complex sample designs from finite populations. The results are particularly useful when the parameter estimators cannot be defined explicitly as a function of other statistics from the sample. These results can be applied to linear regression, logistic regression, and log-linear contingency table models.
The study by Särndal et al. [22] considered design-based estimation of the variance associated with commonly regression estimator of the finite populace total. The usual Taylor linearization variance estimator is an expression in the design weighted regression residuals; in many applications, the resulted expression was counterintuitive from a model based standpoint. The improved variance estimator attached another simple weight, called "g-weight," to each residual. The results showed that the new variance estimator gave valid design-based confidence intervals, was nearly unbiased under a suitably chosen regression model, and performed well for conditional inference.
1.3. Review of the Confidence Interval for Nonparametric Estimation for the Finite Population Total
With basic knowledge in simulation besides resampling, it is a forthright step to approximate the quantities of interest which lack available true sampling distribution by the corresponding quantity of the bootstrap distribution, e.g., standard error, bias, standard deviation. Concerning confidence intervals, the situation is a bit more complicated. A variety of different concepts has been proposed by Davison and Hinkley [7] and DiCiccio and Efron [9] for producing approximate confidence intervals.
close to their normal levels. Ranking done according to a highly correlated concomitant variable are proved to reduce the level of the confidence interval only minimally.
Efron [12] considered the problem of setting confidence intervals for a single parameter in a multiparameter family. The ordinary approximate intervals rely on maximum likelihood theory was thought to be misleading. Tricks based on transformations, bias correctness, and so forth, are often used to improve their accuracy. The bootstrap confidence intervals discussed in his article automatically incorporated such tricks. The new intervals incorporated the improvement over previously suggested methods, which resulted in second–order correctness in a wide range of problems. Moreover, parametric bootstrap intervals are also developed for nonparametric situations.
Zheng and Little [26] investigated penalized spline nonparametric mixed models for inference about a finite population mean from two–stage samples. Simulation studies showed that model–based estimator (nonparametric estimator) performed better over Horvitz–Thompson estimator and linear model–assisted estimators. Simulation study also showed this estimator with variance estimation methods (empirical Bayes–based variance, jackknife and repeated replication) provided a narrower confidence interval with satisfactory confidence coverage.
2. Nonparametric Regression Estimation
According to Dorfman [27], nonparametric regression model-based sampler’s technique of choice utilized when there is doubt about the simple parametric model or suitability of a linear model for the study. It supersedes the need for the use of design weights and standard design-based weights. The understanding of regression method is helpful in confronting problems in sampling situations where design weights are missing or questionable. Let n pairs of
observations be given by
, , , . . … . , , , , where
= + (1) with m(x) being a smooth function and ~ 0, . Then a simple nonparametric estimator of m(x) is the average value of the for the observations i where is in this neighborhood, that is, the Nadaraya–Watson estimator of m(x) is
= ∑ ! (2)
where the weights = " #$%&
'
∑($)*"#$%&' , and + , is the standard normal kernel.
2.1. Nonparametric Regression Estimator for Finite Population Total
The area of nonparametric regression provides a range of methods to estimating = - | for values of x within specified intervals of the sample values of , precisely for non-sample = /. Then the simple knowledge is to access nonparametric estimates for all /in U and estimate 0 by 01 = ∑/∈3 / .
This is reasonable, since we expect ∑/∈3 / ≈ ∑/∈3 /. A slightly appropriate idea, in maintaining standard model-based practice, is to concentrate on the truth that the sample y’s are known, and take
015= ∑! + ∑/! 6 / (3)
There are multiple methods in literature for performing nonparametric regression estimation. The ordinary believes of all of the techniques is that the auxiliary variable x provides some measure of closeness of points, which are utilized to estimate a weighted sum
/ = ∑ ∈7 , where /rely on the distance of (sample) to /. Perhaps the ordinary version of this is (Nadayara-Watson) kernel estimation.
It can be shown that
89- 015 = :ℎ − = ²+ ? @ A7 A5 7 A + B =C + C D + − = = ? A7 :A5 7 D A +
− = ? A5 7 A + B = (4)
For proof see Dorfman [10]. Model–based estimators ignores sampling probabilities. It also ignores stratum boundaries. Except for the selection of bandwidth, and possible transformation of the auxiliary, it is an automatic estimator.
Clearly 015 is consistent provided = → ∞, ℎ → 0, =ℎ →
∞.
2.2. Variance of Nonparametric Regression Estimator for Finite Population Total GHIJ
KLM 015 = KLMN∑∈7 + ∑/∈O / P (5)
The variance of the nonparametric estimator 015, is formulated using the variance of the predictor error. The predictor error is given by
- 5= 015− 0 = ∑∈7 + ∑/∈O / − ∑∈7 − ∑/∈O / = ∑/∈O / − ∑/∈O / (6)
Then KLM 015 is approximated using the variance of error, - 5 given by
∑ Q∈7 ∑ /∈O / R + ∑/∈O / = ∑ QS∈7 ∑ /∈O / T S ∑ /∈O / T R + ∑/∈O / (7)
Assuming that the second derivative of is bounded and continuous and =, → ∞, ℎ → 0 and =ℎ → ∞, then variance of 015 is asymptotically estimated by
KLMU7V 015 ≈WXY∑/∈O / (8)
Where A" = ? + Z AZ This implies that
KLMU7V 015/ ≈WXYQ ∑/∈O / R → 0 (9)
From equation (7) and (8) variance of nonparametric estimator 015 cannot be computed directly, in other words, this variance is formulated using the variance of predictor error. Estimation of this variance is more complicated and due to these difficulties in estimation bootstrap technique was considered in estimating this variance under the following algorithm.
2.3. Bootstrap Variance Estimation Technique
It involves drawing a series of independent samples from the sampled observations using the same sampling scheme as the one by which the initial sample was drawn from the population and calculating an estimate for each of the bootstrap samples. The following is a brief description of how the bootstrap technique works.
i. Using the sample data, construct the artificial population \∗ , assumed to mimic the real, but unknown, population \.
ii. Draw a series of independent samples, “resamples” or "bootstrap samples," from \∗by a design identical to the one by which s was drawn from \. Independence implies that each bootstrap sample must be replaced into \∗ before the next one is drawn. For each bootstrap sample, calculate an estimate ^1∗, L = 1, … … , ` in the same way as ^1 is calculated.
K1ab=c ∑cU! ^1U∗− ^1∗ (10)
Where ^1∗=c∑cU! ^1U∗
Using bootstrap algorithm discussed above variance of nonparametric estimator 015 can be estimated as follows
K1ab=c ∑cU! 01∗5U− 01∗5 (11)
Where 01∗5=c∑cU! 01∗5U
The corresponding bootstrap estimate of standard error for
015 is given by
9-deef 015 = Qc ∑cU! 01∗5U− 01∗5 R * g
(12)
2.4. Confidence Interval Estimator in Nonparametric Regression Using Bootstrap Method
Create bootstrap samples C = 1, … . . . , h by
re-sampling from the original data.
Redo nonparametric estimator in equation (3), obtaining estimates 015 for each C.
Construct confidence interval using bootstrap estimates. Let 01∗d5 be bootstrap replicates for C = 1, … … … . , h.
Define 01∗d•5 = ∑dj1(ka∗l Then
9-deef 015 = m∑ j1(k ∗l j1(k∗l• g
a
d n
* g
(13)
Therefore, the confidence interval estimator is given by
01∗d•5 ± pqr × 9-deef 015 (14)
3. Empirical Study
To further examine the statistical properties of the mentioned confidence interval estimators, a simulation study will be performed. For simplicity, we assume that the errors are independently and normally distributed with homogenous variances and the instance where a single auxiliary variable x exists, will be considered.
The following superpopulation models are examined:
/= 1 + 2 /− 0.5 + v/ (Linear)
/ = 1 + 2 /− 0.5 ² + v/ (Quadratic)
/= 1 − /+ w −200 /− 0.5 ² + v/ (Jump)
/= 2 + sin 2∅ / + v/ (Sine)
/= 1 − 2 /− 0.5 + w −200 /− 0.5 ² + v/ (Bump)
/= exp −8 / + v/ (Exponential)
we generate 2000 values of model variable x from the uniform distribution on [0,1] and 2000 values of error ϵ from N(0,1). Then we compute 2000 values of response variable y by models above. The efficiency of this estimator will be compared with estimators in design–based approach such as Horvitz–Thompson estimator, ratio estimator, local polynomial estimators, etc.
4. Results and Discussion
efficient than their parametric counterparts (i.e. Nadaraya Watson estimator estimates population totals better compared to Horvitz-Thompson, Local polynomial). The linear function is a correct specification for the ratio estimator, and therefore it performs better than the other Horvitz-Thompson, Nadaraya-Watson and local linear estimators under this model because it is correctly specified. Nonparametric regression estimator traditionally works under the assumption that the regression function is smooth. The underlying regression function of jump population makes the regression function not meet the smoothing assumptions that nonparametric estimators traditionally do. In this nonrobust setting, Horvitz-Thompson outperforms Nadaraya-Watson.
Table 1. Summary results for estimators.
Mean
functions HT NW LL Ratio
True Total Linear 2044.912 1782.273 1783.132 2045.758 2047.919 Quadratic 2377.79 2031.554 2031.677 2379.821 2380 Sine 4074.12 3304.258 3303.449 4078.456 4074.916 Bump 2310.932 1982.155 1982.904 2312.007 2313.423 Exponential 301.4708 474.3789 474.251 301.9624 303.7299 Jump 1328.18 1245.108 1244.603 1329.747 1329.434
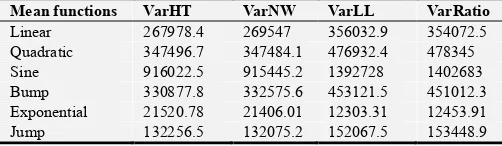
Table 2 presents variance estimates of population totals for different nonparametric estimators under different models. From Table 2, the variance for Nadaraya Watson estimator seems to be smaller across all the models and the smaller the variability, the better.
Table 2. Summary results of Bootstrap variance estimates.
Mean functions VarHT VarNW VarLL VarRatio
Linear 267978.4 269547 356032.9 354072.5
Quadratic 347496.7 347484.1 476932.4 478345
Sine 916022.5 915445.2 1392728 1402683
Bump 330877.8 332575.6 453121.5 451012.3
Exponential 21520.78 21406.01 12303.31 12453.91
Jump 132256.5 132075.2 152067.5 153448.9
The confidence intervals describe the uncertainty inherent in the estimator and describe a range of values of which we can be reasonably confident that the actual effect lies. If the confidence band is narrow, the effect size of the width easily identified.
According to research, a wider confidence width expresses a higher level of uncertainty. Besides, it indicates that researchers have a little knowledge about the effect and that further information is needed. The size of the confidence interval for a single study depends on a large extent on the sample size. Extensive researches give detailed estimates, and it contains narrower confidence length than smaller studies.
Table 3 reports a comparison of 95% confidence interval for the Nadaraya-Watson estimator, Ratio estimator, Local linear estimator and Horvitz-Thompson estimator for the different mean functions. The confidence intervals generated by Nadaraya-Watson estimator are much tighter and narrower than those generated by Horvitz-Thompson, Ratio and Local linear estimators. The results indicate that Nadaraya-Watson estimator performs better than the other estimators at 95%
coverage rate.
Table 3. Summary results of the unconditional Bootstrap confidence interval lengths.
Mean functions HT NW LL Ratio
Linear 65.17 64.37 193.48 73.76
Quadratic 73.07 72.07 85.61 85.73
Sine 118.64 99.92 118.60 146.29
Bump 71.30 70.49 84.25 83.25
Exponential 18.18 12.14 13.75 13.83
Jump 45.57 45.05 48.34 48.56
5. Conclusions and Recommendations
This study aimed at constructing bootstrap confidence intervals for the finite population total using Nadaraya-Watson estimator approach to nonparametric regression. The survey reveals that confidence intervals constructed under Nadaraya-Watson estimator has better coverage ability, tighter and a narrower width which is desired for any coverage probabilities compared to local linear, Ratio and Horvitz-Thompson estimators.
Thus, in practice, the study recommends the use of the bootstrap technique in estimating the variance and constructing confidence intervals associated with nonparametric regression estimator.
Further work can be done using Jackknife technique, and Balanced Repeated replication and random group method.
References
[1] Altman, N., & Léger, C. (1995). Bandwidth selection for kernel distribution function estimation. Journal of Statistical Planning and Inference, 46 (2), 195–214.
[2] Binder, D. A. (1983). On the variances of asymptotically normal estimators from complex surveys. International Statistical Review/Revue Internationale de Statistique, 279–292.
[3] Bowman, A. W. (1984). An alternative method of cross-validation for the smoothing of density estimates. Biometrika, 353–360.
[4] Breidt, F., Claeskens, G., & Opsomer, J. (2005). Model-assisted estimation for complex surveys using penalised splines. Biometrika, 92 (4), 831–846.
[5] Breidt, F. J., & Opsomer, J. D. (2000). Local polynomial regression estimators in survey sampling. Annals of Statistics, 1026–1053.
[6] Chambers, R. L., & Dunstan, R. (1986). Estimating distribution functions from survey data. Biometrika, 73 (3), 597–604. [7] Davison, A. C., & Hinkley, D. V. (1997). Bootstrap methods
and their application (Vol. 1). Cambridge university press. [8] Deshpande, J. V., Frey, J., & Ozturk, O. (2006).
Nonparametric ranked-set sampling confidence intervals for quantiles of a finite population. Environmental and Ecological Statistics, 13 (1), 25–40.
[10] Dorfman, A. H. (1992). Nonparametric regression for estimating totals in finite populations. In Proceedings of the section on survey research methods (pp. 622–625).
[11] Efron, B. (1979). Bootstrap methods: Another look at. [12] Efron, B. (1987). Better bootstrap confidence intervals.
Journal of the American statistical Association, 82 (397), 171– 185.
[13] Green, P. J., & Silverman, B. W. (1993). Nonparametric regression and generalized linear models: a roughness penalty approach. CRC Press.
[14] Hall, P., Sheather, S. J., Jones, M., & Marron, J. S. (1991). On optimal data-based bandwidth selection in kernel density estimation. Biometrika, 263–269.
[15] Hardle, W. (1990). Applied nonparametric regression. Cambridge, UK.
[16] Kish, L., & Frankel, M. R. (1974). Inference from complex samples. Journal of the Royal Statistical Society. Series B (Methodological), 1–37.
[17] Nadaraya, E. A. (1964). On estimating regression. Theory of Probability & Its Applications, 9 (1), 141–142.
[18] Royall, R. M. (1986). Model robust confidence intervals using maximum likelihood estimators. International Statistical Review/Revue Internationale de Statistique, 221–226. [19] Royall, R. M., & Cumberland, W. G. (1978). Variance
estimation in finite population sampling. Journal of the American Statistical Association, 73 (362), 351–358.
[20] Rudemo, M. (1982). Empirical choice of histograms and kernel density estimators. Scandinavian Journal of Statistics, 65–78.
[21] Sarda, P. (1993). Smoothing parameter selection for smooth distribution functions. Journal of Statistical Planning and Inference, 35 (1), 65–75.
[22] Särndal, C.-E., Swensson, B., & Wretman, J. H. (1989). The weighted residual technique for estimating the variance of the general regression estimator of the finite population total. Biometrika, 76 (3), 527–537.
[23] Watson, G. S. (1964). Smooth regression analysis. Sankhy-a: The Indian Journal of Statistics, Series A, 359–372.
[24] Woodroofe. (1970). Bandwidth selection: classical or plug-in? Annals of Statistics, 415-438.
[25] Zheng, H., & Little, J. (2005). Inference for the population total from probability-proportionalto-size samples based on predictions from a penalized spline nonparametric model. Journal of Official Statistics, 21 (1), 1.
[26] Zheng, H., & Little, R. (2003). Penalized spline nonparametric mixed models for inference about a finite population mean from two-stage samples.