Web Ecology 9: 77–81.
Gradient analysis is an essential tool in ecology for dem-onstrating patterns at the scales of individuals, popula-tions, communities, ecosystems, landscapes, and the globe (Whittaker 1967, Austin 1985, Körner et al. 1988, 1991, De’ath 1999, Ter Braak and Prentice 2004, Hawkins and Agrawal 2005, Crain and Bertness 2006, Johnson et al. 2006). The fundamental purpose of gradient analysis is to identify, through correlation, important abiotic fac-tors (e.g. precipitation and air temperature) that appear to drive the geographical patterns of ecological processes and biotic distributions (Whittaker 1967, Ter Braak and Pren-tice 2004). In the field, natural environmental gradients studied by ecologists are complex combinations of mul-tiple factors. There have been warnings about analyzing
this complexity in an overly simplistic manner (Ter Braak and Prentice 2004, Hawkins and Agrawal 2005), but even so, many studies do not incorporate gradient complexity explicitly into analyses in order to understand the relative importance of different contributing factors. One of the most salient problems is that many factors along gradients co-vary, and by failing to analyze the relative importance of different co-varying factors, the importance of single fac-tors can be overemphasized. Here, we review the literature to identify the potential scope of this problem, reanalyze a data set from the recent literature, present an example from the literature of how appropriate reanalysis can lead to a different conclusion, and present a brief analysis of our own data with both single- and multiple-factor analyses
The potential for misleading correlations in single-factor
analysis of complex gradients
Wei-Ming He and Ragan M. Callaway
He, W.-M. and Callaway, R. M. 2009. The potential for misleading correlations in single-factor analysis of complex gradients. – Web Ecol. 9: 77–81.
Gradient analysis is an important tool for describing patterns in ecology. Natural environmental gradients are complex combinations of factors, suggesting that gradi-ents should, when possible, be analyzed in multi-factorial ways. We searched papers published in Ecology, Global Change Biology, Journal of Ecology, Oecologia, Oikos, and Journal of Vegetation Sciencefrom January 2001 to December 2005, and found 133 papers matching two keywords: ‘gradient analysis’ and ‘environmental gradient’. Of these, 86 utilized single-factor correlation analyses between ecological entities and natural environmental gradients. Thus the use of single-factor correlations in studies of natural environmental gradients is widespread despite the potential of this approach to overemphasize the importance of the particular factor chosen. We reanalyzed a data set from the literature, provided a example of contrasting analyses, and analyzed our own data with both and multiple-factor analyses to demonstrate how single-factor correlation can result in correlations that provide incomplete analysis. Integrated multi-factor approaches to studying natural environmental gradients cannot solve all analytical problems when two or more important variables are correlated, but are likely to better test the relative importance of factors driving ecological patterns.
to demonstrate the importance of appropriate analytic ap-proaches of gradients.
Literature analysis
We examined papers that had been published in Ecology, Global Change Biology, Journal of Ecology, Oecologia, Oikos, and Journal of Vegetation Science from January 2001 through December 2005. We searched each of these six journals independently. Three steps were taken in our search. First, we identified all papers using the keyword of ‘gradient analysis’. Second, we reduced the search scope by requiring two keywords: ‘gradient analysis’ and ‘environ-mental gradient’. Finally, we determined the number of papers which utilized single-factor correlations, but were designed to better utilize multiple-factor analyses. The first search located 718 papers, but these included very high numbers of studies that utilized artificial gradients, defined as any single-factor gradients under artificially controlled conditions. For example, experimental moisture gradients in growth chambers are not complex gradients and there-fore not relevant to our goals here. The final search, using two sets of key words, yielded 133 studies that had been conducted on natural environmental gradients (e.g. eleva-tion, precipitation or air temperature).
Of the 133 papers we located, 86 utilized simple, sin-gle-factor correlation analyses between ecological entities (e.g. leaf traits, population traits, and productivity) and environmental factors (e.g. latitude, altitude, temperature, and precipitation). Specifically, these papers examined the effects of each environmental factor on particular ecologi-cal entities separately, even though these factors are known to strongly co-vary. By analyzing relationships separately and without considering co-variance among factors, the
86 studies using this approach potentially overemphasized the correlational strength of the particular factor of inter-est. Interestingly, all studies had the potential to apply multi-factorial statistical techniques to the complex pat-terns of co-variation among suites of variables, with the potential to assign a more appropriate importance to each particular variable.
Two examples from the literature
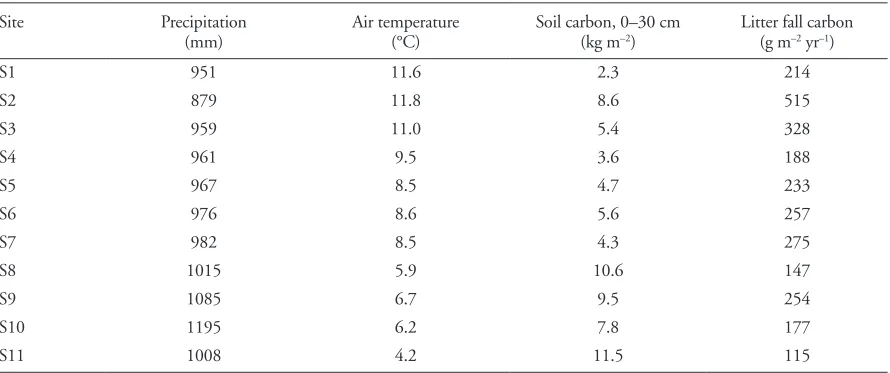
Rodeghiero and Cescatti (2005) reported a significant cor-relation between soil carbon and annual air temperature (r = –0.64, p < 0.05) and between carbon in litter fall and annual air temperature (r = 0.68, p < 0.05) using simple, single-factor correlations. Importantly, a significant corre-lation between annual precipitation and annual air tem-perature was also detected (r = –0.69, p < 0.05), indicat-ing potential problems with sindicat-ingle-factor approaches. We reanalyzed these data (Table 1) using partial correlation analysis (SPSS 13.0) and found that the correlation be-tween litter fall carbon and annual air temperature was no longer significant when annual precipitation was control-led statistically (partial correlation coefficient, rp = 0.560, p = 0.092), but that the significant correlation between soil carbon and annual air temperature remained, even when annual precipitation was controlled for statistically. In oth-er words, the effect of annual precipitation on soil carbon was relatively minor (r = 0.34, p > 0.05), and therefore the correlation between soil carbon and annual air tem-perature was not substantially changed by incorporating precipitation into the analysis. In contrast, the effect of an-nual precipitation on litter fall carbon was not statistically significant but strong (r = –0.54, p > 0.05), and therefore, the correlation between carbon in litter fall and annual air
Table 1. Summary of precipitation, air temperature, soil carbon and litter fall carbon of 11 sampling sites. Original data from Rodeghi-ero and Cescatti (2005).
Site Precipitation
(mm) Air temperature(°C) Soil carbon, 0–30 cm(kg m–2)
Litter fall carbon (g m–2 yr–1)
S1 951 11.6 2.3 214
S2 879 11.8 8.6 515
S3 959 11.0 5.4 328
S4 961 9.5 3.6 188
S5 967 8.5 4.7 233
S6 976 8.6 5.6 257
S7 982 8.5 4.3 275
S8 1015 5.9 10.6 147
S9 1085 6.7 9.5 254
S10 1195 6.2 7.8 177
temperature was completely altered by including precipi-tation. In no way do we mean to single out this study as a singular problem. Such analytical problems appear to be widespread and Rodeghiero and Cescatti (2005) actually provided their data to facilitate recalculation and discus-sion of results, which is good science and quite unusual in the literature we examined. However, this study simply provides a clear example of the problems that can develop when co-varying factors are not analyzed together.
In another example from the literature, Körner et al. (1988, 1991) used single-factor correlations and found that 1) 13C discrimination declines with altitude, irrespec-tive of plant life form, taxonomic group or climatic condi-tions and 2) altitudinal differences in 13C discrimination vary with different latitudes. However, Kelly and Wood-ward (1995) reanalyzed their data sets using evolutionary comparative techniques and found that: 1) plant life-form was significantly correlated with δ13C when altitude was not controlled for statistically, but life form had no effect on 13C discrimination when 13C was compared among life-forms within an altitude category; and 2) latitude did not affect foliar δ13C. The disparity between the conclusions of Körner et al. and Kelly and Woodward derives solely from different analytical approaches. As Marshall and Zhang (1994) pointed out; associating variation in discrimina-tion with altitude may seem somewhat arbitrary, given that altitude, latitude, and longitude were inter-correlated among the sampled plots. This example is particularly important because altitude is a commonly analyzed gradi-ent in ecology. Altitude and latitude are obviously indirect environmental gradients and many inter-related climatic
(e.g. atmospheric pressure, temperature, precipitation) and edaphic factors (e.g. soil depth, nutrient status, water-holding capacity) vary with altitude and latitude. There-fore, differences in foliar δ13C among sampled plots should have been analyzed using altitude, latitude and longitude in a multi-factorial approach (Warren et al. 2001).
An example from the Tibetan Plateau
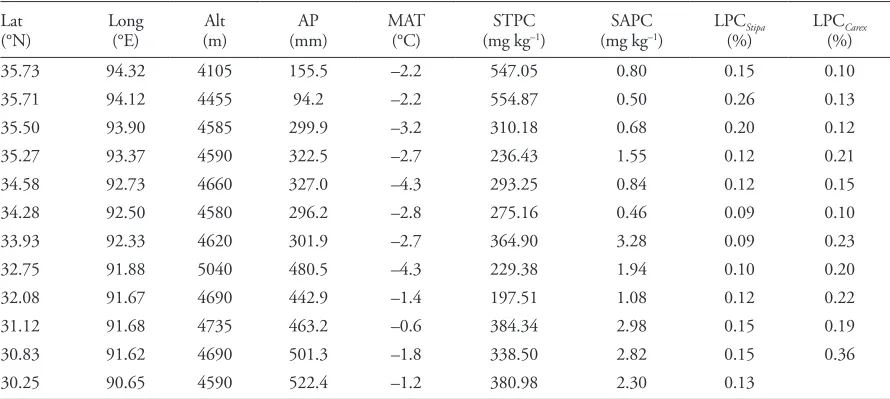
The altitudinal gradients on the Tibetan Plateau are ex-tensive (Sun and Zheng 1998). To explore patterns of leaf phosphorus (P) concentration, and the environmental fac-tors with which leaf P was correlated, we collected soil and leaf samples, as well as meteorological data along a 600-km transect on the Tibetan Plateau. Details about this transect are presented in Table 2. When we analyzed these data with single-factor correlation analysis, leaf P concentration of Stipa purpurea (LPCStipa) was significantly correlated with
soil total P (r = 0.625, p = 0.030). However, this signifi-cant correlation disappeared when either precipitation (rp = 0.474, p = 0.141) or both precipitation and temperature (rp = 0.344, p = 0.331) were added to the analysis. Crucial-ly, this occurred despite the fact that neither precipitation nor temperature had significant effects on LPCStipa in the
analysis (Table 3). In another analysis, Leaf P concentra-tion of Carex moorcroftii (LPCCarex) was significantly
corre-lated with available P (r = 0.739, p = 0.009) in the soil and precipitation (r = 0.687, p = 0.019) using single-factor cor-relations; but there was no significant correlation between LPCCarex and soil available P when either precipitation (rp
Table 2. Location (i.e. latitude (Lat), longitude (Long) and altitude (Alt)) of the sampling sites and their annual precipitation (AP), mean annual temperature (MAT), soil total phosphorus concentration (STPC), and soil available phosphorus concentration (SAPC), as well as leaf phosphorus concentration of Stipa purpurea (LPCStipa) and leaf phosphorus concentration of Carex moorcroftii (LPC-Carex).
Lat
(°N) Long(°E) (m)Alt (mm)AP MAT(°C) (mg kgSTPC–1)
SAPC (mg kg–1)
LPCStipa
(%) LPC(%)Carex
35.73 94.32 4105 155.5 –2.2 547.05 0.80 0.15 0.10
35.71 94.12 4455 94.2 –2.2 554.87 0.50 0.26 0.13
35.50 93.90 4585 299.9 –3.2 310.18 0.68 0.20 0.12
35.27 93.37 4590 322.5 –2.7 236.43 1.55 0.12 0.21
34.58 92.73 4660 327.0 –4.3 293.25 0.84 0.12 0.15
34.28 92.50 4580 296.2 –2.8 275.16 0.46 0.09 0.10
33.93 92.33 4620 301.9 –2.7 364.90 3.28 0.09 0.23
32.75 91.88 5040 480.5 –4.3 229.38 1.94 0.10 0.20
32.08 91.67 4690 442.9 –1.4 197.51 1.08 0.12 0.22
31.12 91.68 4735 463.2 –0.6 384.34 2.98 0.15 0.19
30.83 91.62 4690 501.3 –1.8 338.50 2.82 0.15 0.36
= 0.571, p = 0.085) or both precipitation and temperature (rp = 0.531, p = 0.141) were analyzed simultaneously in a multi-factor approach (Table 3).
Conclusions
Our literature search shows that simple, single-factor gradient analyses are widely used in ecological research even when data are available for more appropriate multi-factoral analyses. We demonstrate the problems that may occur when simple, single-factor correlations are used to explore relationships between ecological entities and complex, multi-factorial environmental gradients. Our case studies and analysis of a sample data set demonstrate the potential to overemphasize the strength of relation-ships with single-factor analyses. We suggest that simple statistical analyses should be replaced with multi-factor statistical analyses whenever possible, particularly when studying natural environmental gradients. For example, the use of step-wise regression with backward elimination of non-significant variables could have provided an alter-native interpretation of almost all data sets we found in the literature. Another approach to reduce the problems associated with single-factor analyses could be to apply principal component analysis (PCA) to complex data sets to quantify the relative contribution of co-varying envi-ronmental factors prior to step-wise regression, or even post-PCA single-factor analysis, on the variables that PCA identifies as important. However, we want to emphasize that whenever two or more variables are correlated, it is difficult to determine the proportional effects of each vari-able on the others with either single- or multi-variate ap-proaches. Step-wise regression and PCA with correlated variables and principal component analysis have different problems in terms of analysis and interpretation. However, in many cases multiple-factor analyses are more likely to provide better tests of the relative importance of factors driving ecological patterns.
Altitude is an important driver of broad-scale geo-graphical patterns, and patterns along altitudinal gradi-ents have attracted a great deal of attention (Körner et al. 1988, 1991, Kelly and Woodward 1995). When examin-ing the effects of altitude, we should consider the logical relationships among the factors that co-vary with altitude. If altitude is chosen as a driver shaping the geographical patterns of ecological entities, latitude or longitude should be statistically controlled for as much as possible. Addi-tionally, care should be taken not to extrapolate across different scales when analyzing factors like altitude and latitude together.
In sum, due to the complexity of natural environmental gradients, it is often helpful to consider multi-variate ap-proaches to data analysis. For small-scale ecological enti-ties such as plant traits, local climate has a great deal of
potential to offset altitudinal, latitudinal or longitudinal Table
3. P earson corr elation coefficient (r) and par tial corr elation coefficient (rp ) betw een leaf phosphor us (P) concentration and envir onmental factors on the ba sis of SPSS (13.0 ). LPC Stipa
= leaf P concentration of
Stipa purpur ea , LPC C ar ex
= leaf P concentration of
C ar ex moor cr oftii , P
r = pr
ecipitation, and
T = temperatur
e.
LPC
Stipa
vs total P
LPC Stipa vs P r LPC Stipa vs T LPC Stipa
vs total P
when
T was contr
olled
LPC
Stipa
vs total P
when P r was contr olled LPC Stipa
vs total P
when P r and T w er e contr olled
r = 0.625, p = 0.030
r =–0.489, p = 0.107
r = 0.203, p = 0.527
rp
= 0.604, p = 0.049
rp
= 0.474, p = 0.141
rp
= 0.344, p = 0.331
LPC C ar ex vs av ailable P LPC C ar ex vs P r LPC C ar ex vs T LPC C ar ex vs av ailable P when
T was contr
olled LPC C ar ex vs av ailable P when P r was contr olled LPC C ar ex vs av ailable P when P r and T w er e contr olled
r = 0.739, p = 0.009
r = 0.687, p = 0.019
r = 0.258, p = 0.443
rp
= 0.717, p = 0.020
rp
= 0.571, p = 0.085
rp
effects; thus including variables that represent local climate in multi-variate analyses may allow a more accurate analy-sis of the relative importance of several factors. Large-scale entities such ecosystem productivity usually correspond to single fundamental drivers, but drivers that can be hard to separate from others. In this case, multi-factor analy-ses may help to identify the driving factor. At either scale, ecologists may benefit from using analytic approaches that deal with such complex gradients.
Acknowledgements – We thank Dr Pei-Li Shi at Chinese Academy
of Sciences for his help. This study was funded by the grants from National Natural Science Foundation of China (30770335 and 30870395).
References
Austin, M. P. 1985. Continuum concept, ordination methods and niche theory. – Annu. Rev. Ecol. Syst. 16: 39–61. Crain, C. M. and Bertness, M. D. 2006. Ecosystem engineering
across environmental gradients: implications for conserva-tion and management. – BioScience 56: 211–218. De’ath, G. 1999. Principal curves: a new technique for indirect
and direct gradient analysis. – Ecology 80: 2237–2253. Hawkins, B. A. and Agrawal, A. A. 2005. Latitudinal gradients.
– Ecology 86: 2261–2262.
Johnson, Z. I. et al. 2006. Niche partitioning among prochloro-coccus ecotypes along ocean-scale environmental gradients. – Science 311: 1737–1740.
Kelly, C. K. and Woodward, F. I. 1995. Ecological correlates with carbon isotope composition of leaves: a comparative analysis testing for the effects of temperature, CO2 and O2 partial pressure and taxonomic relatedness on δ13C. – J. Ecol. 83: 509–515.
Körner, C. et al. 1988. A global survey of carbon isotope dis-crimination plants from altitude. – Oecologia 74: 623–632. Körner, C. et al. 1991. Carbon isotope discrimination by plants follows latitudinal and altitudinal trends. – Oecologia 88: 30–40.
Marshall, J. D. and Zhang, J. 1994. Carbon isotope discrimina-tion and water-use efficiency in native plants of the north– central Rockies. – Ecology 75: 1887–1895.
Rodeghiero, M. and Cescatti, A. 2005. Main determinants of for-est soil respiration along an elevation/temperature gradient in the Italian Alps. – Global Change Biol. 11: 1024–1041. Sun, H. and Zheng, D. 1998. Formation and development of
Qing-Zang Plateau. – Guangdong Sci. Technol. Press, pp. 1–28.
Ter Braak, C. J. F. and Prentice, I. C. 2004. A theory of gradient analysis. – Adv. Ecol. Res. 34: 236–282.
Warren, C. R. et al. 2001. Water availability and carbon isotope discrimination in conifers. – Oecologia 127: 476–486. Whittaker, R. H. 1967. Gradient analysis of vegetation. – Biol.