Ames Laboratory Accepted Manuscripts
Ames Laboratory
8-19-2016
Self-Assembly of DNA Functionalized Gold
Nanoparticles at the Liquid-Vapor Interface
Honghu Zhang
Iowa State University and Ames Laboratory
Wenjie Wang
Ames Laboratory
, [email protected]
Noah Hagen
Ames Laboratory
Ivan Kuzmenko
Argonne National Laboratory
Mufit Akinc
Iowa State University and Ames Laboratory
, [email protected]
See next page for additional authors
Follow this and additional works at:
http://lib.dr.iastate.edu/ameslab_manuscripts
Part of the
Materials Science and Engineering Commons
, and the
Nanoscience and
Nanotechnology Commons
This Article is brought to you for free and open access by the Ames Laboratory at Iowa State University Digital Repository. It has been accepted for inclusion in Ames Laboratory Accepted Manuscripts by an authorized administrator of Iowa State University Digital Repository. For more information, please [email protected].
Recommended Citation
Zhang, Honghu; Wang, Wenjie; Hagen, Noah; Kuzmenko, Ivan; Akinc, Mufit; Travesset, Alex; Mallapragada, Surya K.; and Vaknin, David, "Self-Assembly of DNA Functionalized Gold Nanoparticles at the Liquid-Vapor Interface" (2016).Ames Laboratory Accepted Manuscripts. 72.
Self-Assembly of DNA Functionalized Gold Nanoparticles at the
Liquid-Vapor Interface
Abstract
Surface sensitive synchrotron X-ray scattering and spectroscopy are used to monitor and characterize the
spontaneous formation of 2D Gibbs monolayers of thiolated single-stranded DNA-functionalized gold
nanoparticles (ssDNA-AuNPs) at the vapor–solution interface by manipulating salt concentrations. Grazing
incidence small-angle X-ray scattering and X-ray reflectivity show that the noncomplementary ssDNA-AuNPs
dispersed in aqueous solution spontaneously accumulate at the vapor–liquid interface in the form of a single
layer by increasing MgCl2 or CaCl2 concentrations. Furthermore, the monoparticle layer undergoes a
transformation from short- to long-range (hexagonal) order above a threshold salt-concentration. Using
various salts at similar ionic strength to those of MgCl2 or CaCl2 such as, NaCl or LaCl3, it is found that
surface adsorbed NPs lack any order. X-ray fluorescence near total reflection of the same samples provides
direct evidence of interfacial gold and more importantly a significant surface enrichment of the cations.
Quantitative analysis reveals that divalent cations screen the charge of ssDNA, and that the hydrophobic
hexyl-thiol group, commonly used to functionalize the ssDNA (for capping the AuNPs), is likely the driving
force for the accumulation of the NPs at the interface.
Disciplines
Materials Science and Engineering | Nanoscience and Nanotechnology
Authors
Honghu Zhang, Wenjie Wang, Noah Hagen, Ivan Kuzmenko, Mufit Akinc, Alex Travesset, Surya K.
Mallapragada, and David Vaknin
Self-Assembly of DNA Functionalized Gold Nanoparticles
at the Liquid-Vapor Interface
Honghu Zhang , Wenjie Wang , Noah Hagen , Ivan Kuzmenko , Mufi t Akinc ,
Alex Travesset , Surya Mallapragada , and David Vaknin *
H. Zhang, Prof. M. Akinc
Ames Laboratory and Department of Materials Science and Engineering
Iowa State University Ames , IA 50011 , USA Dr. W. Wang, N. Hagen Ames Laboratory Ames , IA 50011 , USA Dr. I. Kuzmenko Advanced Photon Source Argonne National Laboratory Argonne , IL 60439 , USA Prof. A. Travesset, Dr. D. Vaknin
Ames Laboratory and Department of Physics and Astronomy Iowa State University
Ames , IA 50011 , USA E-mail: [email protected] Prof. S. Mallapragada
Ames Laboratory and Department of Chemical and Biological Engineering
Iowa State University Ames , IA 50011 , USA
them into hierarchal functional structures remains a challenge. [ 1–9 ] Naturally, the
primary route to overcome this challenge has been to explore conditions that allow controlled self-assembly either by manipu-lating the medium in which the NPs are embedded in and/or by functionalizing them with “smart programmable mol-ecules” (complementary single-stranded DNA, for instance). [ 1–9 ] Specifi
cally-organ-ized 2D and 3D NPs have been highly desirable to theoretical engineers who conceive metamaterials with novel pho-tonic, electronic, and magnetic proper-ties where the NPs play similar roles to those of atoms in functional materials such as, insulators, semiconductors, or metals. [ 8,10–18 ] Major advances have been
made in the last decade in laying out engineering rules for crystallization of 3D [ 1,2,4,6,19–25 ] and 2D [ 5,26–30 ] superlattices;
however, the stability, scale of production, and specifi c organization are hurdles that need to be overcome to render these assemblies technological viability. These shortcomings can in part be affected by refo-cusing the exploration to fundamental understanding of molec-ular length scale mechanisms involved in self-assembly. The 2D self-assembly into long- or short-range order to a certain extent lessens the complexity inherent in 3D systems providing a suit-able playground to unraveling the underlying interactions that can in turn be employed to the assembly process in 1D, 2D and 3D structures. Indeed, it has been demonstrated that single-stranded DNA-functionalized AuNPs (ssDNA-AuNPs) can form so-called Gibbs layers by controlling salt concentrations and even spontaneously crystallize as 2D hexagonal structures at the vapor/solution surfaces. [ 27,28 ] However, the mechanism
by which these complexed AuNPs (or any other DNA-complexed NPs) migrate to the vapor/aqueous interface, or the forces that lead to crystallization have not been fully addressed yet. We have undertaken this synchrotron X-ray study to answer these questions and to determine the interactions that lead to the spontaneous accumulation and crystallization of ssDNA-AuNPs by manipulating salt concentrations. More details on the preparation of the materials, their characterization, and the methods we use are provided in the Experimental Section below and in the Supporting Information online. Whereas Campo-longo and co-workers use parallel small-angle X-ray scattering (parSAXS) from a drop-vapor interface [ 27,28 ] (1.5 µL droplet)
Surface sensitive synchrotron X-ray scattering and spectroscopy are used to monitor and characterize the spontaneous formation of 2D Gibbs monolayers of thiolated single-stranded DNA-functionalized gold nanoparticles (ssDNA-AuNPs) at the vapor–solution interface by manipulating salt concentrations. Grazing incidence small-angle X-ray scattering and X-ray refl ectivity show that the noncomplementary ssDNA-AuNPs dispersed in aqueous solution sponta-neously accumulate at the vapor–liquid interface in the form of a single layer by increasing MgCl 2 or CaCl 2 concentrations. Furthermore, the monoparticle layer undergoes a transformation from short- to long-range (hexagonal) order above a threshold salt-concentration. Using various salts at similar ionic strength to those of MgCl 2 or CaCl 2 such as, NaCl or LaCl 3 , it is found that surface adsorbed NPs lack any order. X-ray fl uorescence near total refl ection of the same samples provides direct evidence of interfacial gold and more importantly a signifi cant surface enrichment of the cations. Quantitative analysis reveals that divalent cations screen the charge of ssDNA, and that the hydrophobic hexyl-thiol group, commonly used to functionalize the ssDNA (for capping the AuNPs), is likely the driving force for the accumulation of the NPs at the interface.
1. Introduction
which can be complicated by bulk scattering requiring spatial mapping of a solution droplet profi le, we have adopted a more direct grazing incidence SAXS (GISAXS) approach by scat-tering from a fl at solution surface (60 × 60 mm 2 ) using a
spe-cialized liquid surfaces spectrometer. Furthermore, in addition to in-plane diffraction from the surface, our experimental setup expands on previous studies by enabling us to directly measure the refl ectivity from the surface and more importantly to col-lect X-ray fl uorescence near total refl ection of specifi c emission lines from interfacial atoms [ 31 ] that allow valuable quantifi
ca-tion of surface density of the NPs and density profi le of the ions that induce the migration of the ssDNA-AuNPs to the surface.
2. Results and Discussion
2.1. 2D Hexagonal Superlattice Induced by Magnesium Ions
Figure 1 shows GISAXS patterns as functions of Q y and Q z from noncomplementary ssDNA-AuNPs in aqueous
suspension with incident beam below the critical angle (αc = 0.091 deg.) for total refl ection of evanescent wave with
fi nite penetration depth into the bulk solution, without salt (a) and with salt (b) in solution. In the presence of 50 × 10 −3 M MgCl 2 (Figure 1 b), the pattern exhibits sharp rods due to
the formation of a 2D crystalline Gibbs layer, and broad cir-cular features associated with the form factor of the AuNPs, while no such features are observed in the pattern without any salts (Figure 1 a). A linecut profi le along Q y direction at
the critical angle from the pattern in Figure 1 b is shown in
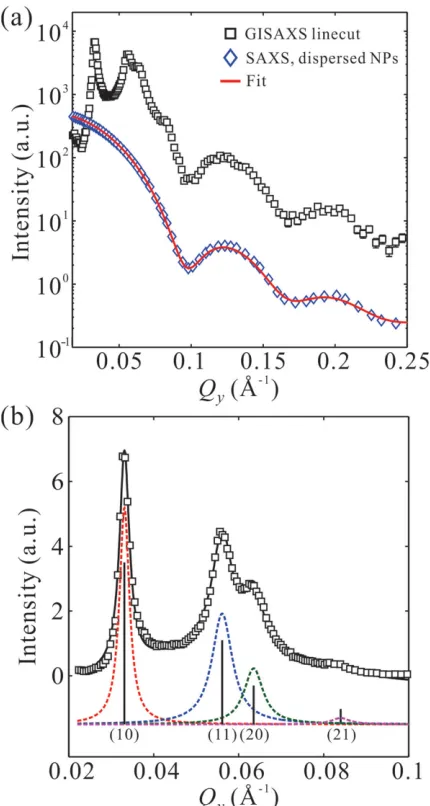
Figure 2 a along with a SAXS intensity profi le of the bare AuNPs in bulk (obtained separately on a different instru-ment). Figure 2 b shows the linecut at the low Q y range
( Q y < 0.1 Å −1 ).A fundamental diffraction peak ( Q 1 = 0.0331 Å −1 )
is followed by peaks with calculated relative positions to
Q 1 at Q i / Q 1 ≈ 1:√3: √4:√7 (i = 1−4) indicating the formation of
a 2D hexagonal crystalline structure (indexed (10), (11), (20),
and (21) refl ections) with an average interparticle distance
a = 4π/(√3 Q 1 ) = 220 Å. Based on the FWHM
(full-width-at-half-maximum) of the fi rst diffraction peak ( FWHM (10) ≈
0.0028 Å −1 ) and the superior resolution function of the
spec-trometer, we estimate the average crystalline diameter to be on the order of 2200 Å implying long-range 2D crystalline
Figure 1. GISAXS patterns as functions of Q y and Q z for aqueous solutions
of ssDNA-AuNPs a) in the absence of salts and b) in the presence of 50 × 10 −3
M MgCl 2 . Intensities are displayed on logarithmic scales.
Figure 2. a) A horizontal linecut profi le (black squares) along Q y direction
at critical angle (αf =αc = 0.091 deg.) integrated over ΔQ z = 6 × 10 −4 Å −1
in the GISAXS 2D pattern for a Gibbs monolayer of ssDNA-AuNPs mixed with 50 × 10 −3 M MgCl
2 (Figure 1 b). Aslo shown is a SAXS pattern (blue
diamonds) from bare AuNPs dispersed in aqueous solution prior to functionalization with ssDNA with a best fi t (red solid line) using a form factor of spherical particles with polydispersity described by a Gaussian distribution. Similar form factor of spherical nanoparticles is observed in the linecut profi le of the GISAXS pattern. The size distribution of AuNPs estimated by the best fi t is D = 8.9 ± 0.8 nm. b) The GISAXS linecut pro-fi le at low Q y range (0.02−0.1 Å −1 ), along with best fi t (black solid line) to
[image:4.594.315.530.69.472.2] [image:4.594.53.284.493.679.2]structure that extends to about 10 × 10 unit cells. In Figure 2 a, the broad features associated with the form factor that extends to larger Q y (≈0.25 Å −1 ) match those of the bare (uncapped)
AuNPs strongly suggesting that the electron density of the ssDNA envelop (or corona) capping the AuNPs is not signifi -cantly different than that of the solution surrounding it. This indicates that the scattering from the surface is a superposi-tion of crystalline and noncrystalline ssDNA funcsuperposi-tionalized AuNPs as demonstrated in Figure 2 a. Indeed, in the absence of MgCl 2 in solution of the same ssDNA-AuNP concentration,
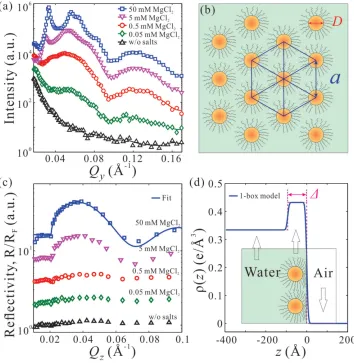
a corresponding linecut in Figure 3 a does not show evidence of form-factor features as those shown in Figure 2 a indicating that the noncomplementary ssDNA-AuNPs are well dispersed in the aqueous solution and do not populate the surface without the addition of salt. Figure 3 shows the evolution of the formation of the crystalline Gibbs monolayer as a func-tion of the MgCl 2 concentration as it is probed by the GISAXS
(Figure 3 a) and by X-ray refl ectivity (XRR) (Figure 3 c) from the same samples. Both the GISAXS and the XRR show that
gradual increase of salt concentration induces steady migra-tion of capped-AuNPs to the surface. At concentramigra-tions of
≈5 × 10 −3 M short-range order sets in and at a threshold
con-centration of ≈50 × 10 −3 M, long-range order domains are
formed, albeit with dispersed uncorrelated particles as dis-cussed above.
Analysis of the X-ray refl ectivity measurements in terms of a single layer yields [ 31,32 ] the best fi t (solid line
Figure 3 c) with average layer thickness Δ≈ 93 Å, electron den-sity ρe ≈ 0.432 e•Å −3 , and surface roughness σ≈ 6.0 Å. The layer
thickness is close to the diameter of the gold nanoparticles (89 ± 8 Å) confi rming the formation of a monoparticle layer at the vapor/liquid interface. Based on the extracted ρe , we
esti-mate the average crystalline coverage on the surface at ≈25% at the highest salt concentration (see the Supporting Informa-tion for details). Using CaCl 2 in solution, to induce the
forma-tion of ssDNA-AuNP Gibbs layer, yields practically the same behavior as that of MgCl 2 (see below and see the Supporting
Information).
Figure 3. Increase of MgCl 2 concentrations (0.05−50 × 10 −3 M ) promotes formation of a 2D long-range ordered hexagonal superlattice of
nonbase-pairing ssDNA-AuNPs (based on GISAXS) with a monoparticle thickness (based on XRR). a) GISAXS linecut profi les along Q y direction at various
MgCl 2 concentrations as indicated and b) a schematic depiction of the lateral packing of nonbase-pairing ssDNA-AuNPs at 50 × 10 −3 M MgCl 2 .
c) Normalized XRR from Gibbs monolayers of nonbase-pairing ssDNA-AuNPs at various MgCl 2 concentrations as indicated and d) the electron density
profi le across the interface obtained from the best fi t to the XRR at 50 × 10 −3 M MgCl
2 shown in (c). The inset in (d) is an illustration of the
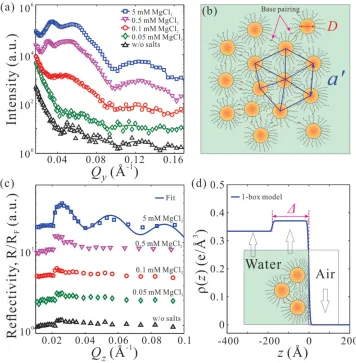
[image:5.594.122.476.71.434.2]Similar results using an equimolar mixture of two types of ssDNA-AuNPs with a complementary base-pairing region at the end of ssDNA by adjusting MgCl 2 concentrations
are shown in Figure 4. GISAXS and X-ray refl ectivity data clearly indicate salt-driven surface-enrichment of the capped-AuNPs with a threshold concentration ≈0.5 × 10 −3 M MgCl
2
needed to induce short-range in-plane order. However, even for higher salt concentrations, GISAXS and X-ray refl ectivity reveal in-plane and out-of-plane features different from those of the noncomplementary ssDNA-AuNPs monolayer. First, only short-range hexagonal order is observed in the GISAXS linecut profi le (Figure 4 a). It is worth noting that the highest tested MgCl 2 concentration is 5 × 10 −3 M as the base-paired
ssDNA-AuNPs form large visible precipitates at higher salt concentrations. At 5 × 10 −3 M MgCl
2 , the average interparticle
distance a is ≈210 Å ( Q 1 = 0.0342 Å −1 ) in a short-range
hex-agonal ordering (Figure 4 b), just slightly smaller than a ≈260 Å for nonbase-paired at 5 × 10 −3 M salt. As discussed above, we
estimate the average domain size in the short-range order
regime to be 2 × 2 unit cells as the grain size is on the order of 500 Å ( FWHM (10) ≈ 0.0120 Å −1 ). The decrease of interparticle
distance indicates interdigitation as partial base-pairing takes place among the particles. This is also verifi ed in the bulk by SAXS measurements as shown in Figure S3 in the Supporting Information. This attraction has an effect on multilayering the fi lm at the interface as is evidenced by the XRR shown in Figure 4 c. The XRR shows well-defi ned fringes (at 5 × 10 −3 M
MgCl 2 ) with a decrease in period compared to that shown in
Figure 3 c, corresponding to a thicker layer. The best fi t para-meters (solid line in Figure 4 c) are Δ≈ 180 Å, ρe ≈ 0.37 e•Å −3 ,
[image:6.594.116.472.70.433.2]and σ≈ 4.8 Å. Contrary to the monoparticle layer of noncom-plementary ssDNA-AuNPs, the electron density profi le shows that the nanoparticle fi lm is thicker and likely consists of two particle-layers (the diameter of a bare AuNP D = 89 ± 8 Å) as expected from the binding of complementary nanoparticles (Figure 4 d). The reduction in electron density of this simple model, compared to the noncomplementary system, is likely due to the fact that the second layer is incomplete.
Figure 4. Increase of MgCl 2 concentrations (0.05−5 × 10 −3 M ) promotes formation of a 2D short-range ordered superlattice of base-pairing
ssDNA-AuNPs (based on GISAXS) with a nearly two-particle thickness (based on XRR). a) GISAXS linecut profi les along Q y direction at various MgCl 2
concen-trations as indicated and b) a schematic depiction of the lateral packing of base-pairing ssDNA-AuNPs at 5 × 10 −3 M MgCl
2 . c) Normalized XRR from
Gibbs monolayers of base-pairing ssDNA-AuNPs at various MgCl 2 concentrations as indicated and d) the electron density profi le across the interface
obtained from the best fi t to the XRR at 5 × 10 −3 M MgCl
2 shown in (c). The inset in (d) is an illustration of the surface-normal structure of the 2D
FULL P
APER
2.2. Effect of Cations with Different Valences
Although the assembly of complementary ssDNA-AuNPs into 3D crystalline structures requires the presence of NaCl, [ 1,2,4,8,9,19 ]
for the 2D Gibbs monolayer of noncomplementary ssDNA-AuNPs, it has been demonstrated that MgCl 2 as well as NaCl
at various ionic strengths can also induce 2D crystallization. [ 28 ]
The use of MgCl 2 is driven by its function in biological systems,
but its role in the interfacial accumulation and crystallization of ssDNA-AuNPs still remains unknown. To better understand its role, we explore the effect of various mono and multivalent ions at same ionic strength as that of MgCl 2 concentration that
induces the crystallization of the Gibbs layer. Figure 5 shows
liquid surface GISAXS patterns of four salts (NaCl, MgCl 2 ,
CaCl 2 , LaCl 3 ) at the same level of ionic strength (≈150 × 10 −3 M ).
Whereas NaCl or LaCl 3 do not show ordered structures at the
interface (Figure 5 b,c), with CaCl 2 we fi nd that the GISAXS
patterns, and evolution of the Gibbs monolayer as a function of CaCl 2 is practically the same as those obtained by adding
MgCl 2 (see more details in Figure S2 in the Supporting
Infor-mation). We fi nd that the ssDNA-AuNP superlattices induced by both divalent salts exhibit long-range hexagonal order with a practically identical lattice parameter ( a ≈ 220 Å) and grain size (2200−2400 Å) clearly demonstrating that these two diva-lent ions play a similar role in migrating and crystallizing the capped AuNPs to the liquid interface.
The observation that the CaCl 2 induces self-assembly that
is practically identical to that of MgCl 2 allows us to further
explore the 2D Gibbs phenomena with the X-ray fl uores-cence technique near total refl ection to directly and element-specifi cally quantify the interfacial ions. This is important, in view of the fact that it is impractical to apply this technique to Mg 2+ since the emission-line signals from Mg (Kα= 1.25 keV,
Kβ = 1.07 keV) are beyond the detection limit of the Vortex EDD as it is set up in our study. The X-ray fl uorescence spectra below the critical angle αc (at Q z = 0.015−0.018 Å −1 ) with
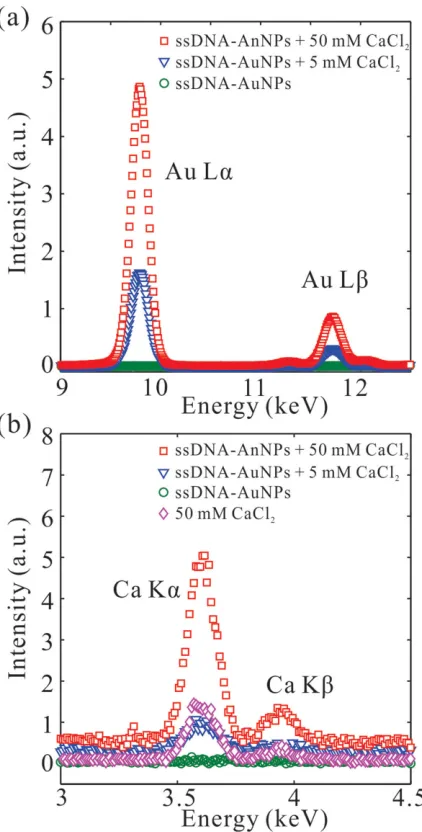
non-base-paired ssDNA-AuNPs and in the absence and presence CaCl 2 are shown in Figure 6 in the energy range of L
emis-sion lines of Au (a) and K emisemis-sion lines of Ca (b). At αi < αc ,
the evanescent X-ray wave (at Q z = 0.015−0.018 Å −1 ) penetrates
into the solution only to a very shallow depth (less than 100 Å) along the surface-normal. Figure 6 a shows the Lα and Lβ emis-sion lines from gold for ssDNA-AuNPs dispersed in 0, 5, and 50 × 10 −3 M CaCl
2 . Whereas the signal from Au is not
detect-able without CaCl 2 , it shows strong enhancement when the salt
is added, providing direct evidence of the interfacial accumula-tion of ssDNA-AuNPs within the penetraaccumula-tion depth of the X-ray beam. Meanwhile for the same samples, the corresponding calcium signals (Kα and Kβ emission lines) are also observed (Figure 6 b) with intensities of same trend as that of Au with the increase CaCl 2 concentration. This indicates that the Ca 2+
ions migrate with the ssDNA-AuNPs to the surface riding on the charged backbone of the ssDNA screening the charges of the PO 4 − groups on it. In Figure 6 b, a 50 × 10 −3 M CaCl 2
solution without any ssDNA-AuNPs (magenta diamond sym-bols) is used as a reference to calibrate the spectral intensity of calcium. We generally fi nd that the signal from bulk ions scales with the concentration, so for the 5 × 10 −3 M salt
solu-tion we expect a decrease by a factor of 10 compared to that with 50 × 10 −3 M . Notably, the calcium signal intensity from the
interface of ssDNA-AuNPs solution mixed with 5 × 10 −3 M CaCl 2
is almost comparable to that of the pure 50 × 10 −3 M CaCl 2
solu-tion (without AuNPs), suggesting an increase of the molarity at the interface to about 50 × 10 −3 M (i.e., an increase by
factor of 10). Assuming that ions are homogeneously distrib-uted in the thin illuminated layer, the surface concentration of ions can be quantifi ed by integrating the intensity over its energy range and normalizing to a reference of known concen-tration. [ 31 ] The surface concentration of calcium is estimated at
27 × 10 −3 M and 164 × 10 −3 M at the interfaces with
ssDNA-AuNPs in the presence of 5 × 10 −3 M and 50 × 10 −3 M CaCl 2 ,
respectively.
Figure 5. GISAXS patterns of nonbase-pairing ssDNA-AuNPs a) in the absence of salts, and in the presence of b) NaCl, c) LaCl 3 , d) CaCl 2 , and
e) MgCl 2 at the same ionic strength (IS ≈ 150 × 10 −3 M ). The mixture of
ssDNA-AuNPs and LaCl 3 are found to form precipitates. Intensities are
The corresponding parameters of the 2D superlattices measured by GISAXS, X-ray refl ectivity, and X-ray fl uorescence are presented in Table 1. Albeit with different parameter space (i.e., DNA sequence, particle size, salt species, and concentrations), the trends that crystallinity increases and lattice constants decrease with salt concentration are similar to a recent study. [ 28 ] Notice that
for the lower concentration (5 × 10 −3 M ) the
lattice constant is signifi cantly larger than that observed with 50 × 10 −3 M, which is
consistent with our explanation below, i.e., at this concentration the DNA is not yet fully neutral and Coulomb repulsion forces make the DNA arms extend and effectively increase the area per particle, as also evidenced in the dynamic light scattering results (see the Supporting Information). In the 2D ssDNA-AuNP superlattice layer, there are ≈0.15−0.62 Ca 2+ ions
associ-ated with each DNA base, suggesting that the divalent cations roughly balance the charge of the phosphate backbones of the DNA chains.
Although charge screening of DNA chains may lower the solubility of ssDNA-AuNPs, this by itself cannot drive the capped-NPs to the surface. To confi rm that, we have conducted control experiments (X-ray refl ectivity and fl uorescence of Ca), with pure single-stranded DNA (same sequence without thiol modifi cation as that used to functionalize the AuNPs) in solu-tion and found that the addisolu-tion of CaCl 2 to the solution (even
close to 1 M CaCl 2 ) does not drive the DNA to the surface. So,
the question is, what drives the ssDNA-AuNP-Ca complex to the surface and what is mechanism by which it crystallizes? It is worth noting that the thiol modifi cation at the end of a DNA always contains a short hydrophobic carbon chain (in our case, −(CH 2 ) 6−) in all research related to ssDNA-AuNPs
(Table S1, Supporting Information), and the cumulative effect on each ssDNA-AuNP is equivalent to 40−60 carbon chains. We argue that, by adding salt to the solution and screening charges on the DNA, the net effect is a gradual predomi-nance of hydrophobic effects. That is, the hydrophobicity of the carbon chains becomes dominant after charge screening the soluble DNA, leading to the formation of a Gibbs layer of AuNPs. Thus, the interfacial accumulation of ssDNA-AuNPs results from the hydrophilic polyelectrolyte-like proper-ties of DNA and the presence of hydrophobic carbon chains. We hypothesize that the interface becomes saturated as the hydrophobic hydrocarbon chains outbalance the affi nity of DNA to water at the threshold concentration that induces 2D crystallization. Now, we estimate the critical salt concentration at which ssDNA-AuNPs become completely insoluble. In the ssDNA-AuNPs solution, water molecules are in contact with the Au core and fully solvate the hydrocarbon chains (see details in the Supporting Information). The difference in chemical potential for transferring alkane from water to air is estimated from the surface tension of hydrocarbons γs ≈ 50 mJ•m −2 . With
a hydrocarbon van der Waals radius, r vdW , of ≈2 Å, it gives a
surface area of m -hydrocarbons A m = 2πmr vdW l CH2 when
con-sidering a carbon chain as a cylinder ( l CH2 ≈ 1.27 Å, A 6 ≈ 96 Å 2 )
Figure 6. Fluorescence signals of a) gold and b) calcium (of same sam-ples) integrated below the critical angle αc from Gibbs monolayers of
nonbase-pairing ssDNA-AuNPs at the air-liquid interface for various CaCl 2
concentrations (5 × 10 −3 M and 50 × 10 −3 M ) as indicated. A 50 × 10 −3 M
CaCl 2 solution without any ssDNA-AuNPs and an ssDNA-AuNPs solution
without CaCl 2 are used as references (for control and also for calculating
surface density of ions at the interface). Each point of intensity is an integration over Q z = 0.015−0.018 Å −1 .
[image:8.594.62.273.69.485.2]
Table 1. Parameters of 2D superlattice of nonbase-pairing ssDNA-AuNPs induced by MgCl 2
and CaCl 2 .
Parameters of the ssDNA-AuNP superlattice 5 × 10 −3 M MgCl
2 50 × 10 −3 M MgCl 2 50 × 10 −3 M CaCl 2
Lattice parameter of 2D superlattice, a ≈26 nm ≈22 nm ≈22 nm
Grain size ≈75 nm ≈220 nm ≈240 nm
Diameter of AuNPs, D 8.9 ± 0.8 nm 8.9 ± 0.8 nm 8.9 ± 0.8 nm
Number of DNA chains per ssDNA-AuNP, Σ 40−60 [ 29,30 ] 40−60 [ 29,30 ] 40−60 [ 29,30 ]
Number of Ca 2+ cations per ssDNA-AuNPs NA NA 380−1570
[image:8.594.232.544.622.717.2]FULL P
APER
for −(CH 2 ) 6−), thus the free energy per chain for transferring
from water to air, [ 33 ]
Ghydro γsAm cmk TB
Δ ≈ = ( 1)
where c = 1.94, k B is the Boltzmann’s constant, T = 298 K. The
electrostatic free energy, which favors solubility of DNA, is esti-mated as
log 4
1 2
0 min
G n k T X q q
d
elec B i
r πε ε
( )
Δ ≈ ⎛ +
⎝⎜
⎞
⎠⎟ ( 2)
where n is the number of bases in ssDNA, X i is the molar
frac-tion of the salt in water, q 1 and q 2 are charges of cations and the
PO 4 − group in the DNA, ε0 is vacuum permittivity, εr = 78.5 is
relative permittivity of water at 298 K, and d min is the minimum
distance between the cation and the PO 4 − group (the sum of
two ionic radii). This is a generalization of a similar argument used to compute the solubility of simple salts. [ 33 ] The critical
salt concentration above which all nanoparticles migrate to the interface occurs when ΔG hydro +ΔG elec = 0, yielding a threshold
salt concentration for crystallization
55.5
cm 4
1 2 0 min
saltc e n
q q d k T
r B
[ ]
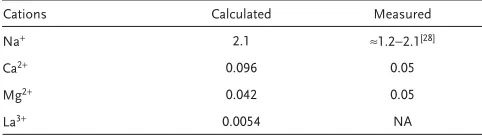
= − −πε ε ( 3)where the constant 55.5 is a conversion to mole per litter. The calculated critical concentration for different salts are listed in
Table 2 , using the ionic radii from ref. [ 34 ] (we use the radius of
the OH − group, 1.33 Å, to represent the O − in the PO 4 − anion).
These values give fairly reasonable estimates, which are compa-rable to the experimental values obtained at concentrations that induce crystallization. Overall, these calculations are less sensi-tive to the number of bases per chain, n , but more to ionic radii and valence. We note that the concentration of LaCl 3 we used
(based on the ionic strength of MgCl 2 ) is much higher than the
calculated critical concentration for which precipitates of NPs form and no surface crystallization is observed (see Figure 5 ). By contrast, adding NaCl at ionic strength (150 × 10 −3 M ) is too
low to induce the 2D crystallization (see Figure 5 ) as shown in Table 2 .
As for the crystallization of the ssDNA-AuNP-Ca complex, we argue that it results from electrostatic correlations among inter-digitated salt-neutral DNA strands in similar fashion to ionic crystals. For overall neutral (see Table 1 ) but charged nano-particles, the energy is minimized when charges are as closely packed together as possible. Thus, nearest neighbor nanopar-ticles will experience an electrostatic attractive force (see more details in the Supporting Information).
There are a few consequences to our study: (1) The common functionalization of AuNPs with thiolated-ssDNA introduces hydrophobic/hydrophilic character to the complexed DNA-AuNPs that by regulating salt concentration or pH can drive the complex to the surface. There is a gradual enrichment of capped-AuNPs with the increase of divalent salt such that at minute salt concentrations the particles at the aqueous surface are not correlated. Increasing the salt concentrations enriches the surface further and the particles exhibit short-range order, and above a threshold concentration (≈50 × 10 −3 M for divalent
ions) 2D crystallization occurs. We note that the lattice con-stant gradually shrinks with the increase of salt concentration as the DNA becomes more and more neutral and repulsive electrostatic forces between DNA arms become weaker. (2) The reasonable agreement of calculated and measured critical salt concentration for crystallization at the surface strongly suggests for the noncomplementary ssDNA-AuNP system the DNA plays electrostatic role with similar outcome if it is replaced by a simpler polyelectrolyte, consistent with conclusions of a recent study. [ 28 ] We note that in this study we used ssDNA of
one length, but intuitively and inspection of Equation ( 3) clearly shows that the threshold crystallization concentration scales with the length of the DNA; namely, the longer the DNA is, the more salt is required for crystallization. In addition, we expect the lattice constant in the short- and long-range order phases to scale with the DNA length, as reported by other groups with similar material systems. [ 27–29 ] (3) Electrostatic correlations
among interdigitated ssDNA induce an attractive interaction that drives the 2D crystallization. These electrostatic inter-actions, however, are too weak against DNA hybridizations driven by complementary strands when those are present. It is worth noting that all procedures for 3D crystallization ssDNA-AuNPs with complementary base-pairing require temperature cycling up to the melting temperature of base-paired DNA. We have not conducted such temperature cycling procedure.
3. Conclusion
Using surface-sensitive grazing incidence X-ray scattering and spectroscopic techniques, we have determined the role that salts play in inducing spontaneous formation of Gibbs monolayers from solutions of ssDNA-AuNPs at the vapor– liquid interface. GISAXS and XRR results demonstrate that for ssDNA-AuNPs, without complementary partners, gradual increase of the divalent ion (Mg 2+ and Ca 2+ ) concentrations
steadily increases the migration of the particles to the surface and that beyond a threshold concentration, the monoparticle layer transforms from short- to long-range-in-plane order, con-sistent with a recent study that used similar ssDNA-AuNPs. [ 28 ]
X-ray fl uorescence provides quantitative cation enrichment at the surface that is correlated with charge screening of the DNA. Charge screening of DNA with cations, and the hydro-phobicity of ssDNA-AuNPs due to the hydrocarbon chains accompanying the thiol group that modifi es the DNA, account for the interfacial accumulations of nanoparticles. We also fi nd that for the same ionic strength, monovalent (NaCl) and tri-valent (LaCl 3 ) salts are much less effective than their divalent
counterparts (MgCl 2 and CaCl 2) in migrating and inducing
Table 2. Measured and calculated critical solubility concentration (in M )
for ssDNA-AuNPs with n = 50 bases in DNA chains using Equation ( 3) .
Cations Calculated Measured
Na + 2.1 ≈1.2−2.1 [ 28 ]
Ca 2+ 0.096 0.05
Mg 2+ 0.042 0.05
[image:9.594.50.291.649.717.2]2D crystallization. According to our measurements and model estimates, the formation of the Gibbs layer is not a function of the ionic strength but results from an interplay between hydrophobic forces and counterion polyelectrolyte electrostatics for which quantitative arguments are provided in this manu-script. Whereas crystallization with relatively long-range 2D order develops in the presence of divalent cations for ssDNA-AuNPs with nonpaired partners, for complementary base-paired ssDNA-AuNPs solution, only 2D short-range ordering is observed with two interfacial layers. The main message of this study is that there is a hydrophobic “price” to adding the thiol group to ssDNA to functionalize AuNPs that may inadvertently affect the outcomes (favorable or not), nevertheless pointing to a new direction, where hydrophobicity and electrostatic (i.e., hydrocarbons and polyelectrolytes) can be used cooperatively to design and control organic and inorganic structures and their functions at interfaces.
4. Experimental Section
Sample Preparation : Gold nanoparticles of 10 nm nominal diameter were purchased from Ted Pella and their actual distribution size measured by small-angle X-ray scattering (SAXS) is determined to be 8.9 ± 0.8 nm (see details in Figure 2 a). The 5′-thiolated single-stranded DNA was purchased from Integrated DNA Technologies as disulfi des and the sequences are shown in Table S1 (Supporting Information). The single-stranded DNA functionalized gold nanoparticles (ssDNA-AuNPs) were synthesized according to published procedures [ 19,35–37 ]
with slight modifi cations. Briefl y, the disulfi de was fi rst cleaved in 50 × 10 −3 M dithiothreitol (Pierce Biotechnology, Thermo Scientifi c)
solution for 30 min, followed by purifi cation on a freshly fl ushed NAP-5 column (Sephadex G-25 DNA grade, GE Healthcare) with Millipore water (18.2 MΩ•cm). The cleaved thiolated ssDNA was quantifi ed with a UV–visible spectrophotometer and then mixed with gold nanoparticles in an approximate ssDNA/AuNP molar ratio of 300. The mixture of AuNPs and thiolated ssDNA was allowed to incubate in a nonbuffered solution at room temperature under orbital shaking for about half a day. The mixture of ssDNA and nanoparticles were buffered with a phosphate buffer (100 × 10 −3 M phosphate, pH 7.0) and the phosphate
concentration was brought up to 10 × 10 −3 M . The mixture was annealed
at room temperature for about 2 h. In the salting process, the NaCl concentration of the mixture was initially increased to 0.025 M with another phosphate buffer (10 × 10 −3 M phosphate, 2 M NaCl, pH 7.0).
The solution was sonicated for 10 s, followed by a 1-h incubation period at room temperature. Then the buffer containing 2 M NaCl was added
to the mixture stepwise so that the NaCl concentration was gradually increased to 0.1 M with 0.025 M increments for each step, and fi nally
to 0.5 M with every 0.05 M increments. Each step also consists of
10-s sonication and additional 30-min incubation. The fi nal mixture was aged at room temperature with orbital shaking for 1 day to allow for maximum DNA loading. The as-prepared ssDNA-AuNPs were washed with Millipore water at least three times with centrifugation (at 20000 g × 1 h). The concentration of ssDNA-AuNPs was determined by UV–vis analysis. The number of ssDNA chains loaded on each AuNP was reported to be 40–60 for the thiolated ssDNA and similar size AuNPs used in this work. [ 29,30 ]
Liquid Surface X-Ray Scattering Setup : A home-built square Tefl on trough (60 mm × 60 mm) containing ssDNA-AuNPs solutions is placed in a sealed enclosure for X-ray scattering measurements. Typically, 9 mL of 4–5 × 10 −9 M ssDNA-AuNPs dispersed in Millipore water is added
to the trough and the salt concentration is elevated to a certain level with high concentration salt solution. The chamber is sealed and air is displaced by fl owing water-saturated helium to minimize radiation damage and reduce background scattering from air. Meanwhile, the
ssDNA-AuNPs-salt-solution is allowed to equilibrate for ≈ 30 min, and the trough is continuously purged with water-saturated helium to maintain a low oxygen level. Then, a highly monochromatic and collimated X-ray beam illuminates the liquid surface at an incident angle of αi to obtain GISAXS, X-ray refl ectivity and fl uorescence (see Figure 7 ).
The 9ID-B liquid surface spectrometer (LSS) at the Advanced Photon Source (APS), Argonne National Laboratory was used for this study and was tuned to a monochromatic beam E = 13.474 keV (wavelength
λ = 0.920 Å; and wave-vector k 0 = 6.8295 Å −1). The illustration in
Figure 7 shows the experimental setup that allows a combination of the grazing incidence small-angle X-ray scattering (GISAXS), X-ray refl ectivity (XRR), and X-ray fl uorescence (XRF) from the same samples. The lateral packing of nanoparticles self-assembly at the interface is determined from the GISAXS at αi = 0.075° for which the
scattered beam is collected by a 2D Pilatus100 k detector (pixel size 172 µm). The sample-to-detector distance is calibrated with a silver behenate standard. The scattering is displayed as a ( Q y , Q z ) 2D map
where Qy=2k0cosαfsin( /2)Ψ and Qz=k0(sinαi+sinαf) (Figure 7 ).
The XRR intensity as a function of Q z , (Qz=4 sinπ α λi/ ), measured
with a point detector, provides the electron density profi le normal to the surface by nonlinear least square fi t to a model system. [ 31,32 ] The
combination of GISAXS and XRR presents the in-plane and surface-normal structural evolution of Gibbs monolayer of nanoparticles. Since salts play a critical role in Gibbs monolayer formation, XRF measurements are conducted at different Q z using a Vortex energy
dispersive detector (EDD) and are used to determine quantitatively the density of specifi c ions that migrate from the salt bulk solution to the interface (more details can be found in elsewhere [ 38 ] ). The fl uorescence
from pure salt solution in the absence of nanoparticles in solution serves as a reference to calibrate the detected intensity to obtain enriched ion densities at the surface.
Supporting Information
Supporting Information is available from the Wiley Online Library or from the author.
Figure 7. A schematic of the experimental setup of liquid surface X-ray scattering measurements for 2D self-assembly of nanoparticles at the air–liquid interface. A monochromatic X-ray beam with the wavevector
k i illuminates the liquid surface at an incident angle with respect to the
surface, αi . The beam is scattered by the electron density variations at
the surface and displayed at a corresponding exit angle αf and in-plane
scattering angle ψ. The grazing incidence small-angle X-ray scattering (GISAXS) pattern is collected by an area detector. The X-ray refl ectivity (XRR) (αf =αi , ψ= 0°) is recorded using a point detector and expressed as
a function of Q z , (Qz=4 sin /π α λi ). The X-ray fl uorescence (XRF) excited
from the surface is measured at different Q z values with an energy
Acknowledgements
The authors thank Xiaobing Zuo for technical support with SAXS measurements conducted at the 12ID-B beamline at the Advanced Photon Source. Research in the Ames Laboratory is supported by the U.S. Department of Energy, Offi ce of Basic Energy Sciences, Division of Materials Sciences and Engineering through Iowa State University under Contract No. DE-AC02-07CH11358. Use of the Advanced Photon Source, an Offi ce of Science User Facility operated for the U.S. Department of Energy Offi ce of Science by Argonne National Laboratory, is supported by the U.S. Department of Energy under Contract No. DE-AC02-06CH11357.
[1] D. Nykypanchuk , M. M. Maye , D. van der Lelie , O. Gang , Nature
2008 , 451 , 549 .
[2] S. Y. Park , A. K. R. Lytton-Jean , B. Lee , S. Weigand , G. C. Schatz , C. A. Mirkin , Nature 2008 , 451 , 553 .
[3] M. Grzelczak , J. Vermant , E. M. Furst , L. M. Liz-Marzán , ACS Nano
2010 , 4 , 3591 .
[4] R. J. Macfarlane , B. Lee , M. R. Jones , N. Harris , G. C. Schatz , C. A. Mirkin , Science 2011 , 334 , 204 .
[5] T. P. Bigioni , X.-M. Lin , T. T. Nguyen , E. I. Corwin , T. A. Witten , H. M. Jaeger , Nat. Mater. 2006 , 5 , 265 .
[6] M. I. Bodnarchuk , M. V. Kovalenko , W. Heiss , D. V. Talapin , J. Am. Chem. Soc. 2010 , 132 , 11967 .
[7] E. V. Shevchenko , D. V. Talapin , N. A. Kotov , S. O’Brien , C. B. Murray , Nature 2006 , 439 , 55 .
[8] Y. Zhang , F. Lu , K. G. Yager , D. van der Lelie , O. Gang , Nat. Nano-technol. 2013 , 8 , 865 .
[9] C. Zhang , R. J. Macfarlane , K. L. Young , C. H. J. Choi , L. Hao , E. Auyeung , G. Liu , X. Zhou , C. A. Mirkin , Nat. Mater. 2013 , 12 , 741 . [10] D. V. Talapin , E. V. Shevchenko , M. I. Bodnarchuk , X. Ye , J. Chen ,
C. B. Murray , Nature 2009 , 461 , 964 .
[11] D. V. Talapin , J.-S. Lee , M. V. Kovalenko , E. V. Shevchenko , Chem. Rev. 2010 , 110 , 389 .
[12] S. J. Tan , M. J. Campolongo , D. Luo , W. Cheng , Nat. Nanotechnol.
2011 , 6 , 268 .
[13] K. L. Young , M. B. Ross , M. G. Blaber , M. Rycenga , M. R. Jones , C. Zhang , A. J. Senesi , B. Lee , G. C. Schatz , C. A. Mirkin , Adv. Mater.
2014 , 26 , 653 .
[14] A. V. Tkachenko , Phys. Rev. Lett. 2002 , 89 , 148303 .
[15] A. Courty , A. Mermet , P. A. Albouy , E. Duval , M. P. Pileni , Nat. Mater. 2005 , 4 , 395 .
[16] S. Sun , C. B. Murray , D. Weller , L. Folks , A. Moser , Science 2000 ,
287 , 1989 .
[17] J. Cheon , J.-I. Park , J.-s. Choi , Y.-w. Jun , S. Kim , M. G. Kim , Y.-M. Kim , Y. J. Kim , Proc. Natl. Acad. Sci. USA 2006 , 103 , 3023 . [18] H. Xiong , M. Y. Sfeir , O. Gang , Nano Lett. 2010 , 10 , 4456 .
[19] M. M. Maye , D. Nykypanchuk , M. Cuisinier , D. van der Lelie , O. Gang , Nat. Mater. 2009 , 8 , 388 .
[20] M. A. Boles , D. V. Talapin , J. Am. Chem. Soc. 2015 , 137 , 4494 . [21] C. Knorowski , A. Travesset , Curr. Opin. Solid State Mater. Sci. 2011 ,
15 , 262 .
[22] C. Knorowski , S. Burleigh , A. Travesset , Phys. Rev. Lett. 2011 , 106 , 215501 .
[23] T. I. N. G. Li , R. Sknepnek , R. J. Macfarlane , C. A. Mirkin , M. Olvera de la Cruz , Nano Lett. 2012 , 12 , 2509 .
[24] A. Travesset , Proc. Natl. Acad. Sci. USA 2015 , 112 , 9563 . [25] N. Horst , A. Travesset , J. Chem. Phys. 2016 , 144 , 014502 .
[26] W. Cheng , M. R. Hartman , D.-M. Smilgies , R. Long , M. J. Campolongo , R. Li , K. Sekar , C.-Y. Hui , D. Luo , Angew. Chem., Int. Ed. 2010 , 49 , 380 .
[27] M. J. Campolongo , S. J. Tan , D.-M. Smilgies , M. Zhao , Y. Chen , I. Xhangolli , W. Cheng , D. Luo , ACS Nano 2011 , 5 , 7978 .
[28] S. J. Tan , J. S. Kahn , T. L. Derrien , M. J. Campolongo , M. Zhao , D.-M. Smilgies , D. Luo , Angew. Chem., Int. Ed. 2014 , 53 , 1316 . [29] S. Srivastava , D. Nykypanchuk , M. Fukuto , O. Gang , ACS Nano
2014 , 8 , 9857 .
[30] S. Srivastava , D. Nykypanchuk , M. Fukuto , J. D. Halverson , A. V. Tkachenko , K. G. Yager , O. Gang , J. Am. Chem. Soc. 2014 , 136 , 8323 .
[31] D. Vaknin , in Characterization of Materials , (Ed.: E. N. Kaufmann ) , John Wiley & Sons , New York, USA 2012 , 2 , 1393 .
[32] L. G. Parratt , Phys. Rev. 1954 , 95 , 359 .
[33] J. N. Israelachvili , Intermolecular and Surface Forces , Academic Press , Waltham, MA, USA 2011 .
[34] Y. Marcus , Ions in Solution and their Solvation , Wiley , Hoboken, NJ, USA 2015 .
[35] H. D. Hill , C. A. Mirkin , Nat. Protoc. 2006 , 1 , 324 .
[36] S. J. Hurst , A. K. R. Lytton-Jean , C. A. Mirkin , Anal. Chem. 2006 , 78 , 8313 .
[37] M. M. Maye , D. Nykypanchuk , D. van der Lelie , O. Gang , J. Am. Chem. Soc. 2006 , 128 , 14020 .
[38] W. Wang , R. Y. Park , D. H. Meyer , A. Travesset , D. Vaknin , Langmuir