BMC Physiology 2002,
2 x
Research article
Variability within individuals of plasma ionic magnesium
concentrations
Ian J Newhouse *, Kris P Johnson , William J Montelpare and
Jim E McAuliffe
Address: School of Kinesiology, Lakehead University, Thunder Bay, Ontario, Canada
E-mail: Ian J Newhouse* - [email protected]; Kris P Johnson - [email protected];
William J Montelpare - [email protected]; Jim E McAuliffe - [email protected] *Corresponding author
Abstract
Background: With the invention of the ion-selective electrode (ISE), ionic magnesium (iMg) is a common blood assay. This could be advantageous, as iMg is the biologically active form of Mg. There is some evidence that iMg has considerable within subject variability.
Results: Individual ranges averaged .08 mmol/L (range .05 to .14). Coefficients of variation (CV) ranged from 3% to 7% (mean 4%) while analytical variation was determined to be 2.3%. Biological variability thus accounts for almost half of the variability, which is clinically significant, as 9 of the 13 subjects recorded at least one value below a reference range of .46 – .60 mmol/L. A significant within-day variation (p < .001) was noted, with differences between 7:00 and 10:00 as well as 10:00 and 22:00. Between day variations were not significant (p = .56).
Conclusions: A plausible explanation of this data is that iMg has a circadian rhythm. Thus, cautious interpretation of single iMg values is warranted until future research determines the nature of iMg variability.
Background
Advances in ionic sensitive electrode (ISE) technology has allowed ionic magnesium (iMg) to become a common measure of Mg status. However, some evidence has shown that iMg may be quite variable and thus not a reliable measure. The primary purpose of this study was to analyze the variability of iMg to determine if it is a reliable meas-ure. If iMg is variable, a secondary purpose was to deter-mine if a diurnal pattern exists over the course of three days.
The rationale for studying the variability of iMg lies in the physiological importance of magnesium, the prevalence of Mg deficiencies and the emergence of iMg as a
poten-tially sensitive measure of Mg status. The usefulness of iMg in both clinical or research settings hinges on the es-tablishment of the assay's variability.
Magnesium is the second most abundant cation found in the intracellular fluid and the fourth most abundant cati-on in the extracellular fluid [1]. It is a cofactor for more than 325 enzymatic reactions including adenosine tri-phosphate (ATP) metabolism, glucose utilization, muscle contraction and synthesis of fat, protein, and nucleic acids [2]. It is also involved in intermediary metabolism, neu-romuscular activity, secretion, excitation-secretion cou-pling, cardiovascular health and bone metabolism [3].
Published: 26 April 2002
BMC Physiology 2002, 2:6
Received: 2 January 2002 Accepted: 26 April 2002
This article is available from: http://www.biomedcentral.com/1472-6793/2/6
A number of disease states have been associated with mag-nesium imbalances and include: cardiovascular diseases, neuromuscular disorders, higher mortality rates [4], renal diseases, drug toxicities, asthma [5], migraines, premen-strual syndrome, pre-eclampsia, eclampsia, menopausal bone problems [3], atherosclerosis, diabetes mellitus, obesity [6], and hypertension [7]. As well, Lukaski [8] has noted a decrease in athletic performance as a result of magnesium deficiency/imbalances.
Low dietary intakes of Mg may account for low Mg status in many individuals. Altura [9] found that dietary intakes of magnesium in the United States have been declining since the turn of the century from about 500 mg/day to 175–225 mg/day. According to the National Research Council of Canada, [10], this is due to the increasing use of fertilizers (lacking Mg) and food processing (removing Mg). Some investigators believe that the current RDA of 350 mg/day for men and 300 mg/day for women as rec-ommended by the US National Academy of Sciences is too low and should be 450–500 mg/day [11].
According to Djurhuus et al., [6] there is no consensus re-garding measurement of magnesium. Although muscle Mg, obtained through a needle biopsy, is thought to be re-liable, it is time consuming to perform, very invasive and causes discomfort to the patient. Magnesium status can also be measured in the serum, erythrocytes, and lym-phocytes or through a magnesium load test with urinary excretion [6]. However, Djurhuus et al., [6] have found that urinary Mg is quite variable, so generally it cannot be used to evaluate Mg status. The total amount of Mg in se-rum (TMg) is the most common means for measuring magnesium status. Although TMg has been the most com-mon measure for magnesium status, since the introduc-tion of the ISE for Mg, ionic Mg has been widely used and may become the new standard.
There is approximately 1000 mmol of magnesium in the human body [12], with muscle and bone comprising ap-proximately 80% of total body Mg [6]. The serum portion of blood contains less than 1 percent, yet is the most ac-cessible source for Mg measurement. Serum Mg can fur-ther be subdivided into its component parts: ionic, complex-bound, and protein-bound. It is the free (ionic) portion, however, that is most important because it is physiologically active [13]. Ionic magnesium levels have been found by Altura & Altura, [5] to be altered in some disease states and should prove to be of importance in dis-ease management.
Despite the clinical advantages that iMg has to offer, its usefulness may be compromised by physiological varia-bility. Studies have shown a circadian rhythm associated with TMg as well as iMg. In 1978, Touitou et al.[12] found
a significant circadian rhythm in TMg. As well, Willimzig, Latz, Vierling & Mutschler [14] found a noticeable circadi-an fluctuation of TMg with a peak in evening hours circadi-and strong fluctuations in the morning. Ising, Bertschat, Gunther, Jeremias & Jeremias [15] were the first to discov-er a significant circadian rhythm in iMg and obsdiscov-erved the highest concentrations around 9:00 and the lowest con-centrations around 15:00. A further study relating to the discoveries by Ising et al., [15] was conducted by Jacomel-la et al., [16] to see if glucose loading affected the circadian rhythm of iMg and found no significant results.
Although assessment of iMg would appear to have obvi-ous clinical and research implications in the screening, monitoring, diagnosis and treatment of individuals, de-termination of an intra-individual variability would con-found appropriate interpretation of iMg values. This variability has only been hinted at in previous research [12,14–17]. Knowledge of these changes over time is vital to the collection of specimens at appropriate times, selec-tion of relevant reference values, and in diagnosis, because the absence of the expected rhythm may indicate the pres-ence of disease [18]. This research thus represents a critical step in the validation of iMg measurements. If iMg proves to be variable, the nature and physiological mechanisms underlying the variance would need to be determined.
Results
Participants' self-report journals revealed that no unfore-seen circumstances occurred during the three days of test-ing. All subjects maintained normal routines of exercise and lifestyle (work, diet, and sleep), with no unexpected changes in their daily routines (other than the six blood samples per day).
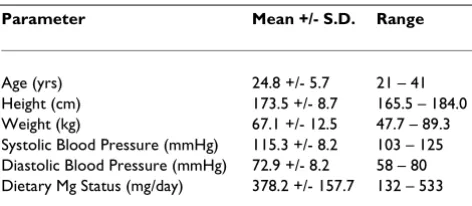
The mean dietary magnesium intakes were 378.2 +/-157.7 mg/day. The dietary analyses showed that four sub-jects (two males and two females) had intakes less than the RDA of 350 mg/day for men and 300 mg/day for women, with both above mentioned male subjects having less than 70% of the RDA. Values over 70% of the RDA are in the acceptable range for adequate nutrition [8].
Mean iMg values and ranges are presented in Figure 1. Nine of the thirteen subjects (69.2%) recorded at least one value below the reference range (0.46 – 0.60 mmol/L) suggested by Ising et al., [15]. The highest value recorded (0.56 mmol/L) was reached by two subjects.
A representative subject's iMg values over the three days are shown in Figure 2. Initial plotting of all of the subject's iMg data revealed the possibility of an inherent rhythm to the data. Mean values for the six time periods of data col-lection as well as the corresponding coefficients of varia-tion (CV) are shown in Table 3.
Within-day and between-day variability
A 3 (Day: 1,2,3) by 6 (Time: 7:00, 10:00, 13:00, 16:00, 19:00, 22:00) repeated measures analysis of variance (ANOVA) was calculated on the iMg values. There was a significant main effect for time (F(5,2) = 6.71, p < 0.001). The main effect for day was not significant (F(2,5) = 2.07, p = 0.142). However, there was a significant interaction (F = 6.71, p < 0.001).
As noted, plotting the data across time points in a given day for a given subject indicated that there was an inher-ent rhythm for the measured variable. Therefore data was transformed and slope scores were used in the subsequent ANOVA. A non-significant result was obtained for the be-tween-day variation (F(2,12) = 0.915, p = 0.557).
Discussion
The key finding of this study is that iMg is not variable from day to day, yet is variable in healthy subjects over the course of one day. The within-day variability is illuminat-ed in the descriptive statistics, a partitioning of variability components (Table 2) and the repeated-measures ANO-VA statistic. In figure #1 for example, participant #1 exhib-ited a range in iMg from .42 to .56 mmol/L. The .42 value, recorded at 10:00 AM on day 3 would put her in a hy-pomagnesemic state, whereas the .56 mmol/L value, re-corded at 10:00 PM on day 1 places her in the upper normal range. Less drastic ranges were observed in the other subjects but nevertheless, the clinical implications in basing a diagnosis or treatment on a single measure-ment are significant. Another problem is that the diurnal rhythms noted are somewhat variable from one individu-al to another, so that no particular time represents a uni-versal maximum or minimum.
Partitioning of variability
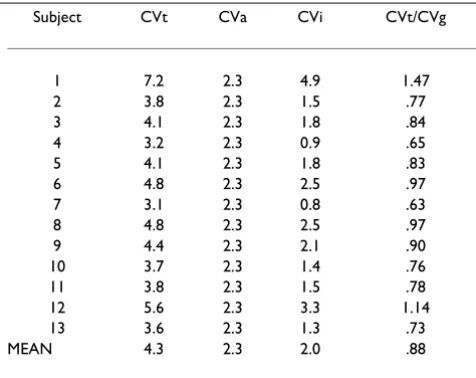
It is essential to obtain separate estimates of the individual (CVi) and analytical (CVa) components of variability that make up the total (CVt). Analytical variability was deter-mined to be a CV of 2.3%. This value exceeds the criterion noted by Fraser and Harris [18], which states that the max-imum allowable analytical variation should be less than or equal to half the average within-subject variation. The average within subject variability was 2.0%. On the other hand a CV of 2.3% is less than a 3% value considered ac-ceptable by Nova Biomedical®. While analytical variability
may be pushing or beyond acceptable limits, 47% (or 2.0/ 4.3) of the total variability of iMg is due to "true" physio-logical variance.
Within-day and between-day variability
Observing a withday variability provides essential in-formation for clinical interpretation of iMg. The data indi-cate that there are specific peaks of iMg concentration as well as troughs, and that these fluctuations follow a diur-nal rhythm. The discrepancy between consecutive blood samples (7:00 and 10:00) indicates that iMg may not be a suitable means of diagnosing Mg status. A patient in a clinic may show a normal ionic magnesium level if tested at 7:00 but could be deficient if tested again at 10:00. More research in this area is needed for a better under-standing of within-day iMg variability. The findings of the present study are consistent with Ising et al., [15] who found a maximum value in the morning and a minimum value later in the day.
Coefficients of variation (CV) were calculated for the com-bined set of blood samples taken during each time period which showed that the lowest variation (3.9%) occurred during the first blood sample (7:00), while the second, fourth and sixth blood samples (10:00, 16:00, and 22:00) had the highest CV at 5.2%, which suggests that the best time for blood collection is first thing in the morning. These results are in agreement with Fraser & Harris [18] who reported that the ideal method for specimen sam-pling is to collect the specimen from fasting, non-exer-cised subjects between 7:00 and 9:00.
A non-significant between-day variability is important to the utility of iMg as a reliable means of measuring Mg sta-tus, as it shows that multiple samples when converted to sinusoidal data for each day for three consecutive days will not significantly vary. This will add confidence to the clinician when measuring iMg in hospitalised patients, as stability can be monitored successfully from day to day, or more importantly when values are changing daily and are no longer stable. It should be kept in mind though that the total duration of this study was only three days. Many analytes show cyclical rhythms, which can be circadian, monthly, or seasonal in nature [17].
Table 1: Characteristics of participants
Parameter Mean +/- S.D. Range
Circadian rhythm
There are a number of reasons that could explain the dis-covered within-day variability, including analytical error or biological variability perhaps due to exercise, diet, stress or circadian rhythm. Speculation on causal factors that could explain iMg variability must be guarded as nei-ther the purpose nor design of this study was geared to-ward causality. The possibility of a circadian rhythm has been found in previous research [15] and could explain the biological variability found in the subjects in this study. A preliminary examination of plotted individual data showed an inherent rhythm to the data. However, when all data was pooled together and smoothed to a si-nusoidal curve of best fit, the data no longer showed a rhythm to it. Therefore, a circadian rhythm may be evi-dent in each individual, which may explain the significant within-day variability. Also, as mentioned above, exercise and diet were not controlled throughout the study, which may influence the results. The fact that biological variabil-ity of iMg does exist but many biological causes are not controlled for in a clinical setting, points to the pressing need for more research along these lines.
Index of Individuality
In order to assess the utility of iMg values, an index of in-dividuality was calculated. When the index of individual-ity is expressed as CVt/CVg, is less than 0.6, conventional population-based reference values are of very limited di-agnostic value [18]. On the other hand though, a low in-dex of individuality means that the indice being measured could find value in the tracking of a disease progression or the effectiveness of the treatment. In contrast, when CVt/ CVg is more than 1.4, observed values can be compared usefully with reference values [18]. With an average ratio of .88, neither conclusion can be drawn. In other words caution is warranted in comparing iMg values to reference ranges and in tracking an individual's values.
The means and ranges of iMg (Figure 1) indicate that the reference range suggested by Ising et al., [15] is not useful with respect to each individual. Each subject's range falls on the low end of the spectrum, yet compared to other population-based reference ranges, this is one of the rang-es with lower valurang-es. The individual rangrang-es would fall completely out of some other population-based ranges. Therefore, the need for subject-based reference intervals may be necessary.
Magnesium status
Although measurement of the variability of iMg was the focus of the study, Mg status is also very important, as iMg is a means for determining total body magnesium status. Using the reference range by Ising et al. [15] (0.46 – 0.60 mmol/L) and the values obtained from the present study, one is able to determine the status of each subject. The mean values for each subject (18 samples) revealed that one subject rests on the border of Mg deficiency (O.46 mmoI/L) while all other subjects have normal mean iMg values but are on the low end of the range (highest indi-vidual mean is O.52 mmol/L). Throughout the three days of testing, however, nine of the subjects recorded one or more value below the reference range and would be con-sidered hypomagnesemic. The results of the diet analyses revealed that only two subjects had intakes of dietary Mg below 70% of the RDA, thus suggesting that diet may not be the cause of the low iMg values. One explanation could
be that the NOVA® instrument gives low values
(com-pared to other instruments). This suggestion can be dis-counted though for testing of control samples of known iMg concentrations were always within acceptable ranges. A more likely explanation is that most published reference ranges for iMg are inappropriate, since all subjects were healthy individuals.
Figure 1
Means and ranges of iMg in 13 healthy individuals
iM g (m mol/ L)
0.41 0.42 0.43 0.44 0.45 0.46 0.47 0.48 0.49 0 .5 0.51 0.52 0.53 0.54 0.55 0.56 0.57 0.58 0.59 0 .6 13 Healthy Individua ls
Figure 1. Means and Ranges of iMg
Means and Ranges of iMg in 13 Healthy Individuals
iMg (mmol/L)
.41 .42 .43 .44 .45 .46 .47 .48 .49 .50 .51 .52 .53 .54 .55 .56 .57 .58 .59 .60
Figure 2
Typical participant data
Typical participant data
0.42 0.44 0.46 0.48 0.5 0.52
7:00 10:00 13:00 16:00 19:00 22:00
Time
iM
g (
m
mol/
L)
Day 1: CV = 2.1% Day 2: CV = 1.7% Day 3: CV = 2.5%
Greenway et al. [4] proposed that to use iMg as a valid bi-ochemical marker, it is essential to establish a reliable ref-erence interval in a healthy population. Close examination of previous studies that determined refer-ence ranges for iMg has shown that wide spectrums of ranges have been developed. This may be due to the lack of partitioning that has been reported (for example for age, blood group, gender, race, time of day or posture when sampled) and possibly due to the differences among the three different companies and the ISE that they use.
Conclusions
This study concluded that there is a significant within-day variation in iMg (six blood samples per day taken every three hours from 7:00 till 22:00) and a non-significant be-tween-day variation (three consecutive days of sampling). The significant within day variability of iMg should be ac-counted for in clinical and research settings and caution should be used in interpreting single measurements. A plausible explanation of the data is that iMg has a circadi-an rhythm.
Materials and Methods
Description of ParticipantsThe characteristics of the 13 participants (nine males and four females) that volunteered for the study are listed in table 1. Participant selection for this study was based largely on volunteers who were willing to donate 18 blood samples over three days, but participants were also
screened for smoking (non-smokers), blood pressure (resting blood pressure not higher than 144/94), drug use (prescription and non-prescription), vitamin and/or min-eral use. As well, alcohol consumption was not permitted throughout the duration of the study.
The Lakehead University ethics committee approved the study. After informed consent was obtained from each subject, three consecutive days of testing occurred with six blood samples taken each day for a total of eighteen blood samples. The first blood sample was taken at 7:00 a.m. and every three hours thereafter (7:00, 10:00, 13:00, 16:00, 19:00, 22:00). Blood samples were collected
throughout the study in 7 ml green topped Vacutainer®
tubes (lithium-heparin added) by antecubital venipunc-ture. Prior to blood withdrawal, the subjects were seated for ten minutes. When blood was collected, a tourniquet was applied gently to the upper arm and released prior to actual blood flow.
The Nova 8 stat analyzer® (Nova Biomedical Canada Ltd.,
Mississauga, Ontario) housed in the same laboratory that testing occurred, was used for immediate analysis of [iMg] and Hct, from whole blood samples. Throughout the study, the same technician did all the testing. Within-run variation or CVa (analytical error) was calculated by repli-cate analysis of the specimens (i.e., ten samples in a row of the same blood). Between run variability was not re-corded, although control samples in the normal physio-logical range were consistently within +/- 1 mmol/L of their known concentration.
During the three days of testing, subjects recorded diet, sleep, exercise and stress in a self-monitored logbook. Subjects received information that explained the proce-dure and importance of accuracy for the self-reported logs and were instructed to continue to follow their normal routine as close as possible.
Dietary intakes were analysed using computerised diet software (Diet Analysis Plus®, 1996, West Publishing Co,
St. Paul, MN). Subjects recorded three consecutive days of testing (the same days as the blood samples – two week-days and one weekend day) and all data was entered into the computer by the same technician.
Daily Log
The variables included in the daily log include: (1) Qual-ity of sleep, (2) Number of hours of sleep, (3) length of ex-ercise session, (4) intensity of exex-ercise session, (5) minor illnesses, (6) minor injuries, (7) menstruation, and (8) major stressful events.
Table 2: Partitioning of the variability and index of individuality
Subject CVt CVa CVi CVt/CVg
1 7.2 2.3 4.9 1.47
2 3.8 2.3 1.5 .77
3 4.1 2.3 1.8 .84
4 3.2 2.3 0.9 .65
5 4.1 2.3 1.8 .83
6 4.8 2.3 2.5 .97
7 3.1 2.3 0.8 .63
8 4.8 2.3 2.5 .97
9 4.4 2.3 2.1 .90
10 3.7 2.3 1.4 .76
11 3.8 2.3 1.5 .78
12 5.6 2.3 3.3 1.14
13 3.6 2.3 1.3 .73
MEAN 4.3 2.3 2.0 .88
*Coefficient of Variability (CV) for total (t), analytical (a) and individual
Dependent Variables
(1) Ionic magnesium (mmol/L) – corrected for hemat-ocrit
(2) Hematocrit (%)
Independent Variables
(1) Time
(2) Day
Statistical Analysis
The primary purpose of this study was to determine the variability of iMg in order to determine its utility. Descrip-tive statistics (mean, standard deviation, range and coeffi-cient of variation (CV)) and graphic presentations of the data were used to gain an initial appreciation of the varia-bility of iMg. CVs were computed to assess analytical error (CVa) from ten repeated measures of subject samples (subjects as their own control). Total within-subject vari-ability (CVt) was computed for each subject's 18 samples with the difference between CVa and CVt attributable to biological variability (CVi). To calculate the CV for the six time periods, all blood values obtained at each time peri-od were pooled together (13 subjects × 3 days = 39 val-ues). The average CV for the six time periods constituted the CVg or between-subject variability. An index of indi-viduality was calculated using a ratio of the total within-subject variability and the between-within-subject variability (CVt/CVg), in order to assess the utility of iMg in either monitoring a patient or classifying them based on refer-ence ranges.
A 13 (subjects) × 6 (time periods) repeated measures anal-ysis of variance (ANOVA) was used to calculate the with-in-day variability. Calculation of the between-day analysis requires a data transformation to provide a score for each subject that represents the events of each day across each time measurement. It is important to recognise that the score must consider the events within the measurement interval as a function of events in the preceding interval but while impacting events in each subsequent interval. Plotting the data across time points in a given day for a
given subject indicated that there was an inherent rhythm for the measured variable. Therefore, a linear (summa-tive) transformation was inappropriate for the data. A summative scalar such as the coefficient of variation (standard deviation/mean) only considers the range of the variance distributed over the group mean, thus, a transformation that considers range as well as rhythmicity of responses over the entire collection period was needed. Considering the above, the raw data was transformed us-ing a cosine function (transformed score = 1/
2 sin (raw
score)). The slope of the transformed data curve was then calculated for each subject, for each day, and the slope scores used in a subsequent ANOVA across the three days.
The first two authors, I.J. Newhouse and K.P. Johnson contributed equally to the preparation of this manuscript.
Acknowledgements
The authors would like to acknowledge the participants who volunteered for this study and also Nova Biomedical® Canada Ltd.
References
1. Lewenstam A, Blomqvist N, Ost J: Characterization, standardi-zation and experiences with KONE ISE for Mg.Scandinavian Journal of Clinical and Laboratory Investigation 1994, 54(Supplement 217):37-43
2. Altura BT, Altura BM: A method for distinguishing ionized, complex and protein-bound Mg in normal and diseased sub-jects.Scandinavian Journal of Clinical and Laboratory Investigation 1994,
54(Supplement 217):83-87
3. Muneyyirci-Delale O, Nacharaju VL, Altura BM, Altura BT: Sex ster-oid hormones modulate serum ionized magnesium and cal-cium levels throughout the menstrual cycle in women.Fertility and Sterility 1998, 69(5):598-562
4. Greenway DC, Hindmarsh JT, Wang J, Khodadeen JA, Hebert PC:
Reference interval for whole blood ionized magnesium in a healthy population and the stability of ionized magnesium under varied laboratory conditions.Clinical Biochemistry 1996,
29(6):515-520
5. Altura BT, Altura BM: Measurement of ionized magnesium in whole blood, plasma and serum with a new ion-selective electrode in healthy and diseased human subjects.Magnesium and Trace Elements 1992, 10:Measurement1991-90
6. Djurhuus MS, Gram J, Hyltoft Petersen P, Klitgaard NAH, Bollerslev J, Beck-Nielsen H: Biological variation of serum and urinary magnesium in apparently healthy males.Scandinavian Journal of Clinical and Laboratory Investigation 1995, 55:549-558
7. Paolisso G, Barbagello M: Hypertension, diabetes mellitus, and insulin resistance: the role of intracellular magnesium. Amer-ican Journal of hypertension: journal of the AmerAmer-ican Society of Hyperten-sion 1997, 10(3):346-355
Table 3: Mean iMg Values and Coefficients of Variation for Six Time Periods
T1 (7:00) T2 (10:00) T3 (13:00) T4 (16:00) T5 (19:00) T6 (22:00)
iMg (mmol/L) 0.50 0.48 0.48 0.49 0.49 0.50
CV (%) 3.9 5.2 5.0 5.3 4.8 5.2
Publish with BioMed Central and every scientist can read your work free of charge
"BioMedcentral will be the most significant development for disseminating the results of biomedical research in our lifetime."
Paul Nurse, Director-General, Imperial Cancer Research Fund
Publish with BMCand your research papers will be:
available free of charge to the entire biomedical community
peer reviewed and published immediately upon acceptance
cited in PubMed and archived on PubMed Central
yours - you keep the copyright
[email protected] Submit your manuscript here:
http://www.biomedcentral.com/manuscript/
BioMedcentral.com 8. Lukaski HC: Micronutrients (magnesium, zinc, and copper):
Are mineral supplements needed for athletes? International Journal of Sports Nutrition 1995, 5:S74-83
9. Altura BM: Introduction: importance of Mg in physiology and medicine and the need for ion selective electrodes. Scandina-vian Journal of Clinical and Laboratory Investigation 1994, 54(Supple-ment 217):5-9
10. National Research Council of Canada: Water hardness, human health, and the importance of magnesium.Ottawa, ON: NRCC Publications 1979
11. Altura BM, Altura BT: Role of magnesium in patho-physiologi-cal processes and the clinipatho-physiologi-cal utility of magnesium ion selec-tive electrodes. Scandinavian Journal of Clinical and Laboratory Investigation 1996, 56(Supplement 224):211-234
12. Touitou Y, Touitou C, Bogdan A, Beck H, Reinberg A: Serum mag-nesium circadian rhythm in human adults with respect to age, sex and mental status.Clinica Chimica Acta 1978, 87:35-41 13. Hoshino K, Ogawa K, Kitazawa R, Nakamura Y, Uehara R: Ionized
magnesium level in whole blood of healthy Japanese chil-dren.Acta Paediatrica Japonica 1998, 40:116-121
14. Willmzig C, Latz R, Vierling W, Mutschler E, Trnovec T, Nyulassy S:
Increase in magnesium plasma level after orally adminis-tered trimagnesium dicitrate.European Journal of Clinical Pharma-cology 1996, 49:317-323
15. Ising H, Bertschat F, Gunther T, Jeremias E, Jeremias A: Measure-ment of free magnesium in blood, serum and plasma with an ion-sensitive electrode.European Journal of Clinical Chemistry and Clinical Biochemistry 1995, 33:365-371
16. Jacomella V, Sauser A, Truttmann AC, Kulhmann BV-Siegenthaler, S Capilla, Bianchetti MG: Free plasma magnesium following glu-cose loading in healthy humans. Acta Diabetologica 1997,
34(3):235-237
17. Reilly T: Circadian rhythms.In: Oxford Textbook of Sports Medicine (Edited by: M Harris, C Williams, WD Stanish, J Micheli) New York: Oxford University Press 1996, 238-254