Study the applications of water deficiency levels and ascorbic acid
foliar on growth parameters and yield of summer squash plant
(
cucurbita pepo
L.
)
Ebtessam Abd El-mouez Youssef
*, Marwa Mahmoud Abd El-Baset,
Ahmed Faris El-Shafie, Mohammed Morsy Hussein
(Water Relations and Field Irrigation Dept., National Research Centre, Cairo, Egypt.)
Abstract: Two field experiments study during 2015 and 2016 summer seasons on sandy loam soil under drip irrigation system by Nile river water, at the Agricultural Research and Production Station National Research Centre, El- Nubaria region, EL- Beheira Governorate, Egypt. This study focused on the applications of different water deficiency levels (100%, 80% and 60% of F.C. i.e. field capacity) and ascorbic acid (AsA) spraying foliar application with different concentrations (0, 50 and 100 ppm) as antioxidant on growth parameters and yield as well as photosynthetic pigments content of summer squash plants
(Cucurbitapepo L.cv. Eskandrani). Results indicated that, decreasing water levels caused a significant reduction in the all tested growth and yield parameters, i.e., canopy weight, root weight, number of leaves, leaves fresh weight and leaf area as well as photosynthetic pigments content (total chl., and carotenoids), total yield, fruit weight and length. While increasing ascorbic acid spraying foliar application levels as antioxidant significantly increased the aforementioned parameters in the two seasons as compared with control. On the other hand, decreasing water levels caused a significant increasing in leaf proline content, leaf cell sap osmotic pressure, dry matter % and fruit TSS in the two growing seasons as compared with control.
Keywords: water stress, water deficiency, ascorbic acid, antioxidant, growth, yield, summer squash plant and Cucurbita pepo.
Citation: Ebtessam, A. Y., M. A. Marwa, A. F. El-Shafie, M. M. Hussein. 2017. Study the applications of water deficiency levels and ascorbic acid foliar on growth parameters and yield of summer squash plant (cucurbita pepo L.). Agricultural Engineering International: CIGR Journal, Special issue: 147–158.
1 Introduction
Summer squash (Cucurbita pepo L.) is one of the
most important crop of the family cucurbitaceae and of
highly polymorphic vegetable grown during summer, in
tropical and subtropical condition (Tartoura et al., 2014).
In Egypt, summer squash is one of the most popular
vegetable crops (Ibrahim and Selim, 2010).
Egypt produced approximately 559600 ton, of squash,
pumpkin and gourd with an average of 18.2 ton ha-1
(FAOSTAT, 2012).
Received date: 2017-06-03 Accepted date: 2017-12-29 * Corresponding author: E. A. Youssef, Dr., Water Relations and Field Irrigation Dept., National Research Centre, Cairo, Egypt., 33 El-behooth St., Dokki 12622, Cairo, Egypt. Email: [email protected]. Tel: +2 01227227299, Fax: +20233370931.
Water supply is one of the most important factors
which may greatly effect on the yield and quality of
summer squash (Ahmet et al., 2004). Increasing irrigation
frequency caused significant increases in plant water
consumption and yield, whereas, an excessive irrigation
level had a negative Water Relations and Field Irrigation
Dept., National Research Centre., Dokki, Cairo, Egypt.
Deficit irrigation will play an important role in
farm-level water management strategies, with consequent
increases in the output generated per unit of water used in
agriculture. In Egypt, it is necessary to produce the
maximum yield and profit from a unit area by using
available water efficiently because the existing
agricultural land and irrigation water are rapidly
diminishing. Therefore, it is essential to balance water
requirements, water consumption and yield of summer
Vitamins’ could be considered as bio-regulator
compounds which in low concentrations exerted a
profound influence upon plant growth. Ascorbic acid is a
vitamin known as growth regulating factor which
influences many biological processes. It is currently
considered to as a plant growth regulator due to its effect
on cell division, differentiation and various growth
factors. Ascorbic acid increases nucleic acid content,
especially RNA and acts as co-enzyme in the enzymatic
reactions by which carbohydrates, proteins are
metabolized and involved in photosynthesis and
respiration (Mazher, Azza et al., 2011; Masoud and
El-Sahrawy, 2012).
Therefore, the aim of this study was to evaluate the
effect of ascorbic acid spraying foliar application on
growth and yield of Cucurbita plants grown under
different water levels.
2 Materials and methods
2.1 The experimental site
The experiments were carried out at the Agricultural
Research and Production Station, National Research
Centre, under open field conditions at El-Nubaria region,
EL-Beheira Governorate, Egypt. Two successive
summer seasons of 2015 and 2016 to study the effect of
different water levels and scorbic acid spraying foliar
application with different concentrations on growth,
some physiological aspects and yield of summer squash
plants.
The soil of the experimental site is classified as sandy
soil. Irrigation water was obtained from an irrigation
channel (Nile water) going through the experimental area,
with pH 7.3, and electrical conductivity of 0.37 dS m-1,
containing very suitable amount of cations and anions.
Some of the physical, chemical properties of the soil and
Irrigation water of the experimental site were estimated in
the Soil laboratory, National Research Centre, at the
beginning of the trial and are reported in Tables 1, 2 and
3 respectively.
2.2 Experimental design
The experimental design was split plot with three
replications which include 9 treatments. The main plots
were assigned to three levels of water applied (100%,
80% and 60% of F.C.). Subplots were ascorbic acid (AsA)
spraying foliar application with different concentrations
(0, 50, 100 ppm) as antioxidant. Each subplot area was
21 m2 and contained 6 rows, 70 cm width and 5 m length.
Each treatment was separated by two guard ridges.
Table 1 Some physical properties of the soil
Depth, cm
Particle size distribution, %
Texture class
θS % on weight basis
HC, cm h-1
BD, g cm-3
P, cm3 voids
cm-3 soil
C. Sand F. Sand Silt Clay F.C. P.W.P. A.W
0-15 8.4 77.6 8.5 5.5 Sandy 12 4.1 7.9 6.68 1.69 0.36
15-30 8.6 77.7 8.3 5.4 Sandy 12 4.1 7.9 6.84 1.69 0.36
30-45 8.5 77.5 8.8 5.2 Sandy 12 4.1 7.9 6.91 1.69 0.36
45-60 8.8 76.7 8.6 5.9 Sandy 12 4.1 7.9 6.17 1.67 0.37
Note: F.C.: Field Capacity, W.P.: Wilting Point, AW: Available Water, HC: Hydraulic conductivity, BD: Bulck density and P: Porosity.
Table 2 Some chemical properties of the soil
Depth, cm
pH 1:2.5
EC dS m-1
Soluble Cations, meq L-1 Soluble Anions, meq L-1
Ca++ Mg++ Na+ K+ CO
3-- HCO3- SO4-- Cl
-0-15 8.3 0.35 0.50 0.39 1.02 0.23 0 0.11 0.82 1.27
15-30 8.2 0.36 0.51 0.44 1.04 0.24 0 0.13 0.86 1.23
30-45 8.3 0.34 0.56 0.41 1.05 0.23 0 0.12 0.81 1.23
45-60 8.4 0.73 0.67 1.46 1.06 0.25 0 0.14 0.86 1.22
Table 3 Some chemical properties of irrigation water
pH EC, dS m-1
Soluble cations, meq L-1 Soluble anions, meq L-1
SAR
Ca++ Mg++ Na+ K+ CO
3-- HCO3- SO4-- Cl
2.3 Irrigation system description
Automatic drip irrigation system consists of
Polyethylene Tank 5 m3, centrifugal pump (0.75HP),
screen filter 1.5" diameter, spring brass non-return valve
2", Pressure gauges, control valves and flow meter
chemical injection equipment. Main line of a nominal
diameter 63 mm /6 bar PVC pipeline convey water to sub
main lines. Sub main line of a nominal diameter 32 mm,
PVC pipeline, connected to solenoid valve, derived from
the main line to feed the group of the laterals which
represent a treatment. Laterals, it is 16 mm diameter PE
tubes, with 30 cm apart, built in emitters of 4 L h-1
discharge at 1bar operating pressure. Distance between
laterals was 70 cm.
Squash seeds (cv. Eskandrani) were sown on one side
to each furrow at 40 cm distance between plants at the
first of April in the two growing seasons. After 20 days
from planting seeds were subjected to three levels of soil
moisture. The first is irrigation after 60% depletion of
F.C. i.e. normal water applied, the second is irrigation
after 80% depletion of F.C. i.e. moderate water applied
and the third is irrigation after 100% depletion of F.C. i.e.
moisture stress. Ascorbic acid (AsA) concentrations were
sprayed at 20, 30 days after planting. Plants were sprayed
with a fine mist of ascorbic acid using a hand pressure
sprayer, till run-off, with care being taken to cover all
plant parts; no surfactants or other wetting agents were
needed. The control plants were sprayed with water only.
Plants were fertilized with ammonium sulphate
(20.6% N) at a rate of 75 N kg fed-1, calcium super
phosphate (16% P2O5) at rate of 40 kg P2O5 fed-1, and
potassium sulphate (48% K2O) at a rate of 48 kg K2O fed
-1, that were divided in two equal portions. The first
portion of calcium super phosphate was added during
seed bed preparation and the second portion was added
with the first portion of N and K fertilizers which added
at the fourth week after seed sowing and the second
portion of N and K fertilizers was added at the eighth
week after seeds sowing. Other agricultural practices
were conducted according to recommendations (Ibrahim
and Selim, 2010).
After 50 days from planting, five plants from each sub
plot were randomly taken for measuring the vegetative
growth parameters, i.e., canopy weight, leaves fresh
weight and leaves dry mater percentage, photosynthetic
pigments content in the 4th leaf i.e., total chlorophyll and
carotenoids (mg g-1 of fresh weight) were colorimetrically
determined as outlined by Arnon (1949). Moreover, the
proline content of fresh leaves was determined as (µg g-1
dry weight) following the method adopted by Bates et al.
(1973). The leaf water relationship content was estimated
following the method stated by Gosov (1960). Leaf area
(cm2) was determined using discs of the leaf blades
according to Bremner and Taha (1966). The leaf osmotic
pressure of the cell sap of leaf blades was determined
following the method of Gosov (1960).
At the harvesting time, fruits of each plot were
harvested by hand every 2-3 days and were classified as
marketable fruits (3-4 cm in diameter and 13-16 cm in
length) and non-marketable fruits (misshapen large and
small fruits) in each harvest, thereafter, marketable and
total fruit yield was determined as, ton fed-1. Also, mean
fruit weight was determined by dividing the total weight
of the harvested fruit on the total number of fruits. At the
seventh harvest, samples of five fruits were taken at
random from each sub plot to determine total soluble
solids percentage by refractomater.
The data of the experiments were subjected to
statistical analysis as A split plot design with three
replicates according to Snedecor and Cochran (1980).
3 Results and discussion
3.1 Growth parameters
The effect of water deficiency levels (100%, 80% and
60% of F.C.) and ascorbic acid (AsA) foliar spraying
with different concentrations (0, 50, 100 ppm) on
Cucurbita plants of canopy weight, root weight, number
of leaves per plant, leaf fresh weight and leaf area is
presented in Table 4.
3.2 Canopy weight (F. W. g-1)
Data in Table 4 cleared significant differences
between water deficiency levels in both seasons. The
highest values were 340.18 and 312.42 g with 100% F.C.,
(i.e. field capacity) and the lowest values were 165.41
and 130.34 g for 60% F.C., respectively in the two
Regarding AsA (i. e. Ascorbic acid) concentrations
effect, it was cleared that canopy weight increased with
AsA level being 186.26, 267.69 and 338.96 g for AsA 0,
50 and 100 ppm, respectively in the first season. The
values in the second season were 159.62, 242.27 and
305.81 g for AsA 0, 50 and 100 ppm, respectively.
The interaction between water deficiency levels and
ascorbic acid concentrations revealed highest values with
100% F.C × AsA 100 ppm being 435.24 and 376.68 g in
the first and second seasons, respectively. On the other
hand, the lowest values came from the interaction 60%
F.C × AsA 0 ppm being 118.95 and 65.88 g in the first
and the second seasons, respectively.
3.4 Root weight (F. W. / g)
Data presented in Table 4 reveal that the root weight
was significantly decreased with increasing water levels.
The highest values were 10.25 and 9.59 g with 100% F.C.,
and the lowest values were 4.92 and 4.34 g for 60% F.C.,
respectively in the two experimental seasons.
Regarding AsA concentrations effect, it was found
that root weight increased with increasing AsA level
(100% ppm) being 10.67 and 9.50 g, respectively in the
two seasons.
Concerning the interaction effects in Table 4, it could
be noticed that the highest values with 100% F.C × AsA
100 ppm being 14.25 and 12.25 g in the first and second
seasons, respectively. On the other hand, the lowest
values came from the interaction 60% F.C × AsA 0 ppm
being 3.50 and 2.50 g in the first and the second seasons,
respectively.
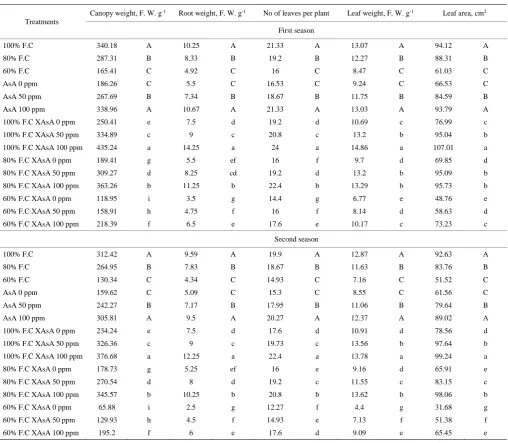
Table 4 Effect of water deficiency, ascorbic acid spraying and their interaction on some vegetative parameters of squash plants (seasons 2015-2016)
Treatments
Canopy weight, F. W. g-1 Root weight, F. W. g-1 No of leaves per plant Leaf weight, F. W. g-1 Leaf area, cm2
First season
100% F.C 340.18 A 10.25 A 21.33 A 13.07 A 94.12 A
80% F.C 287.31 B 8.33 B 19.2 B 12.27 B 88.31 B
60% F.C 165.41 C 4.92 C 16 C 8.47 C 61.03 C
AsA 0 ppm 186.26 C 5.5 C 16.53 C 9.24 C 66.53 C
AsA 50 ppm 267.69 B 7.34 B 18.67 B 11.75 B 84.59 B
AsA 100 ppm 338.96 A 10.67 A 21.33 A 13.03 A 93.79 A
100% F.C XAsA 0 ppm 250.41 e 7.5 d 19.2 d 10.69 c 76.99 c
100% F.C XAsA 50 ppm 334.89 c 9 c 20.8 c 13.2 b 95.04 b
100% F.C XAsA 100 ppm 435.24 a 14.25 a 24 a 14.86 a 107.01 a
80% F.C XAsA 0 ppm 189.41 g 5.5 ef 16 f 9.7 d 69.85 d
80% F.C XAsA 50 ppm 309.27 d 8.25 cd 19.2 d 13.2 b 95.09 b
80% F.C XAsA 100 ppm 363.26 b 11.25 b 22.4 b 13.29 b 95.73 b
60% F.C XAsA 0 ppm 118.95 i 3.5 g 14.4 g 6.77 e 48.76 e
60% F.C XAsA 50 ppm 158.91 h 4.75 f 16 f 8.14 d 58.63 d
60% F.C XAsA 100 ppm 218.39 f 6.5 e 17.6 e 10.17 c 73.23 c
Second season
100% F.C 312.42 A 9.59 A 19.9 A 12.87 A 92.63 A
80% F.C 264.95 B 7.83 B 18.67 B 11.63 B 83.76 B
60% F.C 130.34 C 4.34 C 14.93 C 7.16 C 51.52 C
AsA 0 ppm 159.62 C 5.09 C 15.3 C 8.55 C 61.56 C
AsA 50 ppm 242.27 B 7.17 B 17.95 B 11.06 B 79.64 B
AsA 100 ppm 305.81 A 9.5 A 20.27 A 12.37 A 89.02 A
100% F.C XAsA 0 ppm 234.24 e 7.5 d 17.6 d 10.91 d 78.56 d
100% F.C XAsA 50 ppm 326.36 c 9 c 19.73 c 13.56 b 97.64 b
100% F.C XAsA 100 ppm 376.68 a 12.25 a 22.4 a 13.78 a 99.24 a
80% F.C XAsA 0 ppm 178.73 g 5.25 ef 16 e 9.16 d 65.91 e
80% F.C XAsA 50 ppm 270.54 d 8 d 19.2 c 11.55 c 83.15 c
80% F.C XAsA 100 ppm 345.57 b 10.25 b 20.8 b 13.62 b 98.06 b
60% F.C XAsA 0 ppm 65.88 i 2.5 g 12.27 f 4.4 g 31.68 g
60% F.C XAsA 50 ppm 129.93 h 4.5 f 14.93 e 7.13 f 51.38 f
3.5 Number of leaves per plant
Examination of Table 4 reveals that the number of
leaves per plant of irrigated plants with 60% of F.C., was
the lowest in the two seasons in comparison with the
control (irrigation with 100% of F.C.). The lowest values
were 16.00 and 14.93 for 60% F.C., respectively in the
two experimental seasons.
With regard to the effect of spraying with AsA
concentrations, data indicate that, the number of leaves
per plant increased with AsA level being 16.53, 18.67 and
21.33 for AsA 0, 50 and 100 ppm, respectively in the first
season. The values in the second season were 15.30,
17.95 and 20.27 for AsA 0, 50 and 100 ppm, respectively.
The interaction between water deficiency levels and
ascorbic acid concentrations revealed highest values with
100% F.C × AsA 100 ppm being 24.00 and 22.40 in the
first and second seasons, respectively. On the other hand,
the lowest values came from the interaction 60% F.C ×
AsA 0 ppm being 14.40 and 12.27 in the first and the
second seasons, respectively.
3.6 Leaf weight (F. W. g-1)
Data in Table 4 cleared significant differences
between water deficiency levels in both seasons. The
highest values were 13.07 and 12.87 g with 100% F.C.,
and the lowest values were 8.47 and 7.16 g for 60% F.C.,
respectively in the two experimental seasons.
Regarding AsA concentrations effect, it was cleared
that canopy weight increased with AsA level being 9.24,
11.75 and 13.03 g for AsA 0, 50 and 100 ppm,
respectively in the first season. The values in second
season were 8.55, 11.06 and 12.37 g for AsA 0, 50 and
100 ppm, respectively.
The interaction between water deficiency levels and
ascorbic acid concentrations revealed highest values with
100% F.C × AsA 100 ppm being 14.86 and 13.78 g in the
first and second seasons, respectively. On the other hand,
the lowest values came from the interaction 60% F.C ×
AsA 0 ppm being 6.77 and 4.40 g in the first and the
second seasons, respectively.
3.7 Leaf area (cm2)
The results in Table 4 reveal that the total leaf area
per plant significantly increased with decreasing water
levels. The highest values were 94.12 and 92.63 cm2 with
100% F.C., and the lowest values were 61.03 and
51.52 cm2 for 60% F.C., respectively in the two
experimental seasons.
As for AsA concentrations effect, it was cleared that
total leaf area increased with AsA level being 66.53,
84.59 and 93.79 cm2 for AsA 0, 500 and 100 ppm,
respectively in the first season. The values in second
season were 61.56, 79.64 and 89.02 cm2 for AsA 0, 50
and 100 ppm, respectively.
The interaction between water deficiency levels and
ascorbic acid concentrations revealed highest values with
100% F.C × AsA 100 ppm being 107.01 and 99.24 cm2 in
the first and second seasons, respectively. On the other
hand, the lowest values came from the interaction 60%
F.C × AsA 0 ppm being 48.76 and 31.68 cm2 in the first
and the second seasons, respectively.
These results are in harmony with those results
obtained by Udayet al. (2001), Metwally (2011), Kassab
et al. (2012). They revealed that, growth characteristics
generally improved with the increased in total water
applied during growing period.
Kramer and Boyer (1995) reported that the growth of
plants is controlled by rates of the cell division and
enlargement and by the supply of organic and inorganic
compounds required for the synthesis of new protoplasm
and cell walls. Cell enlargement is particularly dependent
on at least a minimum degree of cell turgor, and stem and
leaf elongations are quickly checked or stopped by water
deficits.
Ascorbic acid increased nucleic acid contents,
especially RNA and protein content. It also affected the
synthesis of enzymes, and proteins. In addition, it acts as
co-enyme in metabolic changes. Generally, ascorbic acid
had positive effects on growth parameters by increasing
carbohydrates and content of macronutrients (N, P and K)
in plants (Aria et al., 2010; Mazher et al., 2011; and
Hafez et al., 2011).
Smirnoff and Wheeler (2000) reported that ascorbic
acid is an abundant component of plants. It reaches a
concentration of over 20 mm in chloroplasts and occurs
in all cell compartments including cell wall. It was
suggested that ascorbic acid functions in photosynthesis,
application of ascorbic acid significantly increased all
growth parameters.
3.8 Squash leaves contents of total chlorophyll,
carotenoids, proline and osmotic pressure
The effect of water levels (100%, 80% and 60% of
F.C.) and ascorbic acid (AsA) foliar spraying with
different concentrations (0, 50, 100 ppm) on Cucurbita
leaves contents of total chlorophyll, carotenoids, proline
and osmotic pressure is presented in Table 5.
3.9 Leaf total chlorophyll content (mg g-1 leaf F.W.)
Data in Table 5 recorded that, the content of leaf total
chlorophyll was decreased by the gradually increasing in
water levels in the two growing seasons. The highest
values were 1.64 and 1.61 mg g-1 with 100% F.C., and the
lowest values were 1.54 and 1.55 mg g-1 for 60% F.C.,
respectively in the two experimental seasons.
Also, the effect of AsA concentrations, it was
indicated that leaf total chlorophyll content increased
with AsA level being 1.55, 1.58 and 1.65 mg g-1 for AsA
0, 50 and 100 ppm, respectively in the first season. The
values in second season were 1.55, 1.57 and 1.61 mg g-1
for AsA 0, 50 and 100 ppm, respectively.
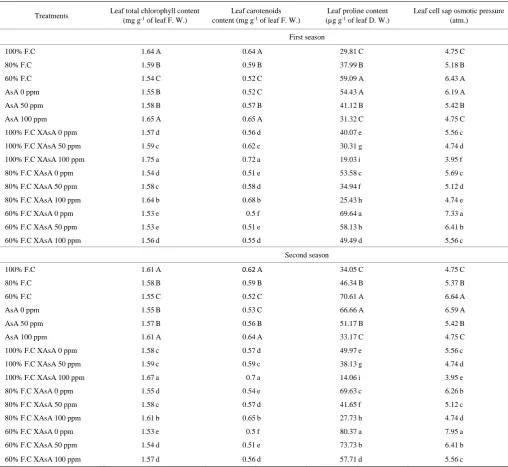
Table 5 Effect of water deficiency, ascorbic acid spraying and their interaction on leaf pigments and proline of squash plants (seasons 2015-2016)
Treatments Leaf total chlorophyll content (mg g-1 of leaf F. W.)
Leaf carotenoids content (mg g-1 of leaf F. W.)
Leaf proline content (µg g-1 of leaf D. W.)
Leaf cell sap osmotic pressure (atm.)
First season
100% F.C 1.64 A 0.64 A 29.81 C 4.75 C
80% F.C 1.59 B 0.59 B 37.99 B 5.18 B
60% F.C 1.54 C 0.52 C 59.09 A 6.43 A
AsA 0 ppm 1.55 B 0.52 C 54.43 A 6.19 A
AsA 50 ppm 1.58 B 0.57 B 41.12 B 5.42 B
AsA 100 ppm 1.65 A 0.65 A 31.32 C 4.75 C
100% F.C XAsA 0 ppm 1.57 d 0.56 d 40.07 e 5.56 c
100% F.C XAsA 50 ppm 1.59 c 0.62 c 30.31 g 4.74 d
100% F.C XAsA 100 ppm 1.75 a 0.72 a 19.03 i 3.95 f
80% F.C XAsA 0 ppm 1.54 d 0.51 e 53.58 c 5.69 c
80% F.C XAsA 50 ppm 1.58 c 0.58 d 34.94 f 5.12 d
80% F.C XAsA 100 ppm 1.64 b 0.68 b 25.43 h 4.74 e
60% F.C XAsA 0 ppm 1.53 e 0.5 f 69.64 a 7.33 a
60% F.C XAsA 50 ppm 1.53 e 0.51 e 58.13 b 6.41 b
60% F.C XAsA 100 ppm 1.56 d 0.55 d 49.49 d 5.56 c
Second season
100% F.C 1.61 A 0.62 A 34.05 C 4.75 C
80% F.C 1.58 B 0.59 B 46.34 B 5.37 B
60% F.C 1.55 C 0.52 C 70.61 A 6.64 A
AsA 0 ppm 1.55 B 0.53 C 66.66 A 6.59 A
AsA 50 ppm 1.57 B 0.56 B 51.17 B 5.42 B
AsA 100 ppm 1.61 A 0.64 A 33.17 C 4.75 C
100% F.C XAsA 0 ppm 1.58 c 0.57 d 49.97 e 5.56 c
100% F.C XAsA 50 ppm 1.59 c 0.59 c 38.13 g 4.74 d
100% F.C XAsA 100 ppm 1.67 a 0.7 a 14.06 i 3.95 e
80% F.C XAsA 0 ppm 1.55 d 0.54 e 69.63 c 6.26 b
80% F.C XAsA 50 ppm 1.58 c 0.57 d 41.65 f 5.12 c
80% F.C XAsA 100 ppm 1.61 b 0.65 b 27.73 h 4.74 d
60% F.C XAsA 0 ppm 1.53 e 0.5 f 80.37 a 7.95 a
60% F.C XAsA 50 ppm 1.54 d 0.51 e 73.73 b 6.41 b
60% F.C XAsA 100 ppm 1.57 d 0.56 d 57.71 d 5.56 c
The interaction between water deficiency levels and
ascorbic acid concentrations revealed highest values with
100% F.C × AsA 100 ppm being 1.75 and 1.67 mg g-1 in
hand, the lowest values came from the interaction 60%
F.C × AsA 0 ppm being 1.53 and 1.53 mg g-1 in the first
and the second seasons, respectively.
3.10 Leaf carotenoids content (mg g-1 leaf F.W.)
Data in Table 5 cleared significant differences
between water deficiency levels in both seasons. The
highest values were 0.64 and 0.62 mg g-1 with 100% F.C.,
and the lowest values were 0.52 and 0.52 mg g-1 for 60%
F.C., respectively in the two experimental seasons.
Regarding AsA concentrations effect, it was cleared
that leaf carotenoids contentincreased with increasing
AsA level being 0.52, 0.57 and 0.65 mg g-1 for AsA 0, 50
and 100 ppm, respectively, in the first season. The values
in second season were 0.53, 0.56 and 0.64 mg g-1 for AsA
0, 50 and 100 ppm, respectively.
The interaction between water deficiency levels and
ascorbic acid concentrations revealed highest values with
100% F.C × AsA 100 ppm being 0.72 and 0.70 mg g-1 in
the first and second seasons, respectively. On the other
hand, the lowest values came from the interaction 60%
F.C × AsA 0 ppm being 0.50 and 0.50 mg g-1 in the first
and the second seasons, respectively.
3.11 Leaf proline content (µg g-1 leaf D.W.)
From the given data in Table 5 it could be concluded
that, decreasing soil moisture level lead to increase of
proline metabolism, which is a typical mechanism of
biochemical adaptation subjected to stress condition. The
highest values were 59.09 and 70.61 µg g-1 with 60%
F.C., and the lowest values were 29.81 and 34.05 µg g-1
for 100% F.C., respectively in the two experimental
seasons.
As regards the effect of AsA concentrations, it was
obtained that proline decreased with the highest
concentration of AsA.
The interaction between water deficiency levels and
ascorbic acid concentrations revealed highest values with
60% F.C × AsA 0 ppm being 69.64 and 80.37 µg g-1 in
the first and second seasons, respectively. On the other
hand, the lowest values came from the interaction 100%
F.C × AsA 100ppm being 19.03 and 14.06 µg g-1 in the
first and the second seasons, respectively.
3.12 Leaf cell sap osmotic pressure (atm.)
The present data in Table 5 show that the osmotic
pressure of the cell sap exhibited a remarkable increase
with increasing the soil moisture stress. The highest
values were 6.43 and 6.64 atm., with 60% F.C. and the
lowest values were 4.75 and 4.75 atm., for 100% F.C.,
respectively in the two experimental seasons.
Regarding AsA concentrations effect, it was founded
that the osmotic pressure of the cell sap decreased with
AsA level being 6.19, 5.42 and 4.75 atm., for AsA 0, 50
and 100 ppm, respectively in the first season. The values
in second season were 6.59, 5.42 and 4.75 atm., for AsA
0, 50 and 100 ppm, respectively.
As for the interaction between different treatments,
the data of the interaction among the two studied factors
showed that the highest values with 60% F.C × AsA
0 ppm being 7.33 and 7.95 atm., in the first and second
seasons, respectively. On the other hand, the lowest
values came from the interaction 100% F.C × AsA
100 ppm being 3.95 and 3.95 atm., in the first and the
second seasons, respectively.
Hafez et al. (2011) shown that, AsA levels 200 and
400 ppm enhanced the production of proline than the
control at the end of the experiment. Level 400 ppm was
superior in increasing proline content.
Shun and Mohammed (2014) shown that, chlorophyll
and carotenoids decreased significantly with increasing
irrigation intervals to 14 and 21days, this reduction was
recovered by addition of 200 ppm AsA which caused
significant increase in chlorophyll and carotenoids
compared to their corresponding controls. On the other
hand, proline content was significantly increased by
increasing interval days of irrigation to 14 and 21 days
compared to control. Application of 200 ppm AsA caused
significant increase in proline content in plants irrigated
every 3 and 7 days compared to their corresponding
control.
3.13 Squash leaves water relation:
The effect of application water regimes deficiency
(100%, 80% and 60% of F.C.) and ascorbic acid (AsA)
foliar spraying with different concentrations (0, 50, 100
ppm) on Cucurbita leaves water relation is presented in
Table 6.
3.14 Leaf free water content (%)
between water deficiency levels in both seasons. The
highest values were 68.18% and 65.07% with 100% F.C.,
and the lowest values were 56.94% and 52.97% for 60%
F.C., respectively in the two experimental seasons.
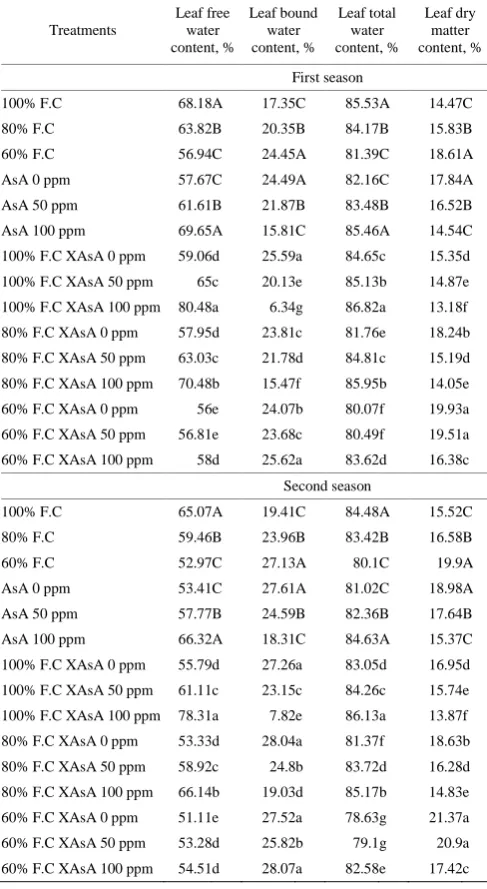
Table 6 Effect of water deficiency, ascorbic acid spraying and their interaction on leaf water, leaf dry matter content and leaf cell
sap osmotic pressure of squash plants (seasons, 2015-2016)
Treatments
Leaf free water content, %
Leaf bound water content, %
Leaf total water content, %
Leaf dry matter content, % First season
100% F.C 68.18 A 17.35 C 85.53 A 14.47 C
80% F.C 63.82 B 20.35 B 84.17 B 15.83 B
60% F.C 56.94 C 24.45 A 81.39 C 18.61 A
AsA 0 ppm 57.67 C 24.49 A 82.16 C 17.84 A
AsA 50 ppm 61.61 B 21.87 B 83.48 B 16.52 B
AsA 100 ppm 69.65 A 15.81 C 85.46 A 14.54 C
100% F.C XAsA 0 ppm 59.06 d 25.59 a 84.65 c 15.35 d 100% F.C XAsA 50 ppm 65 c 20.13 e 85.13 b 14.87 e 100% F.C XAsA 100 ppm 80.48 a 6.34 g 86.82 a 13.18 f 80% F.C XAsA 0 ppm 57.95 d 23.81 c 81.76 e 18.24 b 80% F.C XAsA 50 ppm 63.03 c 21.78 d 84.81 c 15.19 d 80% F.C XAsA 100 ppm 70.48 b 15.47 f 85.95 b 14.05 e 60% F.C XAsA 0 ppm 56 e 24.07 b 80.07 f 19.93 a 60% F.C XAsA 50 ppm 56.81 e 23.68 c 80.49 f 19.51 a 60% F.C XAsA 100 ppm 58 d 25.62 a 83.62 d 16.38 c
Second season
100% F.C 65.07 A 19.41 C 84.48 A 15.52 C
80% F.C 59.46 B 23.96 B 83.42 B 16.58 B
60% F.C 52.97 C 27.13 A 80.1 C 19.9 A
AsA 0 ppm 53.41 C 27.61 A 81.02 C 18.98 A
AsA 50 ppm 57.77 B 24.59 B 82.36 B 17.64 B
AsA 100 ppm 66.32 A 18.31 C 84.63 A 15.37 C
100% F.C XAsA 0 ppm 55.79 d 27.26 a 83.05 d 16.95 d 100% F.C XAsA 50 ppm 61.11 c 23.15 c 84.26 c 15.74 e 100% F.C XAsA 100 ppm 78.31 a 7.82 e 86.13 a 13.87 f 80% F.C XAsA 0 ppm 53.33 d 28.04 a 81.37 f 18.63 b 80% F.C XAsA 50 ppm 58.92 c 24.8 b 83.72 d 16.28 d 80% F.C XAsA 100 ppm 66.14 b 19.03 d 85.17 b 14.83 e 60% F.C XAsA 0 ppm 51.11 e 27.52 a 78.63 g 21.37 a 60% F.C XAsA 50 ppm 53.28 d 25.82 b 79.1 g 20.9 a 60% F.C XAsA 100 ppm 54.51 d 28.07 a 82.58 e 17.42 c
Regarding AsA concentrations effect, it was indicated
that leaf free water content increased with AsA level
being 57.67%, 61.61% and 69.65% for AsA 0, 50 and
100 ppm, respectively in the first season. The values in
second season were 53.41%, 57.77% and 66.32% for
AsA 0, 50 and 100 ppm, respectively.
As for the interaction between water deficiency levels
and ascorbic acid concentrations revealed highest values
with 100% F.C × AsA 100 ppm being 80.48% and
78.31% in the first and second seasons, respectively. On
the other hand, the lowest values came from the
interaction 60% F.C × AsA 0 ppm being 56.00% and
51.11% in the first and the second seasons, respectively.
3.15 Leaf bound water content (%)
From the given data in Table 6 it could be concluded
that decreasing soil moisture level led to increase of leaf
bound water content. The highest values were 24.45%
and 27.13% with 60% F.C., and the lowest values were
17.35% and 19.41% for 100% F.C., respectively in the
two experimental seasons.
As regards the effect of AsA concentrations, it was
obtained that, leaf bound water content decreased with
the highest concentration of AsA.
The interaction between water deficiency levels and
ascorbic acid concentrations revealed highest values with
100% F.C × AsA 0 ppm being 25.59% and 27.26% in the
first and second seasons, respectively. On the other hand,
the lowest values came from the interaction 100% F.C ×
AsA 100 ppm being 6.34% and 7.82% in the first and the
second seasons, respectively.
3.16 Leaf total water content (%)
Examination of Table 6 revealed that, the water
content of irrigated plants with 60% of F.C., was the
lowest in the two seasons (81.39% and 80.10% for 60%
F.C.) in comparison with the control (irrigation with
100% of F.C.).
With regard to the effect of spraying with ascorbic
acid, data indicate that AsA level of 100 ppm
significantly increased water content in the two seasons
comparing with control.
As for the interaction affect, Table 6 revealed that the
highest values with 100% F.C × AsA 100 ppm being
86.82% and 86.13% in the first and second seasons,
respectively. On the other hand, the lowest values came
from the interaction 60% F.C × AsA 0 ppm being 80.07%
and 78.63% in the first and the second seasons, respectively.
3.17 Leaf dry matter content (%)
Data in Table 6 cleared significant differences
between water deficiency levels in both seasons. The
highest values were 18.61 and 19.90% with 100% F.C.,
and the lowest values were 14.47% and 15.52% for 60%
F.C., respectively in the two experimental seasons.
Regarding AsA concentrations effect, it was cleared
being 17.84%, 16.52% and 14.54% for AsA 0, 50 and
100 ppm, respectively in the first season. The values in
second season were 18.98%, 17.64% and 15.37% for
AsA 0, 50 and 100 ppm, respectively.
The interaction between water deficiency levels and
ascorbic acid concentrations revealed highest values with
60% F.C × AsA 0 ppm being 19.93% and 21.37% in the
first and second seasons, respectively. On the other hand,
the lowest values came from the interaction 100% F.C ×
AsA 100 ppm being 13.18% and 13.87% in the first and
the second seasons, respectively.
The collected data in the present investigation show
that the decrease of soil moisture caused a decrease in
leaf free water and leaf total water content and increase in
leaf bound water and leaf dry matter. Similar results were
reported by several investigators. Ali et al. (1999)
indicated that soil drying decreased leaf growth, thereby
reducing leaf water status in addition to accumulation of
organic solutes to osmotic adjustment which in turn
inhibited the incorporation of small substrate molecules
into the polymers needed to grow new cells. In the same
connection Abdel-Mawgoud et al. (2005) on green bean
also reported that increased irrigation rate increases water
availability in the root zone resulting in improving plant
water status and better stomatal conductance which
eventually reflects on photo- assimilates production.
Youssef (2013) on gladiolus plants reported that
decreasing water levels caused decreasing leaves water
content.
Zhwan and Mohammed (2014) found that water
deficiency levels for 14, 21 days interval were
significantly decrease leaves water content. The AsA
application could alleviate the harm effect of drought
through enhancement plant water content.
3.18 Squash yield and fruit characteristics
The effect of application water regimes deficiency
(100%, 80% and 60% of F.C.) and ascorbic acid (AsA)
foliar spraying with different concentrations (0, 50,
100 ppm) on Cucurbita yield and fruit quality is presented
in Table 7.
3.19 Total yield (ton fed-1)
It is clear from Table 7 that, the total yield significant
increased with increasing water supply. The highest
values were 11. 62 and 10.84 ton fed-1., with 100% F.C.,
and the lowest values were 6. 68 and 5.69 ton fed-1., for
60% F.C., respectively in the two experimental seasons.
Regarding AsA concentrations effect, it was cleared
that total yield increased with AsA level being 7.27, 9.57
and 11.59 ton fed-1, for AsA 0, 50 and 100 ppm,
respectively, in the first season. The values in second
season were 6.52, 8.85 and 10.65 ton fed-1., for AsA 0, 50
and 100 ppm, respectively.
The interaction between water deficiency levels
and ascorbic acid concentrations revealed highest
values with 100% F.C × AsA 100 ppm being 14.31
and 12.66 ton fed-1., in the first and second seasons,
respectively. On the other hand, the lowest values
came from the interaction 60% F.C×AsA 0 ppm
being 5.36 and 3.86 ton fed-1 in the first and the
second seasons, respectively.
3.20 Fruit weight (g)
Data in Table 7 indicated that significant differences
between water deficiency levels in both seasons. The
highest values were 129.74 and 128.73 g with 100% F.C.,
and the lowest values were 77.98 and 70.24 g for 60%
F.C., respectively in the two experimental seasons.
As regarding AsA concentrations effect, it was
cleared that fruit weight increased with AsA level being
92.48, 98.83 and 127.91 g for AsA 0, 50 and 100 ppm,
respectively in the first season. The values in second
season were 87.07, 98.66 and 117.88 g for AsA 0, 50 and
100 ppm, respectively.
The interaction between water deficiency levels and
ascorbic acid concentrations revealed highest values with
100% F.C × AsA 100 ppm being 148.05 and 140.61 g in
the first and second seasons, respectively. On the other
hand, the lowest values came from the interaction 60%
F.C × AsA 0 ppm being 57.75 and 52.00 g in the first and
the second seasons, respectively.
3.21 Fruit length (cm)
Data in Table 7 cleared significant differences
between water deficiency levels in both seasons. The
highest values were 13.99 and 14.23 cm with 100% F.C.,
and the lowest values were 12.04 and 11.64 cm for 60%
F.C., respectively in the two experimental seasons.
that fruit length increased with AsA level being 12.38,
13.21 and 14.06 cm for AsA 0, 50 and 100 ppm,
respectively in the first season. The values in second
season were 12.16, 12.88 and 14.26 cm for AsA 0, 50 and
100 ppm, respectively.
The interaction between levels of water deficiency
and ascorbic acid concentrations revealed highest values
with 100% F.C × AsA 100 ppm being 14.60 and
15.67 cm in the first and second seasons, respectively. On
the other hand, the lowest values came from the
interaction 60% F.C × AsA 0 ppm being 11.07 and
10.77 cm in the first and the second seasons, respectively.
Table 7 Effect of water deficiency, ascorbic acid spraying and their interaction on total yield, fruit weight, fruit length, fruit diameter and fruit TSS of squash plants (seasons 2015-2016)
Treatments
Total yield, ton fed-1 Fruit weight, g Fruit length, cm Fruit diameter, cm Fruit Tss, %
First season
100% F.C 11.62 A 129.74 A 13.99 A 3.38 A 4.33 C
80% F.C 10.13 B 111.50 B 13.61 A 2.99 A 5.06 B
60% F.C 6.68 C 77.98 C 12.04 B 2.49 A 6.17 A
AsA 0 ppm 7.27 C 92.48 C 12.38 C 2.79 B 5.89 A
AsA 50 ppm 9.57 B 98.83 B 13.21 B 2.77 B 5.39 B
AsA 100 ppm 11.59 A 127.91 A 14.06 A 3.28 A 4.28 C
100% F.C XAsA 0 ppm 9.08 c 129.16 c 13.40 b 3.57 a 5.00 d
100% F.C XAsA 50 ppm 11.47 b 112.00 d 13.97 b 2.92 a 5.00 d
100% F.C XAsA 100 ppm 14.31 a 148.05 a 14.60 a 3.63 a 3.00 f
80% F.C XAsA 0 ppm 7.36 e 90.53 e 12.67 c 2.71 a 6.00 b
80% F.C XAsA 50 ppm 10.75 c 105.94 d 13.67 b 2.85 a 5.00 d
80% F.C XAsA 100 ppm 12.28 b 138.04 b 14.50 a 3.42 a 4.17 e
60% F.C XAsA 0 ppm 5.36 g 57.75 g 11.07 d 2.12 a 6.67 a
60% F.C XAsA 50 ppm 6.50 f 78.55 f 12.00 c 2.55 a 6.17 b
60% F.C XAsA 100 ppm 8.18 d 97.65 e 13.07 b 2.79 a 5.67 c
Second season
100% F.C 10.84 A 128.73 A 14.23 A 3.30 A 4.67 C
80% F.C 9.50 B 104.65 B 13.41 B 2.87 B 5.17 B
60% F.C 5.69 C 70.24 C 11.64 C 2.35 B 6.50 A
AsA 0 ppm 6.52 C 87.07 C 12.16 B 2.69 B 6.11 A
AsA 50 ppm 8.85 B 98.66 B 12.88 B 2.84 B 5.50 B
AsA 100 ppm 10.65 A 117.88 A 14.26 A 2.98 A 4.72 C
100% F.C XAsA 0 ppm 8.63 c 125.10 b 13.27 b 3.50 a 5.33 d
100% F.C XAsA 50 ppm 11.23 b 120.49 c 13.77 b 3.20 a 5.00 e
100% F.C XAsA 100 ppm 12.66 a 140.61 a 15.67 a 3.14 a 3.67 g
80% F.C XAsA 0 ppm 7.06 d 84.12 e 12.43 c 2.59 a 6.00 c
80% F.C XAsA 50 ppm 9.65 c 109.57 d 13.53 b 2.98 a 5.00 e
80% F.C XAsA 100 ppm 11.78 b 120.25 c 14.27 a 3.04 a 4.50 f
60% F.C XAsA 0 ppm 3.86 f 52.00 g 10.77 d 2.00 a 7.00 a
60% F.C XAsA 50 ppm 5.68 e 65.94 f 11.33 c 2.33 a 6.50 b
60% F.C XAsA 100 ppm 7.52 d 92.78 e 12.83 c 2.72 a 6.00 c
3.22 Fruit diameter (cm)
Data in Table 7 showed that significant differences
between the levels of water deficiency in both seasons.
The highest values were 3.38 and 3.30 cm with 100%
F.C., and the lowest values were 2.49 and 2.35 cm for
60% F.C., respectively in the two experimental seasons.
Regarding AsA concentrations effect, it was cleared
that fruit diameter increased with AsA level being 2.79,
2.77 and 3.28 cm for AsA 0, 50 and 100 ppm,
respectively in the first season. The values in second
season were 2.69, 2.84 and 2.98 cm for AsA 0, 50 and
100 ppm, respectively.
The interaction between levels of water deficiency
and ascorbic acid concentrations were insignificant.
3.23 Fruit Tss (%)
Data in Table 7 founded that significant differences
between the water deficiency levels in both seasons. The
the lowest values were 4.33% and 4.67% for 100% F.C.,
respectively in the two experimental seasons.
Regarding AsA concentrations effect, it was cleared
that fruit Tss decreased with AsA level being 5.89%,
5.39% and 4.28% for AsA 0, 50 and 100 ppm,
respectively in the first season. The values in second
season were 6.11%, 5.50% and 4.72% for AsA 0, 50 and
100 ppm, respectively.
The interaction between water deficiency levels and
ascorbic acid concentrations revealed highest values with
60% F.C × AsA 0 ppm being 6.67% and 7.00% in the
first and second seasons, respectively. On the other hand,
the lowest values came from the interaction 100% F.C ×
AsA 100 ppm being 3.00% and 3.67% in the first and the
second seasons, respectively.
Maksoud et al. (2009) on olive trees stated that
ascorbic acid as antioxidants appears to be a powerful
tool for improving yield, fruit weight of olive trees
(Chemlali cv.) planted in calcareous soil.
Ibrahim and Selim (2010) show that decreasing
irrigation intervals caused significant increases in total
fruit yield and marketable yield in the two summer
seasons. Bakry et al. (2013) and Rizwan et al. (2011)
were reported same results about increasing of yield by
ascorbic acid application. Zhwan and Mohammed (2014)
found that the combination between irrigation interval
with 200 ppm AsA increased yield of wheat. These
results are in harmony with those results obtained by
Metwally (2011), Alahdadi et al. (2011), Kassab et al.
(2012) and Ebrahimet al. (2014).
4 Conclusion
The above-mentioned results indicated that water
stress by decreasing the amount of added water adversely
affected growth parameters and yield of plants. On
reverse, ascorbic acid application via leaves was
beneficially affected plant growth and yield. Therefore, it
could be concluded that, spraying and used the vitamin c
enhancing the drought tolerance of squash plants under
water stress conditions.
References
Abdel-Aziz, G., A. Nahed, S. T. Lobna and M. M. S. Ibrahim. 2009. Some studies on the effect of putrescine, ascorbic acid and
thiamine on growth, flowering and some chemical constituents of Gladiolus plants at Nubaria. Ozean Journal Applied Science, 2(2): 169–179.
Abdel-Mawgoud, A. M. R., M. El-Desuki, S. R. Salman, and S. D. Abou- Hussein. 2005. Performance of some snap bean varieties as affected by different levels of mineral fertilizers.
Journal Agronomy, 4(3): 242–247.
Ahmet, E., S. Suat, K. Cenk, and G. Ibrahim. 2004. Irrigation frequency and amount affect yield components of summer squash (Cucurbitapepo L.). Agriculture Water Management, 67(1): 63–76.
Alahdadi, I., H. Oraki, and F. P. Khajani. 2011. Effect of water stress on yield and yield components of sunflower hybrids.
African Journal of Biotechnology, 10(34): 6504–6509. Ali, M., C. R. Jensen, V. O. Mogensen, M. N. Andersen, and I. E.
Henson. 1999. Root signalling and osmotic adjustment during intermittent soil drying sustain grain yield of field grown wheat. Field Crops Research, 62(1): 35–52.
Aria, D., S. A. M. M. Sanavy, and K. S. Asilan. 2010. Effect of ascorbic acid foliar application on yield, yield component and several morphological traits of grain corn under water deficit stress conditions. Notulae Scientia Biologicae, 2(3): 45–50. Arnon, D. I. 1949. Copper enzymes in isolated chloroplasts.
Polyphenol-oxidase in Beta Vulgaris. Plant Physiology, 24(1): 1–5.
Bakry, B. A., T. A. Elewa, M. F. El- Kramany, and A. M. Wali. 2013. Effect of humic and ascorbic acids foliar application on yield and yield components of two wheat cultivars grown under newly reclaimed sandy soil. International Journal of Agronomy and Plant Production, 4(6): 1125–1133.
Bates, L. S., R. R. Walren, and I. D. Tears. 1973. Rapid determination of proline for water stress studies. Plant and Soil, 39(1): 205–207.
Bremner, P. M., and M. A. Taha. 1966. Studies in potato agronomy 1- the effects of variety, seed size and spacing on growth, development and yield. Journal Agriculture Scince, 66(2): 241–252.
Ebrahim, A., H. R. Bozorgi, and M. Moraditochaee. 2014. Effects of ascorbic acid foliar spraying and nitrogen fertilizer management in spring cultivation of quinoa (chenopodium quinoa) in north of Iran. Biological Forum – An International Journal, 6(2): 254–260.
Food and Agriculture Organization of the United Nations (FAO). FAOSTAT 2012. Rome: FAO. Available from: http://faostat3.fao.org/faostat-gateway/go/to/home/E Gosov, N. A. 1960. Some Methods in Studying Plant Water
Relations. USSR: Leningrad. Acad. of Science.
7(11): 1492–1500.
Ibrahim, E. A., and E. M. Selim. 2010. Effect of irrigation intervals and Antitranspirant (kaolin) on summer squash (Cucurbitapepo L.) Growth, yield, quality and Economics.
Journal Soil Scince and Agriculture Engineering, Mansoura University, 1 (8): 883–894.
Kassab, O. M., A. A. A. Ellil, and M. S. A. A. El-Kheir. 2012. Water use efficiency and productivity of two sunflower cultivars as influenced by three rates of drip irrigation water.
Journal of Applied Sciences Research, 8(7): 3524–3529. Kramer, P. J., and J. S. Boyer. 1995. Water relations of plants and
soils. New York: Academic Press.
Maksoud, M. A., M. A. Saleh, M. S. El-Shamma. and A. A. Fouad. 2009. The beneficial effect of biofertilizers and antioxidants on olive trees under calcareous soil conditions. World Journal of Agricultural Sciences, 5(3): 350–352.
Masoud, A. A. B., and O. A. M. El-Sahrawy. 2012. Effect of some vitamins and salicylic acid on fruiting of Washington navel orange trees. Journal of Applied Sciences Research, 8(4): 1936–1943.
Mazher, A. A. M., S. M. Zaghloul, S. A. Mahmoud, and H. S. Siam. 2011. Stimulatory effect of kinetin, ascorbic acid and glutamic acid on growth and chemical constituents of Codiaeum variegatum L. plants. American-Eurasian Journal of Agriculture & Environmental Science, 10(3): 318–323. Metwally, A. K. 2011. Effect of water supply on vegetative growth
and yield characteristics in onion (Allium cepa L.). Australian Journal of Basic and Applied Sciences, 5(12): 3016–3023. Rizwan, S. T., A. Rasheed, and M. U. Hayyat. 2011. Alleviation of
the adverse effects of salt stress on growth and yield of rice plants by application of ascorbic acid as foliar spray. Biologia,
57(1and 2): 33–40.
Smirnoff, N., and G. L. Wheeler. 2000. Ascorbic acid in plant.
Plant Sciences, 19 (4): 267–290.
Snedecor, G. W., and W. G. Corchran. 1980. Statistical methods,
7th Ed. Lowa, USA: Lowa State Univ., Press.
Tartoura, E. A. A., E. I. El-Gamily, Y. B. A. El -Waraky, and M. K. Y. Kamel. 2014. Effect of phosphorus fertilization and fruit thinning on seed production of summer squash plants. Journal Plant Production, Mansoura University, 5(11): 1807–1816. Uday, B., M. D. Bohra, L. N. Harsh, J. C. Tiwari, and U. Burman.
2001. Water relation and growth of Simmondsia chinensis and
Prosopis juliflora seedlings at nursery stage. Indian Forester, 127(3): 351–357.
Youssef, E. A. 2013. Response of gladiolus plants to water regimes and improving quality agents under different irrigation systems in newly reclaimed soil. Ph.D. diss., Faculty Agriculture Zagazig University., Egypt.