Key Technology of Electronic Nose Gas Recognizer Based
on Wireless Sensor Networks
https://doi.org/10.3991/ijoe.v14i10.9304
Mei Hong
Changchun University, Changchun, China
Abstract—Electronic nose gas recognizer is a kind of instrument simulating biological olfactory function for gas detection, which is widely applied in un-derground construction, aerospace, medical treatment and other fields. The sensing mechanism of the wireless sensor is complex. The wireless sensor array can realize the cross-response of the mixed gas, as well as data acquisition, pro-cessing and transmission by wireless transmission. This study applies the wire-less sensor array to the electronic nose gas recognition technology, and con-ducts detection and recognition of three kinds of volatile gas, as well as analyz-es the transient ranalyz-esponse of four wirelanalyz-ess sensors and the transient ranalyz-esponse of wireless sensor array. It is found that the transient response curves are related to the characteristics and sample properties of wireless sensors, but not directly re-lated to sample components. The whole transient response process includes four processes, namely steady state, rising process, maximum response and falling process. The response curve change of wireless sensor array to engine oil vola-tile gas is similar to that of diesel oil, but the conductance value is smaller than that of diesel oil gas response curve.
Keywords—Electronic Nose Gas Recognizer, Wireless Sensor, Transient Re-sponse.
1
Introduction
pre-processing and pattern recognition systems, so the system is more sensitive than hu-man’s bio-olfactory system [6-7].
In recent years, with the rapid development of underground construction, manned spaceflight and deep sea exploration engineering, higher and higher requirements have been raised on the safety of non-open space equipment systems [8]. According to incomplete statistics, the explosion caused by flammable and explosive gas leakage is the fourth most serious threat to personal property and system safety [9]. At pre-sent, the researches on electronic nose gas recognition system at home and abroad generally includes sensor array technology, sensor array signal pre-processing and feature extraction technology, and signal pattern recognition technology, and the re-search level is shallow [10-11]. The wireless sensor network is a distributed network which realizes data acquisition, processing and transmission functions through wire-less communication and wirewire-less transmission. The application of the wirewire-less sensor network to electronic nose gas recognition will greatly improve its transmission rate and data acquisition capability. The network is featured with fast response, good re-versibility and repeatability, and high sensitivity [12]. There are four types of com-monly used wireless sensors: resistor type, mass type, optical type and capacitance-charge coupling type [13]. This study applies the wireless sensor array to the electron-ic nose gas recognition technology, and conducts detection and recognition of three kinds of volatile gas, as well as analyzes the transient response of four wireless sen-sors and the transient response of wireless sensor array.
2
Dynamic Modeling of Wireless Sensor Response and Analysis
of Transient Response Signal
2.1 Dynamic analysis of wireless sensor response
Based on the sensitivity of electronic nose gas recognition, the transient response information model of wireless sensor is established, and the gas eigenvalue and mixed gas are identified to realize the qualitative and quantitative analysis of gas [14]. The gas sensing mechanism based on wireless gas sensor involves many theories such as material surface morphology, gas sensing material microstructure and gas response dynamics [15-16]. The wireless sensor for gas recognition detects gas by the change in the resistance value of the gas after reaction on the surface of the semiconductor thin film. When the semiconductor thin film contacts a certain molecule, an electron depletion layer is generated on the surface of the material, increasing the resistance [17-18]. A wireless sensor array is essentially different from a single wireless sensor array in operating characteristics. The response of a single wireless sensor to gas is expressed by intensity value while the wireless sensor array can realize a response pattern to types and concentrations of gas. Taking the oxygen ionization model as an example, a reaction will occur as shown in Formula 1:
O2gas+2e↔2O- (1)
![#$]
!& =k1PO2[e]S2-k-1(O-)
2
-kreactA PA(O-) (2)
Where, k1 and k-1 are the rate constants of adsorption and desorption of oxygen ion
respectively, which reflect the corresponding excitation energy.
When the wireless sensor contacts with oxygen molecules, the gas pressure PA on
the film surface suddenly increases. If the initial value is far from the final state, then:
x=c3+c2+exp(2c2c2
1c2t)-1 (3)
Where, c1, c2 and c3 are all chemical constant parameters.
2.2 Transient response signal expression and analysis of wireless sensor array
The relative conductance of the wireless sensor is y=G/G0, where G and G0 are
re-spectively the conductance when the wireless sensor is in contact with the gas to be measured and in the initial state, that is:
y(t)= exp(2c1c2t)-1
(c3+c2)[exp(2c1c2t)]+c2-c3 (4)
The steady-state value of relative conductance during the transient response of the wireless sensor is:
lim
t→∞y(t)= limt→∞
exp(2c1c2t)-1 (c3+c2)[exp(2c1c2t)]+c2-c3=
1
c3+c2 (5)
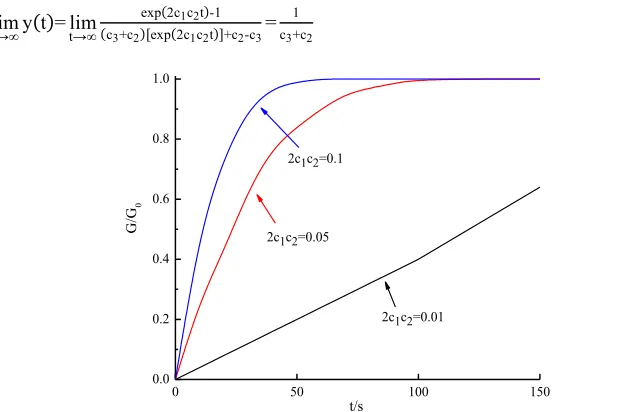
Fig. 1. Wireless sensor transient response simulation value with constant gas concentration
Figure 1 is the simulation value of the transient response of the wireless sensor when the input gas concentration is constant. It is obvious that the response value of the wireless sensor increases rapidly first, then tends to be flat, and finally reaches the
0 50 100 150
0.0 0.2 0.4 0.6 0.8 1.0
2c1c2=0.1
2c1c2=0.05
2c1c2=0.01
G
/G0
steady-state value when 2c1c2≥0.05; the response value of the wireless sensor always
increases when 2c1c2=0.01.
3
Design of Electronic Nose System
3.1 Hardware design of electronic nose system
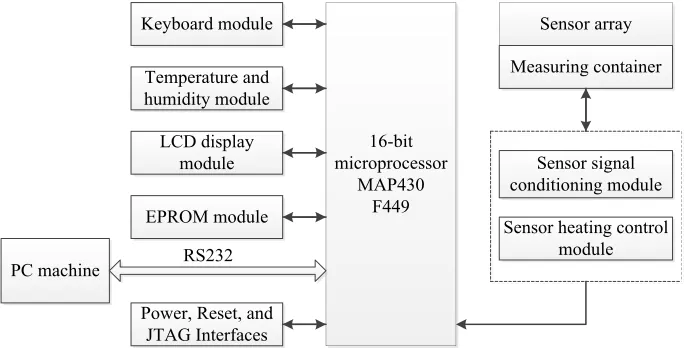
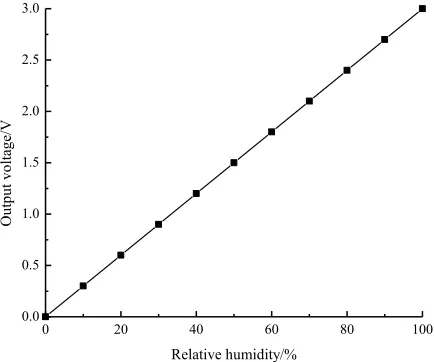
The hardware of the electronic nose system includes keyboard module, tempera-ture and humidity module, wireless sensor array module, wireless sensor signal condi-tioning module and LCD display module. The hardware system is shown in Figure 2. The measuring circuit of temperature and humidity adopts CHTM-02/A type tempera-ture and humidity sensor module. Figure 3 is the curve of output voltage and relative humidity. It can be seen that the output voltage is positively linear with relative hu-midity, and the corresponding output voltage is 0-3V when the relative humidity is between 0% and 100%. There are different wireless sensor types for different kinds of sensitive gas. The commonly used sensor types are: TGS813 of CH4 and MQ-7 of
CO. Taking the TGS813 sensor of CH4as an example, the temperature and humidity
response curve of the wireless sensor is shown in Figure 4, where Rs represents the resistance value under 1000 ppm CH4 and various temperatures and humidity, and Ro
represents the resistance value under 1000 ppm CH4 and 20 ℃/65% RH. The signal
conditioning circuit design of wireless sensor should consider the accuracy of output voltage signal and quantization accuracy, and the measurement sensitivity must be maximized when the wireless sensor reaches the transient state.
Fig. 2. Electronic nose system hardware block diagram PC machine
Keyboard module
Temperature and humidity module
LCD display module
EPROM module
Power, Reset, and JTAG Interfaces
16-bit microprocessor
MAP430 F449
Sensor array
Measuring container
Sensor signal conditioning module
Fig. 3. Output voltage-relative humidity curve
Fig. 4. Temperature and humidity response curve
3.2 Software design of electronic nose system
Figure 5 is a block diagram of the electronic nose system software. The whole software design module includes two parts: the design of serial port communication of PC and SCM. The design of PC serial port communication includes measurement interface and data acquisition interface. The SCM serial port communication mainly includes key processing: data transmission, serial port setting, ADC12 conversion and LCD display. The register types related to the ADC12 include conversion control register, interrupt control register, memory register, and memory control register. In the design process of software system, Matlab and C++ programming environment
0 20 40 60 80 100
0.0 0.5 1.0 1.5 2.0 2.5 3.0
O
utp
ut v
olta
ge
/V
Relative humidity/%
-10 -5 0 5 10 15 20 25 30 35 40 45
0.8 1.0 1.2 1.4 1.6 1.8 2.0
100%65% 40% 20% 0%
Sen
so
r r
esi
stan
ce r
at
io
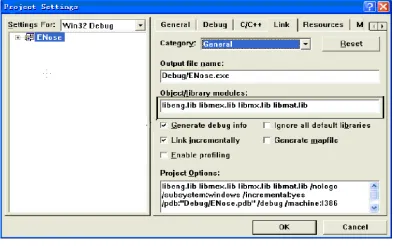
are used to realize the science and technology, visualization, storage, openness and expansibility of data. Figure 6 shows Include files path configuration of the edited software system and Figure 7 is the static link library configuration of the system. In addition, the interface design of the software includes the system main interface de-sign, the modal dialog box dede-sign, the startup screen dede-sign, and design of other sub-systems.
Fig. 5. Electronic nose system software block diagram
Fig. 6. Include files path configuration
Fig. 7. Static link library configuration Matlab-Engine
Fast training of wireless sensor
networks
Measurement interface
Data acquisition
interface
PC serial communication
Microcontroller serial communication
Key processing
Write E2PROM
Data transmission
Set the serial port
ADC12 conversion
LCD display
4
Experiment and Result Analysis
4.1 Preparation of experimental samples
This test selects a portable electronic nose with wireless sensor array, sampling and cleaning channels and data acquisition system, which is highly sensitive and is quick and convenient to test. According to previous studies, the higher the concentration of the gas to be measured, the more the response value G/G0 deviates from 1. If the
con-centration is lower than the limit of detection (LOD) or there is no response gas, the response value G/G0 is close to or equal to 1. In the gas environment set in this test,
the gas to be measured is charged into the sampling bottle, and the data is collected and transmitted to the computer through the electronic nose gas recognition system with wireless sensor array. The four different sensors have different sensitivity and have very good sensitivity to aromatic compounds, nitrogen oxides, ammonia and hydrogen. The minimum detection volume fraction is 1 ml/m3. Oil gas from diesel oil, lubricating oil and engine oil is taken as the research object. Diesel oil, lubricating oil and engine oil have different oil components, and the density, color and volatile gas components of oil are different. Therefore, it is far more difficult to recognize and detect the volatility of two kinds of oil gas than that of single component gas. The electronic nose gas recognition response of the wireless sensor array is not only relat-ed to the quality of the detection gas, but also relatrelat-ed to the temperature, state and environment of the experimental gas. The more components the oil sample contains, the higher the temperature is, and the greater the volatile concentration is. In order to ensure the stability and accuracy of the measurement data of the electronic nose gas recognition system of the wireless sensor array and to eliminate the accumulation effect, the wireless sensor array should be cleaned and standardized before and after each experimental measurement.
4.2 Gas quantitative analysis based on wireless sensor network
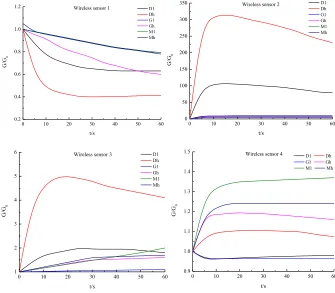
To shorten the sensitive time of the wireless sensor, the sampling time is 60s, and the four distinct response stages are not shown in Figure 8. The four sensors all re-spond to the three kinds of volatile gas, indicating that the wireless sensor array is cross-sensitive, and the wireless sensor array should be used for testing in complex gas environments instead of a single sensor. Among the four wireless sensors, the response value of the wireless sensor 2 is much larger than that of the other three wireless sensors, and the wireless sensor 1 is sensitive to aromatic compounds.
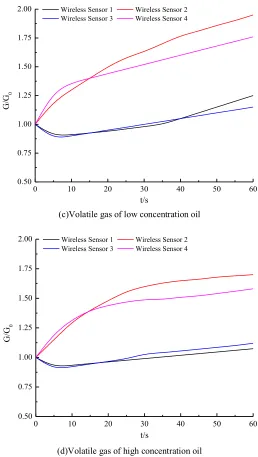
Figure 9 shows the transient response curve of the wireless sensor array to diesel oil and engine oil volatile gas with low/high concentration, as shown in Figures 9 (a)-9 (d). It can be seen that before the wireless sensor 2 and the wireless sensor 4 are in contact with the gas, the relative conductance value G/G0 increases rapidly, and
be-gins to decrease after reaching the maximum value, and the rate of decrease is less than that of increase. The response curve change of wireless sensor array to engine oil volatile gas is similar to that of diesel oil, but the conductance value is smaller than that of diesel oil gas response curve.
Fig. 8. Figure 8 Transient response curves of four wireless sensors to different volatile oil vapour
0 10 20 30 40 50 60
0.2 0.4 0.6 0.8 1.0
1.2 Wireless sensor 1
G /G0 t/s D1 Dh G1 Gh M1 Mh
0 10 20 30 40 50 60
0 50 100 150 200 250 300
350 Wireless sensor 2
G /G0 t/s D1 Dh G1 Gh M1 Mh
0 10 20 30 40 50 60
1 2 3 4 5
6 Wireless sensor 3
G /G0 t/s D1 Dh G1 Gh M1 Mh
0 10 20 30 40 50 60
0.9 1.0 1.1 1.2 1.3 1.4
1.5 Wireless sensor 4
G
/G0
t/s
D1 Dh
G1 Gh
(a)Volatile gas of low concentration diesel oil
(b)Volatile gas of high concentration diesel oil
0 10 20 30 40 50 60
0.6 0.8 1.0 1.2 1.4 1.6 1.8 2.0 2.2
G
/G0
t/s
Wireless Sensor 1 Wireless Sensor 2 Wireless Sensor 3 Wireless Sensor 4
0 10 20 30 40 50 60
0 1 2 3 4 5 6 7
G
/G0
t/s
(c)Volatile gas of low concentration oil
(d)Volatile gas of high concentration oil
Fig. 9. Transient response curve of wireless sensor array to volatile gases in diesel and oil
5
Conclusions
This study applies the wireless sensor array to the electronic nose gas recognition technology, and conducts detection and recognition of three kinds of volatile gas, as
0 10 20 30 40 50 60
0.50 0.75 1.00 1.25 1.50 1.75 2.00
G
/G0
t/s
Wireless Sensor 1 Wireless Sensor 2 Wireless Sensor 3 Wireless Sensor 4
0 10 20 30 40 50 60
0.50 0.75 1.00 1.25 1.50 1.75 2.00
G
/G0
t/s
well as analyzes the transient response of four wireless sensors and the transient re-sponse of wireless sensor array. The specific conclusions are as follows:
1.The hardware of the electronic nose system includes keyboard module, tempera-ture and humidity module, wireless sensor array module, wireless sensor signal conditioning module and LCD display module. The software design module in-cludes two parts: the design of serial port communication of PC and SCM.
2.The response rate and completeness of the wireless sensor to the measured gas are different, resulting in different response modes. The whole transient response pro-cess includes steady state, rising propro-cess, maximum response and falling propro-cess. The response value of the wireless sensor 2 is much larger than that of the other three wireless sensors.
3.The response curve change of wireless sensor array to engine oil volatile gas is similar to that of diesel oil, but the conductance value is smaller than that of diesel oil gas response curve. Before the wireless sensor is in contact with the gas, the relative conductance value G/G0 increases rapidly, and begins to decrease after
reaching the maximum value, and the rate of decrease is less than that of increase.
6
Acknowledgment
This paper is supported by the “13th Five-Year Plan” Scientific Research Planning Project of Jilin Provincial Department of Education “Study on Optimizing Algorithm for Portable Electronic Nasal Sampling Detection”. (Contract No.: JJKH20180952KJ).
7
References
[1]Wang, C., Li, J., Yang, Y., Ye, F. (2018). Combining solar energy harvesting with wire-less charging for hybrid wirewire-less sensor networks. IEEE Transactions on Mobile Compu-ting, 17(3): 560-576. https://doi.org/10.1109/TMC.2017.2732979
[2]Singh, A., Awasthi, A.K., Singh, K., Srivastava, P.K. (2016). Modeling and analysis of worm propagation in wireless sensor networks. Wireless Personal Communications, 98(3): 2535-2551. https://doi.org/10.1007/s11277-017-4988-3
[3]Yildiz, H.U., Tavli, B., Kahjogh, B.O., Dogdu, E. (2017). The impact of incapacitation of multiple critical sensor nodes on wireless sensor network lifetime. IEEE Wireless Com-munications Letters, 6(3): 306-309. https://doi.org/10.1109/LWC.2017.2679744
[4]Cho, J.H., Kim, Y.W., Na, K.J., Jeon, G.J. (2008). Wireless electronic nose system for re-al-time quantitative analysis of gas mixtures using micro-gas sensor array and neu-ro-fuzzy network. Sensors & Actuators B Chemical, 134(1): 104-111.
https://doi.org/10.1016/j.snb.2008.04.019
[5]Chowdhury, C., Aslam, N., Ahmed, G., Chattapadhyay, S., Neogy, S., Zhang, L. (2017): Novel algorithms for reliability evaluation of remotely deployed wireless sensor networks. Wireless Personal Communications, 98(11): 1-30.
[6]Herrero, J.L., Lozano, J., Santos, J.P., Suárez, J.I. (2016). On-line classification of pol-lutants in water using wireless portable electronic noses. Chemosphere, 152: 107-116.
[7]Chansongkram, W., Nimsuk, N. (2016). Development of a wireless electronic nose ca-pable of measuring odors both in open and closed systems ☆. Procedia Computer Sci-ence, 86: 192-195. https://doi.org/10.1016/j.procs.2016.05.060
[8]Aleixandre, M., Santos, J.P., Sayago, I., Cabellos, J.M., Arroyo, T., Horrillo, M.C. (2015). A wireless and portable electronic nose to differentiate musts of different ripeness degree and grape varieties. Sensors, 15(4): 8429-8443. https://doi.org/10.3390/s150408429
[9]Song, K., Wang, Q., Liu, Q., Zhang, H., Cheng, Y. (2011). A wireless electronic nose sys-tem using a fe2o3 gas sensing array and least squares support vector regression. Sensors, 11(1): 485-505. https://doi.org/10.3390/s110100485
[10]Brunelli, D., Balsamo, D., Paci, G., Benini, L. (2012). Temperature compensated time synchronisation in wireless sensor networks. Electronics Letters, 48(16): 1026-1028.
https://doi.org/10.1049/el.2012.1246
[11]Alaei, M., Barcelo-Ordinas, J. M. (2010). A method for clustering and cooperation in wire-less multimedia sensor networks. Sensors, 10(4): 3145-3169. https://doi.org/10.3390/s10 0403145
[12]Cho, J J., Ding, Y., Chen, Y., Tang, J. (2007). Robust Calibration for Localization in Clus-tered Wireless Sensor Networks. IEEE International Conference on Automation Science and Engineering, 7(1): 81-95. https://doi.org/10.1109/COASE.2007.4341675
[13]Domenech-Asensi, G., Carrillo-Calleja, J.M., Illade-Quinteiro, J., Martinez-Viviente, F. (2014). Low-frequency cmos bandpass filter for pir sensors in wireless sensor nodes. Sen-sors Journal IEEE, 14(11): 4085-4094. https://doi.org/10.1109/JSEN.2014.2333538
[14]He, S., Chen, J., Cheng, P., Gu, Y., He, T., Sun, Y. (2012). Maintaining quality of sens-ing with actors in wireless sensor networks. IEEE Transactions on Parallel & Distrib-uted Sys-tems, 23(9): 1657-1667. https://doi.org/10.1109/TPDS.2012.100
[15]Wei, Z., Xiao, X., Wang, J., Wang, H. (2017). Identification of the rice wines with dif-ferent marked ages by electronic nose coupled with smartphone and cloud storage plat-form. Sensors,17(11): 2500. https://doi.org/10.3390/s17112500
[16]Zaoui, F.Z., Hanifi, H.A., Abderahman, L.Y., Mustapha, M.H., Abdelouahed, T., Dja-mel, O. (2017). Free vibration analysis of functionally graded beams using a higher-order shear deformation theory. Mathematical Modelling of Engineering Problems, 4(1): 7-12.
https://doi.org/10.18280/mmep.040102
[17]Vito, S.D., Palma, P.D., Ambrosino, C., Massera, E., Burrasca, G., Miglietta, M.L. (2011). Wireless sensor networks for distributed chemical sensing: addressing power consumption limits with on-board intelligence. IEEE Sensors Journal, 11(4): 947-955.
https://doi.org/10.1109/JSEN.2010.2077277
[18]Sureshkumar, A., Samson Ravindran, R. (2016). Swarm and fuzzy based cooperative cach-ing framework to optimize energy consumption over multimedia wireless sensor networks. Wireless Personal Communications, 90(2): 1-24. https://doi.org/10.1007/s11277-016-3274-0
8
Author
Mei Hong (1981-), female, Research Department of Changchun University,
asso-ciate researcher. Major research fields: computer science technology, algorithm re-search, pattern recognition; one article was published in the EI journal, one was in Chinese core journal, and 8 papers were in provincial journals.