R E S E A R C H
Open Access
Diagnosis of ventilator-associated
pneumonia using electronic nose sensor
array signals: solutions to improve the
application of machine learning in
respiratory research
Chung-Yu Chen
1, Wei-Chi Lin
2and Hsiao-Yu Yang
2,3,4,5,6*Abstract
Background:Ventilator-associated pneumonia (VAP) is a significant cause of mortality in the intensive care unit. Early diagnosis of VAP is important to provide appropriate treatment and reduce mortality. Developing a noninvasive and highly accurate diagnostic method is important. The invention of electronic sensors has been applied to analyze the volatile organic compounds in breath to detect VAP using a machine learning technique. However, the process of building an algorithm is usually unclear and prevents physicians from applying the artificial intelligence technique in clinical practice. Clear processes of model building and assessing accuracy are warranted. The objective of this study was to develop a breath test for VAP with a standardized protocol for a machine learning technique.
Methods:We conducted a case-control study. This study enrolled subjects in an intensive care unit of a hospital in southern Taiwan from February 2017 to June 2019. We recruited patients with VAP as the case group and ventilated patients without pneumonia as the control group. We collected exhaled breath and analyzed the electric resistance changes of 32 sensor arrays of an electronic nose. We split the data into a set for training algorithms and a set for testing. We applied eight machine learning algorithms to build prediction models, improving model performance and providing an estimated diagnostic accuracy.
Results:A total of 33 cases and 26 controls were used in the final analysis. Using eight machine learning algorithms, the mean accuracy in the testing set was 0.81 ± 0.04, the sensitivity was 0.79 ± 0.08, the specificity was 0.83 ± 0.00, the positive predictive value was 0.85 ± 0.02, the negative predictive value was 0.77 ± 0.06, and the area under the receiver operator characteristic curves was 0.85 ± 0.04. The mean kappa value in the testing set was 0.62 ± 0.08, which suggested good agreement.
Conclusions:There was good accuracy in detecting VAP by sensor array and machine learning techniques. Artificial
intelligence has the potential to assist the physician in making a clinical diagnosis. Clear protocols for data processing and the modeling procedure needed to increase generalizability.
Keywords:Electronic nose, Breath test, Machine learning, Ventilator-associated pneumonia, Volatile organic compounds
© The Author(s). 2020Open AccessThis article is distributed under the terms of the Creative Commons Attribution 4.0 International License (http://creativecommons.org/licenses/by/4.0/), which permits unrestricted use, distribution, and reproduction in any medium, provided you give appropriate credit to the original author(s) and the source, provide a link to the Creative Commons license, and indicate if changes were made. The Creative Commons Public Domain Dedication waiver (http://creativecommons.org/publicdomain/zero/1.0/) applies to the data made available in this article, unless otherwise stated.
* Correspondence:[email protected] 2
Institute of Occupational Medicine and Industrial Hygiene, National Taiwan University College of Public Health, Taipei, Taiwan
3Institute of Environmental and Occupational Health Sciences, National Taiwan University College of Public Health, Taipei, Taiwan
Background
Ventilator-associated pneumonia (VAP) is a signifi-cant cause of mortality, and the most common noso-comial infection in the intensive care unit (ICU) [1]. According to the US National Nosocomial Infection Surveillance system, one-third of all nosocomial in-fections in ICUs are pneumonia; of these, 83% are associated with mechanical ventilation [2]. Common pathogens of VAP include Pseudomonas aeruginosa,
Staphylococcus aureus, methicillin-resistant Staphylo-coccus aureus, Klebsiella pneumoniae, and Acineto-bacter baumannii [3]. Patients who acquire VAP have poorer outcomes, higher mortality rates, and longer lengths of hospital stay than uninfected pa-tients [4]. Delays in the initiation of appropriate antibiotic treatment for VAP significantly increase mortality [5]. Patients with suspected VAP should undergo a serial evaluation that includes chest X-ray, sputum Gram stain, sputum cultures, and blood cul-tures. The sputum Gram stain is not reliable for the early application of antibiotic therapy. Sputum cul-ture requires a long culcul-ture duration, and the results might not correlate well with the real causative pathogen [6]. Mechanically ventilated (MV) patients usually empirically receive broad-spectrum antibiotics to control a suspected infection at the earliest time, which may result in the development of resistance [7]. Early diagnosis for VAP is important to provide appro-priate treatment and reduce mortality. However, current culture-based microbiological diagnosis is inadequate for the timely prescription of targeted antibiotics. The development of a rapid test to diagnose VAP is therefore important to solve these problems [8].
Many bacterial species can produce volatile metab-olites via catabolic pathways, including glycolysis, proteolysis, and lipolysis [9]. According to gas chro-matography/mass spectrometry (GC-MS) analysis, as many as 34 volatile metabolites were released from
Streptococcus pneumoniae and 28 from Haemophilus influenzae in vitro, comprising alcohols, aldehydes, esters, hydrocarbons, ketones, and sulfur-containing compounds [10]. In an animal study, the volatile or-ganic compounds (VOCs) released from the breath of mice with lung infections of Pseudomonas aeruginosa
and Staphylococcus aureus were also detectable in cultures in vitro [11]. These findings were also noted in some human studies conducted in VAP with
Staphylococcus aureus, Escherichia coli, Candida albi-cans, and Acinetobacter baumannii infection [12, 13]. The findings suggested that discrimination of the VOCs derived from pathogens might provide a nonin-vasive breath test for the diagnosis of VAP.
A novel sensor array technique has been developed to discriminate the VOCs in breath [14]. The estimated
number of metabolites in humans ranges from a low of 2000–3000 to a high of approximately 20,000 [15]. It is difficult to qualitatively and quantitatively measure all the VOCs by GC-MS because most of the compounds are still unknown. To discriminate the VOCs associated with diseases, there is increasing interest in using an electronic nose to address the problem [14]. An elec-tronic nose uses sensor responses to measure VOCs. During the measurements, the VOCs attach to the sen-sor polymer surface to induce swelling of the polymer film. The swelling increases the electrical resistance of the composite, which generates an electrical signal. The sensor array response data are subsequently used as predictors to create a diagnostic classification algorithm [16]. Artificial intelligence (AI) has been gradually used in medicine to as-sist physicians in making clinical diagnoses [17]. Machine learning technology is commonly used in the analysis of sensor response data because an electronic nose is a com-posite of a sensor array and functionally resembles bio-logical olfactory receptors by pattern recognition. However, the process of building algorithms is usually a“black box”, and the results are over optimized in many studies, prevent-ing physicians from applyprevent-ing them in clinical practice. Clear processes of model building and assessing accuracy are therefore warranted. The objective of this study was to use sensor array signals to diagnose VAP using the machine learning technique. Using this study as an example, we demonstrated our procedures to build machine learning al-gorithms and assess their accuracy for facilitating the appli-cation of AI in medicine.
Methods
Study subjects
We recruited cases of VAP and ventilated controls without VAP in the ICU of National Taiwan Univer-sity Hospital Yunlin Branch. The diagnosis of VAP was based on three components: clinical signs of in-fection (fever, increased white blood cell counts, or purulent tracheobronchial secretions); new or wors-ening infiltrates on a chest X-ray; and bacteriologic evidence of pulmonary parenchymal infection [18].
Microbiological report
The microbiological report of VAP was based on the cul-ture of lower respiratory tract secretions obtained from the endotracheal aspirate, tracheostomy tube suction, or bronchoscopy. Lower respiratory tract secretions were ob-tained before antibiotics were started or changed.
Medical history and examination
(AST), an alanine aminotransferase (ALT), and a urinary analysis. We obtained a cigarette smoking history from the medical records or his/her family.
Diagnosis of VAP
The diagnosis of VAP was ascertained by a pulmo-nologist and an infectious disease physician using clinical signs/symptoms, laboratory reports, and chest X-rays. The pathogens of pneumonia were confirmed by culture of lower respiratory tract se-cretions. The study subjects and physicians were blinded to the results of an electronic nose analysis.
Breath air sampling
VOCs generated by causative pathogens of VAP are best collected in the lower respiratory tract. We collected alveolar air from an endotracheal tube to prevent contamination from environmental air, the oral cavity, and dead space air and to increase the concentration of VOCs derived from pathogens [19]. To prevent contamination from food, the sam-pling was performed before feeding. We collected a 1-l volume of alveolar air in a Tedlar Bag (SKC, Inc., USA). A new bag was used to prevent poten-tial contamination from incomplete cleaning of the reused bags.
Electronic nose analysis
The electronic nose analysis followed our standard-ized procedure [20]. In brief, the collected air was sent back to the laboratory for analysis within 48 h. The air was analyzed using the Cyranose 320 elec-tronic nose (Sensigent, CA, USA), which has 32 thin-film nanocomposite sensors. For each of the 32 sensors, ten consecutive measurements from the same breath were collected to obtain a mean value for analysis after the deletion of the first measure-ments according to the manufacturer’s suggestion [21]. Because the expiratory flow rate would signifi-cantly affect the measurement [22], a constant flow rate of 120 cc/min was standardized for all mea-surements. The Cyranose 320 uses conducting poly-mer arrays, which might be influenced by the temperature of the sample gas. Therefore, we main-tained a constant temperature of 20–22 degrees Celsius during all analyses. We analyzed all samples in the same room with a fixed temperature and hu-midity. The room air pumped into the electronic nose was analyzed to provide the baseline sensor response (R0). The raw data were normalized and
autoscaled to eliminate background noise and ex-clude outliers [22, 23] and then used to derive the prediction model.
Sensor response:ΔR Ro ¼
RmaxR0
ð Þ
R0 : ð
1Þ
The raw data were normalized using the equation
XNV
k¼1
x2ik¼ci ð2Þ
where kdesignates the sensor, i designates the gas, and NV is the total number of sensors. Then, the data were autoscaled to the unit variance that refers to mean cen-tering and then divided by the standard deviation:
x0ik¼xik−xk
sk ð
3Þ
where x0ik is the autoscaled response, xik is the relative
sensor response, xk is the mean value of the normalized response for the specific sensor and sk is the standard
deviation.
sk¼
1 NP−1
XNP
i¼1
ðxik−xkÞ2 1=2
ð4Þ
Autoscaling removes any inadvertent weighting that arises due to arbitrary units. After autoscaling, the value distribution of each sensor across the entire database was set to a mean value of zero and unit standard devi-ation [23].
Statistical analysis
K-nearest neighbors
The k-nearest neighbors algorithm uses information about an example’s k-nearest neighbors to classify unlabeled examples by calculating the distance be-tween two points. We used the Euclidean distance by the following formula:
dist pð ;qÞ ¼
ffiffiffiffiffiffiffiffiffiffiffiffiffiffiffiffiffiffiffiffiffiffiffiffiffiffiffiffiffiffiffiffiffiffiffiffiffiffiffiffiffiffiffiffiffiffiffiffiffiffiffiffiffiffiffiffiffiffiffiffiffiffiffiffiffiffiffiffiffiffiffiffiffiffi p1−q1
ð Þ2þ p
2−q2
ð Þ2þ:::þ p
n−qn
ð Þ2
q
ð5Þ
where p and q are the examples to be compared, each having n features. The strength of k-nearest neighbors is that it makes no assumptions about the underlying data distribution [27]. We used the R package “class” to build the k-nearest neighbors model [28].
Naive Bayes
The Naive Bayes algorithm applied the Bayes’ the-orem to classification, in which we can compute a posterior probability of an outcome event based on a prior probability:
P Að jBÞ ¼P Að ∩BÞ P Bð Þ ¼
P Bð jAÞP Að Þ
P Bð Þ ð6Þ
The Naive Bayes classification algorithm can be sum-marized by the following algorithm:
P Cð LjF1; ::::;FnÞ ¼
1 Zp Cð ÞL
Yn
i¼1
p Fð ijCLÞ ð7Þ
where the probability of level L for class C, given the evi-dence provided by features F1through Fn, is equal to the
product of the probabilities of each piece of evidence conditioned on the class level, the prior probability of the class level, and a scaling factor, 1/Z, which converts the likelihood values into probabilities. The strength of Naive Bayes is that it requires relatively few examples for training and does well with noisy data. The weakness is that it assumes that all of the features in the database are equally important and independent, but the assump-tion is rarely true [27]. We used the R package“klaR”to build the Naive Bayes model [29].
Decision tree
Decision tree utilizes a tree structure to model the relationships among the features and the potential outcomes. It uses entropy to quantify the random-ness with a set of class values and find splits that re-duce entropy. Entropy is specified as follows:
Entropy Sð Þ ¼X c
i¼1
−pi log2ð Þpi ð8Þ
for a given segment of data (S), term c refers to the number of class levels, andpirefers to the proportion of
values falling into class level i. Decision tree uses en-tropy to determine the optimal feature to split upon, and the algorithm calculates the change in homogen-eity that would result from a split on each possible feature, which is a measure known as information gain. The information gain for a feature F is calcu-lated as the difference between the entropy in the segment before the split (S1) and the partitions
result-ing from the split (S2):
InfoGain Fð Þ ¼Entropy Sð Þ1 −Entropy Sð Þ2 ð9Þ
Decision tree is best suited for tasks with many fea-tures or complexes and nonlinear relationships among features and outcomes [27]. We used the R package “C50”to build the decision tree model [30].
Neural network
Artificial neural networks mimic the structure of animal brains to model arbitrary functions. The biological neuron that uses dendrites to receive a signal, and a neuron determines the importance of the signal and then decides whether to transmit the signal to the next neuron by the axon. The input signals are received by the dendrites (x variables), each dendrite’s signal is weighted (w values) accord-ing to its importance, and the output is the signal (y variable). The input signals are summed by the cell body, and the signal is passed on according to an activation function. With n input dendrites, the activation function can be represented by the fol-lowing formula:
y xð Þ ¼ f X n
i¼1
wixi !
ð10Þ
wheren refers to the number of input dendrites, and w weights allow each of the n inputs (denoted by xi) to
contribute a greater or lesser amount to the sum of in-put signals. The net total is used by the activation func-tion f(x), and the resulting signal, y(x), is the output axon. The strength of neural networks is the capability to model complex patterns without making an
assumption regarding the data’s underlying relationships. However, their weakness is that they are very prone to overfitting [27]. We used the R package “neuralnet” to build the neural network model [31].
Support vector machines
SVMs creates a flat boundary called a hyperplane, which di-vides the space to create fairly homogeneous partitions on ei-ther side that allow SVMs to model highly complex relationships. SVMs uses a kernel trick to separate data into a higher dimension space. The kernel function is expressed as:
K !xi;!xj
¼φ !xi φ !xj ð11Þ
whereϕ(x) is a function to transfer the feature vectorsxi
and xj and combine them into a single number. Using
this form, kernel functions have been developed for many different domains of data. The linear kernel does not transform the data at all. The polynomial kernel of degree d adds a simple nonlinear transformation of the data. The radial basis kernel is similar to a neural net-work and can perform well on many types of data [27].
Linear kernel: K !xi;!xj
¼! xi !xj Polynomial kernel: K !xi;!xj
¼ ! xi !xjþ1
d
Radial basis kernel: K!xi;!xj¼e
− !xi−x!j
2
2ο2
ð12Þ
We used the R package “kernlab” to build the SVMs model [32].
Random forest
A random forest is an ensemble consisting of random trees, which are decision trees generated in a specific way to obtain diversity among the trees [33]. The strength of a random forest is the ability to handle an extremely large number of features or examples that are easy to use [27]. We created an ensemble of 500 trees and used the out-of-bag error rate to estimate the test set error [34]. We used the R package“randomForest”to build the random forest model [35].
Accuracy
is especially important for datasets with class imbalance, we also calculated the kappa statistics [27] Kappa presses the extent to which the observed agreement ex-ceeds that which would be expected by chance alone. A kappa greater than 0.75 represents excellent agreement beyond chance, a kappa below 0.40 represents poor agreement, and a kappa of 0.40 to 0.75 represents inter-mediate to good agreement. We used a bootstrap method and calculated the accuracy of 100 iterations to decide the parameters of machine learning methods that had the highest prediction accuracy. The statistics can be defined by the following equations:
Accuracy¼Number of true positivesNumber of true positivesþtrue negativesþnumber of true negativesþfalse positivesþfalse negatives
Sensitivity¼Number of true positivesNumber of true positivesþNumber of false negatives
Specificity¼Number of true negativesNumber of true negativesþNumber of false positives
Positive predictive value¼ Number of true positives
Number of true positivesþNumber of false positives
Negative predictive value¼ Number of true negatives
Number of true negativesþNumber of false negatives
Kappa¼ðPercent agreement observedÞ−ðPercent agreement expected by chance aloneÞ
100%−ðPercent agreement expected by chance aloneÞ
ð13Þ
We also constructed ROC curves and calculated an AUC with 2000 bootstrap replicates and the partial AUC (pAUC) to assess the variability of the measure. The formula of pAUC was:
pROC¼1 2 1þ
pAUC−min max−min
; ð14Þ
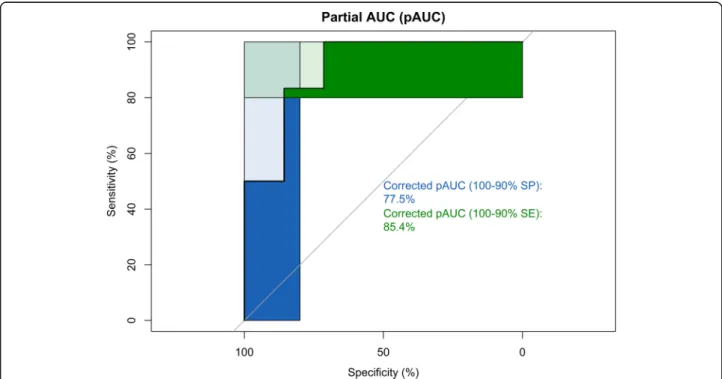
wheremin is the pAUC over the same region of the di-agonal ROC curve, andmaxis the pAUC over the same region of the perfect ROC curve [37]. Because we were interested in a diagnostic test with a high specificity and sensitivity, we also examined the partial AUC between 80 and 100% for specificity and sensitivity.
Results
A total of 61 subjects were enrolled. After excluding two subjects without a questionnaire, a total of 33 cases and 26 controls were used in the final analysis. In the case group, the primary pathogen in sputum culture was most commonly Klebsiella pneumoniae (42.42%), followed by
Stenotrophomonas maltophilia (15.15%), Staphylococcus aureus (15.15%), Acinetobacter baumannii (12.12%),
Pseudomonas aeruginosa(12.12%),Escherichia coli(6.06%),
Candida albicans(6.06%),Haemophilus influenzae(3.03%), andEnterobacter cloacaecomplex (3.03%). The mean num-ber of the pathogens was 1.52. In addition to pneumonia, the comorbidities in the case group included myocardial
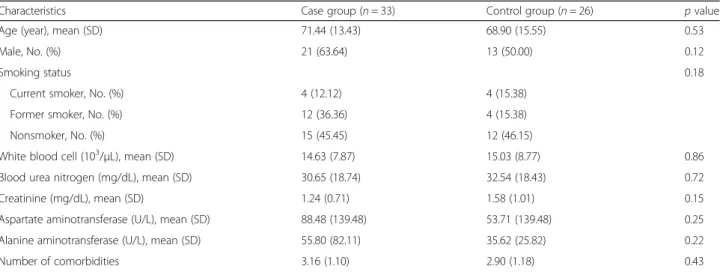
infarction, diabetes, aspiration pneumonia, hepatitis, endocarditis, heart failure, lung cancer, chronic obstructive pulmonary disease, hepatocellular carcinoma, idiopathic pulmonary fibrosis, colon cancer, necrotizing fasciitis, kidney injuries, hyponatremia, and cardiac arrest. In the control group, the comorbidities included intracranial hemorrhage, gastric cancer, traffic accident, fracture, gastric ulcer, coronary artery disease, acute kidney injury, traumatic brain injury, aortic dissection, lung cancer, Fournier’s gangrene, and liver abscess. There was no statistically significant difference in age, gender, smoking status, liver and renal function tests, or the number of comorbidities in both groups (Table1).
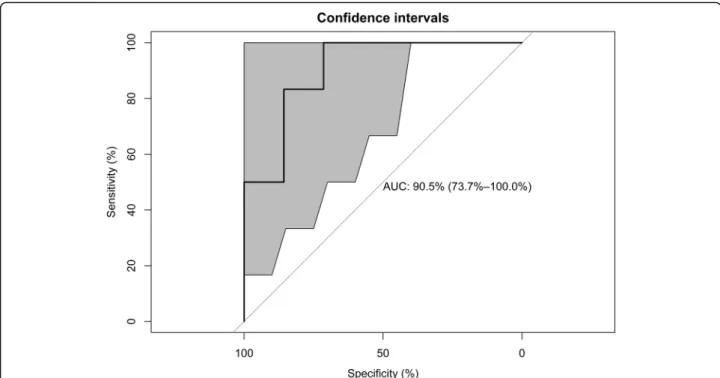
Using eight machine learning algorithms, the mean ac-curacy in the testing set was 0.81 ± 0.04, the sensitivity was 0.79 ± 0.08, the specificity was 0.83 ± 0.00, the posi-tive predicposi-tive value (PPV) was 0.85 ± 0.02, the negaposi-tive predictive value (NPV) was 0.77 ± 0.06, and the AUC was 0.85 ± 0.04. The mean kappa value in the testing set was 0.62 ± 0.08, which suggested good agreement (Table 2). The AUCs were 0.82 (95% CI 0.70—0.94), 0.83 (0.70—0.94), and 0.82 (95% CI 0.71—0.93) in the training set, testing set, and the full data set, respectively (Fig. 2). In the testing set, the corrected pAUC between 80 and 100% for sensitivity was 85.4%. The corrected pAUC between 80 and 100% for specificity was 75.5% (Fig. 3). Using bootstrap resampling for 2000 replicates, the model established by the random forest algorithm had the highest AUC (Fig.4).
Discussion
This study used an electronic nose to develop a breath test for VAP. We focused on standardizing the process of es-tablishing machine learning algorithms. After all the pro-cedures were standardized, the breath test developed herein had a high diagnostic accuracy in predicting VAP.
value without showing details for readers to evaluate the reliability of test results. In this study, we carefully selected machine learning algorithms that are suitable for the learning task for classification. Because the relationships of sensor response variables were initially unclear, this study also used eight types of machine learning to provide a reliable estimation of the accuracy with the mean value. We found that the data of sensor arrays might be suscep-tible to multicollinearity for the high correlation between sensor responses, and the neural network had poor performance in this situation. Classification trees might be resistant to highly correlated sensor responses. Finally, AUC is an important index for the evaluation of diagnostic accuracy. However, one of the major practical drawbacks of the AUC as an index of diagnostic performance is that it summarizes the entire ROC curve, including regions that frequently are not relevant to practical applications (e.g., regions with low levels of specificity). In this study, we also applied a pAUC to prevent the statistical uncertainty of the estimation [39]. The results of the obtained accuracy reported in this study are therefore conservative but more
reliable than AUC results for clinical physicians to judge the new AI technique. From the technical point of view, we suggest that researchers not show only the best results with the highest accuracy; instead, a study should clearly explain all the procedures and conservatively estimate the accuracy for physicians in making clinical decisions.
In vitro studies have reported that an electronic nose was able to detect Staphylococcus aureus, Hae-mophilus influenzae, Escherichia coli, Pseudomonas aeruginosa, Moraxella catarrhalis, Streptococcus pneu-moniae, and Mycobacterium tuberculosis in bacterial cultures [40–42]. In human studies, van Geffena et al. reported that the electronic nose could discriminate bacterial and viral infections in patients with chronic obstructive pulmonary disease with acute exacerba-tions [43]. A study used an electronic nose to detect pulmonary aspergillosis in patients with prolonged chemotherapy-induced neutropenia and reported an accuracy of 90.9% [44]. In ventilated patients, Hock-stein et al. used an electronic nose to diagnose VAP and showed a correlation between the electronic
Table 1Demographic characteristics of the study subjects
Characteristics Case group (n= 33) Control group (n= 26) pvalue
Age (year), mean (SD) 71.44 (13.43) 68.90 (15.55) 0.53
Male, No. (%) 21 (63.64) 13 (50.00) 0.12
Smoking status 0.18
Current smoker, No. (%) 4 (12.12) 4 (15.38)
Former smoker, No. (%) 12 (36.36) 4 (15.38)
Nonsmoker, No. (%) 15 (45.45) 12 (46.15)
White blood cell (103/μL), mean (SD) 14.63 (7.87) 15.03 (8.77) 0.86
Blood urea nitrogen (mg/dL), mean (SD) 30.65 (18.74) 32.54 (18.43) 0.72
Creatinine (mg/dL), mean (SD) 1.24 (0.71) 1.58 (1.01) 0.15
Aspartate aminotransferase (U/L), mean (SD) 88.48 (139.48) 53.71 (139.48) 0.25
Alanine aminotransferase (U/L), mean (SD) 55.80 (82.11) 35.62 (25.82) 0.22
Number of comorbidities 3.16 (1.10) 2.90 (1.18) 0.43
Table 2Prediction accuracy of the electronic nose in the test set of machine learning algorithms
Model and parameters Accuracy (95% CI) Sensitivity Specificity PPV NPV Kappa AUC (95% CI)
k-nearest neighbors (k= 5) 0.77 (0.46–0.95) 0.71 0.83 0.83 0.71 0.54 0.80 (0.54–1.00)
Naive Bayes (fL = 0, usekernel = TRUE, adjust = 1) 0.77 (0.46–0.95) 0.71 0.83 0.83 0.71 0.54 0.80 (0.54–1.00)
Decision tree (trials = 10, model = rules, window = TRUE) 0.85 (0.55–0.98) 0.86 0.83 0.86 0.83 0.69 0.85 (0.63–1.00)
Neural network (size = 3, decay = 1e-04) 0.85 (0.55–0.98) 0.86 0.83 0.86 0.83 0.69 0.85 (0.63–1.00)
Support vector machines (linear kernel) (C = 1) 0.85 (0.55–0.98) 0.86 0.83 0.86 0.83 0.69 0.85 (0.63–1.00)
Support vector machines (radial kernel) (sigma = 1.432815, C = 1)
0.77 (0.46–0.95) 0.71 0.83 0.83 0.71 0.54 0.85 (0.63–1.00)
Support vector machines (polynomial kernel) (degree = 1, scale = 0.1, C = 0.5)
0.85 (0.55–0.98) 0.86 0.83 0.86 0.83 0.69 0.85 (0.63–1.00)
Random forest (mtry = 32) 0.77 (0.46–0.95) 0.71 0.83 0.83 0.71 0.54 0.90 (0.74–1.00)
Mean value (SD) 0.81 (0.04) 0.79 (0.08) 0.83 (0.00) 0.85 (0.02) 0.77 (0.06) 0.62 (0.08) 0.85 (0.04)
sensor response and the pneumonia score, with a diagnostic accuracy of 70% [45]. Schnabel et al. used an electronic nose to diagnose VAP and reported a sensitivity of 88% and a specificity of 66% [46]. Liao et al. selected 12 patients with Pseudomonas aeruginosa
infection and 12 patients as noninfectious controls to diagnose VAP withPseudomonas aeruginosa infection in the ICU with the Cyranose 320 electronic nose. The study reported accuracy of 0.95 and a positive predictive value of 0.93 but did not provide the specificity, a negative Fig. 2The area under the receiver operating curve (AUC) for ventilator-associated pneumonia in the training set, testing set, and full data set. High AUCs in the three sets show high diagnostic accuracy
predictive value, or Kappa values [47]. In fact, in in-hospital patients, especially in the ICU, most of the bacter-ial cultures report many bacteria, and one single bacteria is not common. Therefore, the selection of patients may introduce selection bias that makes it difficult to generalize the research results in clinical practice. For crit-ical patients in the ICU, physicians’ primary concern is whether frail patients have bacterial pneumonia, and then they can empirically prescribe broad-spectrum antibiotics on time. Our study did not attempt to detect one single bacteria and therefore prevented misclassification bias from selecting study subjects. From the medical point of view, we suggest that future medical AI researchers must know the need in clinical practice, and then the research can truly promote the application of AI in clinical application.
In the breath study of ICU patients, we must consider the influence of multiple comorbidities that may de-crease discrimination ability. Many diseases, such as dia-betes, acute renal failure, and acute hepatitis, may influence breath metabolites [48–50]. Moreover, many subjects had coinfection at other sites, such as the urin-ary tract and skin. Multiple infectious diseases with co-existing varied pathogens might also decrease the dis-crimination ability. To prevent confounding results, we suggest that further studies should consider more re-strictive exclusion criteria and controls individually
matched by age (+/−5 years) and gender. Owing to a limited number of subjects, we did not conduct an inde-pendent external validation test. The results must be interpreted carefully. We suggest enrolling more study subjects in different hospitals to validate the results be-fore clinical use.
subjects included in the external validation set were en-rolled from other hospitals [52]. Therefore, researchers should know the limitation of external validation. A pre-diction model established from hospital patients might not be suitable for community screening. From an epi-demiological point of view, we suggest that AI re-searchers should carefully examine their study design and select suitable study subjects in consideration of their future application.
Though the random forest algorithm had the highest AUC in this study, there are many machine learning al-gorithms, and most electronic nose studies tried many machine learning technique and showed the algorithm with the best accuracy. We conducted a literature search in PubMed at https://www.ncbi for “(machine learning) AND (electronic nose) NOT review [Publication Type]” published in 2019. After eliminating papers without full text or did not provide details of sensor, this search pro-duced 17 results published in 2019. The most common used algorithm was support vector machine (10 studies), followed by neural network (6 studies), random forest (4 studies),k-nearest neighbor (4 studies), and then linear dis-crimination analysis (3 studies). Support vector machine combines both the instance-based nearest neighbor and the linear regression modeling to model highly complex rela-tionships by creating hyperplanes [27]. SVM algorithms have been implemented in several well-supported libraries across many programming languages and exploded in
popularity [27]. We have summarized the strength and weaknesses of common machine learning techniques (Table 3). For researchers who are not familiar with ma-chine learning, we suggest that SVM algorithms might be a suitable solution to analyze the sensor array data.
Limitation
In this study, we operated the electronic nose at 20–22 degrees Celsius, which is different from the temperature of the human exhaled air of around 37 degrees Celsius. We suggest future studies use GC-MS to compare the changes in the composition of collected breath at differ-ent temperatures.
Conclusion
An electronic nose can discriminate the distinct patterns of VOCs derived from pathogens and be applied to diagnose VAP. Using sensor arrays to analyze VOCs has potential in the development of a new screening test for VAP in the ICU. The potential of the AI technique in clinical medicine is expected but not yet fully recognized. Although it is rea-sonable to expect high predictive accuracy in making predic-tions owing to the development of increasingly elaborate machine learning algorithms, we should also advocate for further research to address the importance of epidemio-logical study design and strengthen the reporting of proce-dures to test accuracy.
Table 3Comparison of strengths and weaknesses of machine learning algorithms in electronic nose studies
Strengths Weaknesses
k-nearest neighbors •Make no assumption about underlying data distribution
•Does not produce a model, limiting the ability to understand how the features are related to the class
•If there are more samples of one class than other class, the dominant class will control the classification and cause wrong classification
Naive Bayes •Requires relatively few examples for training •Relies on an often-faulty assumption of equally important and independent features
•Not ideal for datasets with many numeric features
Decision tree •Can be used on small dataset •It is easy to overfit or underfit the model
•Model is easy to interpret •Small changes in the training data can result in large changes
to decision logic
Neural network •Conceptually similar to human neural function •Very prone to overfitting training data •Capable of modeling more complex patterns •Susceptible to multicollinearity Support vector machines •High accuracy but not overly influenced by noisy
data and not very prone to overfitting •
Finding the best model requires testing of various combinations of kernels and model parameters
•Easier for users due to the existence of several well-supported SVM algorithms
•Most commonly used
Random forest •Can handle noisy or missing data •The model is not easily interpretable
•Suitable for class imbalance problems
Abbreviations
AI:Artificial intelligence; ALT: Alanine aminotransferase; AST: Aspartate aminotransferase; BUN: Blood urine nitrogen; CBC: Complete blood count; GC-MS: Gas chromatography/mass spectrometry; ICU: Intensive care unit; MV: Mechanically ventilated; NPV: Negative predictive value; PPV: Positive predictive value; ROC: Receiver operator characteristic; STARD: Standards for reporting of diagnostic accuracy studies; SVMs: Support vector machines; VAP: Ventilator-associated pneumonia; VOCs: Volatile organic compounds
Acknowledgments
This work was financially supported by the Ministry of Science and Technology and the‘Innovation and Policy Center for Population Health and Sustainable Environment (Population Health Research Center, PHRC), College of Public Health, National Taiwan University’from The Featured Areas Research Center Program within the framework of the Higher Education Sprout Project by the Ministry of Education (MOE) in Taiwan.
Authors’contributions
Conceptualization, CYC; Methodology, WCL; Software, WCL.; Validation, HYY; Formal Analysis, WCL.; Investigation, HYY and CYC; Resources, CYC; Data Curation, CYC; Writing-Original Draft Preparation, WCL; Writing-Review & Editing, HYY; Visualization, WCL; Supervision, HYY; Project Administration, WCL; Funding Acquisition, HYY. All authors read and approved the final manuscript.
Funding
This research was funded by the Ministry of Science and Technology, Taiwan, grant numbers [MOST 106–2314-B-002-107, 107–2314-B-002-198, 108–2918-I-002-031, 107– 3017-F-002-003] and the Higher Education Sprout Project by the Ministry of Education (MOE) in Taiwan (NTU-107 L9003).
Ethics approval and consent to participate
The Research Ethics Committee (201612235RIND) of National Taiwan University Hospital approved the study protocol, and all subjects provided informed consent.
Consent for publication Not applicable.
Competing interests
The authors declare that they have no competing interests
Author details
1Division of Pulmonary and Critical Care Medicine, Department of Internal Medicine, National Taiwan University Hospital Yunlin Branch, Douliu, Taiwan. 2Institute of Occupational Medicine and Industrial Hygiene, National Taiwan University College of Public Health, Taipei, Taiwan.3Institute of
Environmental and Occupational Health Sciences, National Taiwan University College of Public Health, Taipei, Taiwan.4Department of Public Health, National Taiwan University College of Public Health, Taipei, Taiwan. 5Department of Environmental and Occupational Medicine, National Taiwan University Hospital, Taipei, Taiwan.6Innovation and Policy Center for Population Health and Sustainable Environment, College of Public Health, National Taiwan University, Taipei, Taiwan.
Received: 1 September 2019 Accepted: 7 January 2020
References
1. Melsen WG, Rovers MM, Koeman M, Bonten MJ. Estimating the attributable mortality of ventilator-associated pneumonia from randomized prevention studies. Crit Care Med. 2011;39:2736–42.
2. Richards MJ, Edwards JR, Culver DH, Gaynes RP. Nosocomial infections in combined medical-surgical intensive care units in the United States. Infect Control Hosp Epidemiol. 2000;21:510–5.
3. Chen YY, Chen LY, Lin SY, Chou P, Liao SY, Wang FD. Surveillance on secular trends of incidence and mortality for device-associated infection in the intensive care unit setting at a tertiary medical center in Taiwan, 2000-2008: a retrospective observational study. BMC Infect Dis. 2012;12:209.
4. Rello J, Ollendorf DA, Oster G, Vera-Llonch M, Bellm L, Redman R, Kollef MH, Group VAPOSA. Epidemiology and outcomes of ventilator-associated pneumonia in a large US database. Chest. 2002;122:2115–21.
5. Iregui M, Ward S, Sherman G, Fraser VJ, Kollef MH. Clinical importance of delays in the initiation of appropriate antibiotic treatment for ventilator-associated pneumonia. Chest. 2002;122:262–8.
6. Torres A, Fabregas N, Ewig S, de la Bellacasa JP, Bauer TT, Ramirez J. Sampling methods for ventilator-associated pneumonia: validation using different histologic and microbiological references. Crit Care Med. 2000;28:2799–804. 7. Neuhauser MM, Weinstein RA, Rydman R, Danziger LH, Karam G, Quinn JP.
Antibiotic resistance among gram-negative bacilli in US intensive care units: implications for fluoroquinolone use. JAMA. 2003;289:885–8.
8. Douglas IS. New diagnostic methods for pneumonia in the ICU. Curr Opin Infect Dis. 2016;29:197–204.
9. Thorn RM, Greenman J. Microbial volatile compounds in health and disease conditions. J Breath Res. 2012;6:024001.
10. Filipiak W, Sponring A, Baur MM, Ager C, Filipiak A, Wiesenhofer H, Nagl M, Troppmair J, Amann A. Characterization of volatile metabolites taken up by or released from Streptococcus pneumoniae and Haemophilus influenzae by using GC-MS. Microbiology. 2012;158:3044–53.
11. Zhu J, Bean HD, Wargo MJ, Leclair LW, Hill JE. Detecting bacterial lung infections: in vivo evaluation of in vitro volatile fingerprints. J Breath Res. 2013;7:016003.
12. Filipiak W, Beer R, Sponring A, Filipiak A, Ager C, Schiefecker A, Lanthaler S, Helbok R, Nagl M, Troppmair J, Amann A. Breath analysis for in vivo detection of pathogens related to ventilator-associated pneumonia in intensive care patients: a prospective pilot study. J Breath Res. 2015;9:016004.
13. Gao J, Zou Y, Wang Y, Wang F, Lang L, Wang P, Zhou Y, Ying K. Breath analysis for noninvasively differentiating Acinetobacter baumannii ventilator-associated pneumonia from its respiratory tract colonization of ventilated patients. J Breath Res. 2016;10:027102.
14. Queralto N, Berliner AN, Goldsmith B, Martino R, Rhodes P, Lim SH. Detecting cancer by breath volatile organic compound analysis: a review of array-based sensors. J Breath Res. 2014;8:027112.
15. Schmidt CW. Metabolomics: what's happening downstream of DNA. Environ Health Perspect. 2004;112:A410–5.
16. Fens N, van der Schee MP, Brinkman P, Sterk PJ. Exhaled breath analysis by electronic nose in airways disease. Established issues and key questions. Clin Exp Allergy. 2013;43:705–15.
17. Jiang F, Jiang Y, Zhi H, Dong Y, Li H, Ma S, Wang Y, Dong Q, Shen H, Wang Y. Artificial intelligence in healthcare: past, present and future. Stroke Vasc Neurol. 2017;2:230–43.
18. Chastre J, Fagon JY. Ventilator-associated pneumonia. Am J Respir Crit Care Med. 2002;165:867–903.
19. Bikov A, Lazar Z, Horvath I. Established methodological issues in electronic nose research: how far are we from using these instruments in clinical settings of breath analysis? J Breath Res. 2015;9:034001.
20. Huang CH, Zeng C, Wang YC, Peng HY, Lin CS, Chang CJ, Yang HY. A study of diagnostic accuracy using a chemical sensor array and a machine learning technique to detect lung cancer. Sensors. 2018;18:2845. 21. Bofan M, Mores N, Baron M, Dabrowska M, Valente S, Schmid M, Trove A,
Conforto S, Zini G, Cattani P, et al. Within-day and between-day repeatability of measurements with an electronic nose in patients with COPD. J Breath Res. 2013;7:017103.
22. Lewis NS. Comparisons between mammalian and artificial olfaction based on arrays of carbon black-polymer composite vapor detectors. Acc Chem Res. 2004;37:663–72.
23. Lu Y, Partridge C, Meyyappan M, Li J. A carbon nanotube sensor array for sensitive gas discrimination using principal component analysis. J Electroanal Chem. 2006;593:105–10.
24. Kuhn M. Building predictive models in R using the caret package. J Stat Softw. 2008;28:1–26.
25. Wei Q, Dunbrack RL Jr. The role of balanced training and testing data sets for binary classifiers in bioinformatics. PLoS One. 2013;8:e67863.
26. Marco S. The need for external validation in machine olfaction: emphasis on health-related applications. Anal Bioanal Chem. 2014;406:3941–56. 27. Lantz B. Machine Learning with R. 2nd ed. Birmingham, UK: Packt
Publishing Ltd.; 2015.
28. Venables WN, Ripley BD. Modern applied statistics with S. 4th ed: Springer; 2002. 29. Weihs C, Ligges U, Luebke K, Raabe N. klaR Analyzing German Business
Cycles. In: Baier D, Decker R, Schmidt-Thieme L, eds. Data Analysis and Decision Support. Berlin: Springer-Verlag; 2005;335-43.
31. neuralnet: Training of Neural Networks [https://cran.r-project.org/web/ packages/neuralnet/index.html].
32. Karatzoglou A, Meyer D, Hornik K. Support vector Machines in R. J Stat Softw. 2006;15.
33. Breiman L. Random forests. Mach Learn. 2001;45:5–32.
34. Van Assche A, Vens C, Blockeel H, Dzeroski S. First order random forests: learning relational classifiers with complex aggregates. Mach Learn. 2006;64:149–82. 35. RandomForest: Breiman and Cutler's Random Forests for Classification and
Regression [https://CRAN.R-project.org/package=randomForest]. 36. Simundic AM. Measures of diagnostic accuracy: basic definitions. EJIFCC.
2009;19:203–11.
37. Robin X, Turck N, Hainard A, Tiberti N, Lisacek F, Sanchez JC, Muller M. pROC: an open-source package for R and S+ to analyze and compare ROC curves. BMC Bioinformatics. 2011;12:77.
38. Cohen JF, Korevaar DA, Altman DG, Bruns DE, Gatsonis CA, Hooft L, Irwig L, Levine D, Reitsma JB, de Vet HC, Bossuyt PM. STARD 2015 guidelines for reporting diagnostic accuracy studies: explanation and elaboration. BMJ Open. 2016;6:e012799.
39. Ma H, Bandos AI, Rockette HE, Gur D. On use of partial area under the ROC curve for evaluation of diagnostic performance. Stat Med. 2013;32:3449–58. 40. Fend R, Kolk AH, Bessant C, Buijtels P, Klatser PR, Woodman AC. Prospects for clinical
application of electronic-nose technology to early detection of mycobacterium tuberculosis in culture and sputum. J Clin Microbiol. 2006;44:2039–45. 41. Lai SY, Deffenderfer OF, Hanson W, Phillips MP, Thaler ER. Identification of
upper respiratory bacterial pathogens with the electronic nose. Laryngoscope. 2002;112:975–9.
42. Dutta R, Hines EL, Gardner JW, Boilot P. Bacteria classification using Cyranose 320 electronic nose. Biomed Eng Online. 2002;1:4. 43. van Geffen WH, Bruins M, Kerstjens HA. Diagnosing viral and bacterial
respiratory infections in acute COPD exacerbations by an electronic nose: a pilot study. J Breath Res. 2016;10:036001.
44. de Heer K, van der Schee MP, Zwinderman K, van den Berk IA, Visser CE, van Oers R, Sterk PJ. Electronic nose technology for detection of invasive pulmonary aspergillosis in prolonged chemotherapy-induced neutropenia: a proof-of-principle study. J Clin Microbiol. 2013;51:1490–5.
45. Hockstein NG, Thaler ER, Lin Y, Lee DD, Hanson CW. Correlation of pneumonia score with electronic nose signature: a prospective study. Ann Otol Rhinol Laryngol. 2005;114:504–8.
46. Schnabel RM, Boumans ML, Smolinska A, Stobberingh EE, Kaufmann R, Roekaerts PM, Bergmans DC. Electronic nose analysis of exhaled breath to diagnose ventilator-associated pneumonia. Respir Med. 2015;109:1454–9. 47. Liao YH, Wang ZC, Zhang FG, Abbod MF, Shih CH, Shieh JS. Machine
learning methods applied to predict ventilator-associated pneumonia with Pseudomonas aeruginosa infection via sensor Array of electronic nose in intensive care unit. Sensors (Basel). 2019;19:1866.
48. Buszewski B, Kesy M, Ligor T, Amann A. Human exhaled air analytics: biomarkers of diseases. Biomed Chromatogr. 2007;21:553–66.
49. Phillips M, Basa-Dalay V, Bothamley G, Cataneo RN, Lam PK, Natividad MP, Schmitt P, Wai J. Breath biomarkers of active pulmonary tuberculosis. Tuberculosis (Edinb). 2010;90:145–51.
50. Phillip M, Cataneoa RN, Cheema T, Greenberga J. Increased breath biomarkers of oxidative stress in diabetes mellitus. Clin Chim Acta. 2004;344:189–94. 51. G L. Epidemiology. 5th ed. Philadelphia: Elsevier; 2014.
52. Leopold JH, Bos LD, Sterk PJ, Schultz MJ, Fens N, Horvath I, Bikov A, Montuschi P, Di Natale C, Yates DH, Abu-Hanna A. Comparison of classification methods in breath analysis by electronic nose. J Breath Res. 2015;9:046002.
53. Jimenez-Carvelo AM, Gonzalez-Casado A, Bagur-Gonzalez MG, Cuadros-Rodriguez L. Alternative data mining/machine learning methods for the analytical evaluation of food quality and authenticity - a review. Food Res Int. 2019;122:25–39.
54. Lotsch J, Kringel D, Hummel T. Machine learning in human olfactory research. Chem Senses. 2019;44:11–22.
Publisher’s Note