Eukaryon
Eukaryon
Volume 2 Engaged Scholars in and out of the
Classroom
Article 20
1-1-2006
Determination of Spatiotemporal Interactions Regulating Head/
Determination of Spatiotemporal Interactions Regulating Head/
Trunk Axial Pattern in the Chick Embryo
Trunk Axial Pattern in the Chick Embryo
David Mann
Lake Forest College
Follow this and additional works at:
https://publications.lakeforest.edu/eukaryon
Part of the
Cell and Developmental Biology Commons
, and the
Structural Biology Commons
Disclaimer:
Eukaryon is published by students at Lake Forest College, who are solely responsible for its
content. The views expressed in Eukaryon do not necessarily reflect those of the College.
Articles published within Eukaryon should not be cited in bibliographies. Material contained
herein should be treated as personal communication and should be cited as such only with the
consent of the author.
Eukaryon, Vol. 2, January 2006, Lake Forest College
Senior Thesis
Determination of Spatiotemporal Interactions Regulating
Head/Trunk Axial Pattern in the Chick Embryo
David Mann*
Department of Biology, Lake Forest College, Lake Forest, Illinois 60045
Summary
In order to form an embryo, undifferentiated and unorganized cells must become differentiated and organized spatiotemporally. Vertebrate embryos use asymmetrical environmental cues from neighboring tissues to help generate this organized pattern of development. These neighboring tissues, called organizers, induce and pattern a field. One such organizer is Hensen’s node. In chick, a model system for studying embryonic development, Hensen’s node is located at the rostral end of the primitive streak and it is capable of inducing and patterning both head and trunk at the extended-streak stages (3d-4). Previous studies have shown that initiation of notochord formation, which correlates with the head to trunk transition, is regulated in Hensen’s node in response to signals from the midstreak and rostral endoderm. However, little is known regarding the mediation of signals regulating the head to trunk transition of the nervous system. In this study, the location of the subdivision between the head and trunk regions was evaluated. To assess regional head and trunk, we used selective transection and culture of chick embryos followed by marker gene expression in midbrain (DMBX) and caudal hindbrain (X37) by in situ hybridization. We demonstrated that the overlying rostral neuroectoderm, including the midbrain, can be induced and patterned in the absence of Hensen’s node at early gastrula stages (2-3b), suggesting that the head to trunk boundary patterns caudal to the midbrain. We further showed that the rostral ectoderm transected at gastrula stages (2-4) failed to express caudal hindbrain in the absence of the node, suggesting that the head to trunk boundary patterns rostral to the caudal hindbrain. Through the evaluation of the head to trunk boundary, we elucidated the spatiotemporal interactions regulating early signaling events involved in head/trunk axial pattern.
Introduction
Developmental Biology
To form an embryo, undifferentiated and unorganized cells must become differentiated and organized. Because each cell of the body contains the same set of genes, it is necessary to understand how this set of genetic instructions produces varied, differentiated cells (Gilbert, 1997). The study of the processes involved in
*The report of the investigation was undertaken as a Senior Thesis with
Dr. Diana Darnell in the Department of Biology.
cell differentiation and organization is identified as development. In many invertebrate organisms, the separation of asymmetrically distributed cytoplasmic determinants into daughter cells initiates the cascade of development that specifies tissues as different from one another in a coordinated way (Darnell, 2005). A cascade originates from the simple asymmetries that initiate a pattern, which in turn become the foundation for more complex patterning (Darnell, 2005). In contrast, vertebrate embryos use asymmetrical environmental cues from neighboring tissues to generate an organized pattern of development through a cascade-like mechanism of asymmetrical signal propagation. The mechanism responsible for the production of that differentiation and organization is pattern formation.
Within pattern formation of the nervous system, embryonic cells apparently initiate as a homogenous population but are not homogenous in terms of their positioning to environmental asymmetries. Consequently, the difference in the amount of signal received by cells becomes translated into a cellular response resulting in different pattern formation within that region (Gilbert, 2000). Such pattern formation involves a diverse set of cellular and molecular interactions. Mainly, the source of the environmental asymmetry secretes a signal that binds to receptors that initiate a mechanistic pathway for the propagation of that signal within a responding cell (Darnell, 2003). This pathway consists of transcription factors that launch or prevent the expression of downstream genes (Darnell, 2005). Hence, the next layer of the cascade is created by the responding cell’s transduction of the secreted signal from the environmental asymmetry into a new signal. Furthermore, the originating asymmetrical environmental cues are often secreted from neighboring tissues whose earlier differentiation allowed for them to become a signaling center (Darnell, 2003). These neighboring tissues, called organizers, both induce and pattern a field. Thus, complexity can arise from a cascade of organizer differentiation.
Developmental Cause and Effect
When one can assess pattern formation or other developmental outcomes (i.e., by using a specific gene’s expression as a marker of a certain cell type or region), one must use three types of experiments to determine causal relationships leading to the outcome. First, a causal protein or event can be proposed if its spatiotemporal expression is correlated with the location and timing of a developmental event (Darnell, 2005). Second, if inhibition of an event or failure to express a protein in the normal area leads to a loss of function, this indicates that it was necessary (Darnell, 2005). Third, if an event can be generated or a protein can be expressed ectopically and the function initiates, we can conclude it is sufficient. Thus, through the use of markers and experimental manipulation, a cause and effect relationship can be demonstrated.
Development of Body Axes
An important phenomenon identified in the early development of all model organisms concerns the formation of embryonic axes (Gilbert, 2000). Embryos develop three axes that become the foundation of the body: anterior-posterior, dorsal-ventral, and right-left (Gilbert, 1997). The anterior-posterior or anteroposterior (AP) axis extends from head to tail. The dorsal-ventral (dorsoventral) axis extends mediolaterally or from back to belly. The right-left axis separates the two lateral sides of the body.
To generate regional specificity, patterning along the AP axis subdivides the central nervous system (CNS) into prosencephalon (forebrain), metencephalon (midbrain), rhombencephalon (hindbrain), and spinal cord. During CNS induction, signals are primarily secreted by the organizer that neighbors a homogeneous epithelial sheet of ectoderm (outer layer of cells producing the nervous system and the epidermis) (Darnell, 2005). These secreted signals induce the dorsal ectodermal cells to elongate and form a prospective neural region called the neural plate. To generate regional specificity along the dorsoventral axis, the neural plate is patterned by the dorsal mesoderm (middle layer of cells giving rise to organs, connective tissues, and blood cells) and epidermal ectoderm (cells of the ectoderm giving rise to the epidermis) (Darnell, 2005; Gilbert, 1997). From the neural plate, the ectoderm folds to form a neural tube (Darnell, 2005). As the neural tube forms, the initial neuroectoderm (cells of the ectoderm giving rise to the nervous system) is induced and becomes rostral in character, either by default or due to the presence of primary rostralizing signals (Spemann and Mangold, 1924). This initiation of events propagates a number of regions to form anteroposteriorly and dorsoventrally, thus launching the cascade of specialization that gives rise to the CNS. The CNS is patterned after plate formation and is revealed after tube formation. The neural tube initiates patterning of the future CNS at the rostral end. Though the AP patterning cascades of the midbrain and hindbrain are well defined (Darnell, 2005), the control of AP patterning in the forebrain and spinal cord are not, and the initial subdivision between head and trunk, the first patterning event in the CNS, has not been well characterized.
The AP Axis: Development of the Nervous System
The specific AP patterning of the neuroectoderm succeeds the formation of a neural tube by dividing into head and trunk regions and develops anatomically visible subdivisions that express forebrain, midbrain,
hindbrain, and spinal cord phenotypes (Figure 1). The uppermost anatomical subdivision of the brain is known as the forebrain. The forebrain forms the telencephalon (rostral forebrain) and the diencephalon (caudal forebrain) (Darnell, 2005). The rostral forebrain ultimately structures the cerebral hemispheres, including the cerebral cortex, olfactory cortex and bulbs, hippocampus, and basal ganglia (Darnell, 2005). The caudal forebrain, divided into anterior parencephalon and posterior synencephalon, forms the rostral thalamus and caudal hypothalamus, respectively (Darnell, 2005). Definitive markers defining anatomical subdivisions in the forebrain have not yet been identified.
Caudal to the forebrain, the midbrain is defined by gene expression markers and anatomically as a bulge in the neural tube. Its lumen eventually becomes the cerebral aqueduct. The dorsal midbrain contributes to the superior and inferior colliculi, whereas the ventral midbrain forms the substantia nigra (Darnell, 2005). Through protein marker expression of Wnt-1 (Bally-Cuif et al., 1995) and anatomical identification, the isthmus has been identified as the boundary between the midbrain and hindbrain (Gilbert, 2000). Caudal to the isthmus, the hindbrain becomes subdivided into an anterior metencephalon and a posterior myelencephalon. The metencephalon gives rise to the cerebellum, the part of the brain responsible for coordination of movements, posture, and balance. The myelencephalon becomes the medulla oblongata whose neurons regulate respiratory, gastrointestinal, and cardiovascular movements. The complex patterning of the early hindbrain is characterized by its anatomically identifiable rhombomeres (Gilbert, 2000). Rhombomeres (r) 1-7 form as individual bulges that are more rostral in character, whereas r8 forms at the caudal end of the hindbrain along the first 5 somites of the spinal cord (Darnell, 2005).
Development of the hindbrain is called segmentation (Darnell, 2005). The mechanism of segmentation in Drosophila melanogaster, where the concept was first molecularly investigated, involves the regulation of development by transcription factors called gap genes and pair-rule genes which are both regulated by morphogen gradients (Darnell, 2005). A similar segmentation scheme appears to function in the hindbrain where a transcription factor, Krox-20, is expressed solely in r3 and r5 and is separated by gap genes in segments r2, r4, and r6 (Nieto et al., 1991). As a result, vertebrate hindbrain development involves gap-rule genes, which specify positional transcription factors that determine the phenotype and location of each rhombomere segment (Nieto et al., 1991).
Caudal to the hindbrain, the spinal cord develops as an extension of the hindbrain initiated by Wnt and FGF signals secreted from a caudal source (Alvarez et al., 1998; Bally-Cuif et al., 1995). These signals serve as transcription factors that provide positional information regarding the developmental divisions of the spinal cord (cervical, thoracic, lumbar, and sacral) patterned in a rostral to caudal manner. An early step in AP patterning is to establish where the head to trunk boundary is positioned or where the separation of the anterior (head) from the posterior (trunk) region occurs.
The Models of Head/Trunk Pattern Formation
Figure 1. Early Chick Embryo Nervous System Development (adapted from Gilbert, 1997)
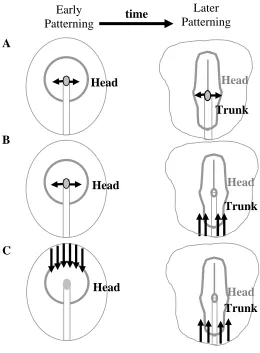
Figure 2. Developmental Pattern Formation Models (adapted from Darnell, 2005)
(A) The Spemann and Mangold (1924) model proposes that cells in the early organizer induce and pattern rostral neural regions, whereas this organizer is replaced with cells that pattern trunk neuroectoderm at later stages. Hence, the organizer shifts from rostral induction to caudal induction through a temporal and spatial model (Spemann and Mangold, 1924). (B) The Nieuwkoop (1952) model proposes that a non-organizer source can transform rostral neuroectoderm into more caudal neuroectoderm. This model relies on the transformation of more caudal cells in the head region into trunk neuroectoderm after initial patterning of head by the organizer (Nieuwkoop et al., 1952). (C) The Saxen and Toivonen (1989) model proposes that opposing gradients of morphogens established appropriate AP patterning. This model claims that head and trunk formation seem to depend on antagonistic gradient mechanisms (Saxen, 1989).
upper blastopore lip—180˚ opposite the point of sperm entry into the ovum—induces a well patterned neural axis in amphibian embryos (Spemann and Mangold, 1924). They identified this region as an organizer, a group of cells that is sufficient to induce and pattern naive tissue, but which does not participate directly in the formation of that tissue (Gilbert, 2000). Furthermore, Spemann (1931) determined that the organizer of younger embryos is sufficient to induce and pattern rostral neuroectoderm, whereas older embryo organizers could only induce the neural axis of the trunk. From these early amphibian experiments, he inferred that head and trunk are distinct early regional subdivisions established by the initiation of neural patterning by temporally different organizer activity (Spemann, 1931).
The initial modelers of developmental biology agreed that the head neuroectoderm was the primary state in tissue interactions establishing head and trunk, but they differed in their ideas of how trunk neuroectoderm formed (Figure 2). Spemann and Mangold (1924) propose that cells in the early organizer induce and pattern rostral neural regions, and this organizer is replaced with cells that pattern trunk
neuroectoderm at later stages (Figure 2A). In their view, the organizer shifts from rostral induction to caudal induction through a temporal and spatial model (Spemann and Mangold, 1924). Nieuwkoop and collaborators (1952) proposed that a non-organizer source can transform rostral neuroectoderm into more caudal neuroectoderm (Figure 2B). This model relies on the transformation of more caudal cells in the head region into trunk neuroectoderm after initial patterning of the head by the organizer (Nieuwkoop et al., 1952). Finally, Saxen (1989) proposed that opposing gradients of morphogens establish appropriate AP patterning (Figure 2C). They claimed that head and trunk formation seem to depend on antagonistic gradients in which the midbrain-hindbrain boundary is the intermediary state. Consequently, they developed a three-step model of neural patterning that integrates the Spemann-Mangold and Nieuwkoop mechanisms: 1) initiation by neural induction is rostral in character, 2) transformation generates the trunk region, and 3) the two separate states are maintained in order to differentiate between head and trunk (Saxen, 1989). Given the ideas of the initial modelers of development, a major difference between the models exists in the
Early
Patterning
time
Head
Head
Head
A
B
C
Later
Patterning
Head
Head
Head
Trunk
determination of whether a neural signal is secreted by the organizer or whether a caudalizing signal from another source transforms previously induced rostral neuroectoderm to caudal neuroectoderm by an antagonistic or competitive manner (Darnell, 2005). Interestingly, evidence supports all of these models in the AP patterning of the nervous system (Gilbert, 2000).
The Head to Trunk Boundary
Traditional embryology included the forebrain, midbrain, and hindbrain in the head region, whereas the spinal cord was designated the trunk region (Gilbert, 1997). However, recent research reveals that the forebrain and midbrain are in some ways distinct from the hindbrain and spinal cord. These data were collected by using transcription factors as positional information (Acampora et al., 1998; Simeone, 1998). In terms of gene expression, the head neuroectoderm, including forebrain and midbrain expresses head transcription factors (i.e. Otx-2 (Millet et al., 1996)) as positional information and is dependent on head-inducing signaling factors for its formation (Epstein et al., 1997). Therefore, this region of the head is distinct from the hindbrain and spinal cord. In contrast, the spinal cord is clearly patterned by Hox genes (Grapin-Botton et al., 1997) as an extension of the hindbrain and is dependant on several caudalizing factors, including Wnt (Bally-Cuif et al., 1995) and FGF (Alvarez et al., 1998), for its formation that are antagonistic to head formation. Therefore, the new model for the head includes forebrain and midbrain, whereas trunk includes hindbrain and spinal cord.
An embryo matures in a rostral to caudal fashion. Subsequently, more rostral structures are further along the developmental cascade than caudal structures (Darnell, 2005). The rostral or anterior state is defined as head, whereas the caudal or posterior state is defined as trunk. Hence, an early step in patterning is to establish the distinction between the head region and the trunk region. Soon thereafter, the neural plate forms a neural tube that further subdivides to form forebrain, midbrain, hindbrain, and spinal cord (Darnell, 2005). The exact location of where these divisions fall relative to the head to trunk boundary is unclear. Thus, the head to trunk division has become a long-standing controversy in the field. Little has been experimentally demonstrated regarding the exact location of the head to trunk boundary and at what stage, or time during development, these regions distinguish themselves.
Developmental Model Organisms (Chick Embryo)
Vertebrate neural pattern is currently understood through marker gene expression in a variety of model organisms including Xenopus laevis (frog), Mus musculus (mouse), Danio (Brachydanio) rerio (zebrafish), and Gallus domesticus (chicken) (Streit and Stern, 1999). Interestingly, many identified molecular pathways and cellular responses deriving from model organisms appear to be conserved between all vertebrates (Darnell, 2005).
The chick (avian) embryo, the model system of this study, provides an excellent way of studying the development of higher vertebrates because it resembles the human blastoderm (flat, disk-like structure that expands during gastrulation) at early stages (Darnell and Schoenwolf, 2000a). The blastoderm has been thoroughly fate mapped (e.g., ectoderm and mesoderm (Schoenwolf et al., 1992); Figure 3) and locations of progenitor cells prior to
gastrulation (a series of cell rearrangements forming 3 germ layers), the temporal boundary of this study, are also well documented (Stern and Canning, 1990). In addition, the development of the chick embryo has been divided into recognizable stages (Hamburger and Hamilton, 1951) and used extensively as a model system for the evaluation of tissue interactions involved in early developmental events (Sanes, 1992). It also has many practical advantages because it can be purchased inexpensively in any specified quantity and does not require a special storage facility (Darnell and Schoenwolf, 2000a).
At the time the egg is laid, the avian embryo consists of a two-layered blastoderm on the surface of the yolk. These eggs are easily accessible and can be incubated at 38˚ C to any stage of interest (Darnell and Schoenwolf, 2000a). Within 48-72 hours of laying, chick embryos gastrulate, neuralate, and develop into organisms with complex nervous systems (Darnell and Schoenwolf, 2000a). Their rapid development provides immediate data collection (Darnell and Schoenwolf, 2000a). Furthermore, chick embryos can be removed from their shell and cultured. Since they are semi-transparent, their organs and tissues can be viewed under a microscope, and anatomical structures can be microsurgically manipulated. After microsurgical manipulation, this model system can be transfected with corresponding genes or mRNA allowing one to localize specific protein function (Darnell and Schoenwolf, 2000a). Consequently, a wealth of information exists on normal and abnormal development of the early chick embryo that allows one to assess gene expression and identify tissue interactions important to its early development.
Thus, the chick embryo is the most advanced model organism suitable for experimental embryology. The chick represents the model system which most resembles higher vertebrates while still permitting experimental intervention in vivo. In addition, the chick embryo is accessible during important developmental stages that allow one to analyze the genetic regulation of many different developmental processes.
Development of the Organizer (Hensen’s Node) in the Chick Embryo
In the developmental cascade forming the chicken embryo, cleavage occurs immediately following fertilization. During this stage, a series of mitotic divisions reduce the volume of zygote cytoplasm into smaller cells, called blastomeres, as the egg passes through the reproductive tract. According to Wolpert and colleagues (1998), contraction and secretion in the oviduct rotates the eggshell and albumen, its most abundant protein, 10-12 revolutions per hour for the duration of 20 hours. However, the yolk remains fixed due to gravity so that the rotation of the eggshell and albumen is relative to the yolk. This orientation shifts the yolk so that its lighter components lie beneath one side of the blastoderm (the component of blastomere cells) (Wolpert et al., 1998). This side of the blastoderm eventually becomes the posterior marginal zone (PMZ) and initiates gastrulation. Gastrulation is the highly coordinated process of blastoderm rearrangement which accounts for the formation of body axes, including the AP axis, and three cell layers—ectoderm, mesoderm, and endoderm.
Figure 3. Fatemap (adapted from Schoenwolf et al., 1992)
Fatemap depicts location of differentiated cells and tissue for developmental stages 3a-b, 4, and 8, respectively (EE, extra-embryonic ectoderm; NP, neural plate; MHP, median hinge point; PM, paraxial mesoderm; CM, cardiac mesoderm; LPM, lateral plate mesoderm; EEM, extra-embryonic mesoderm; OP, olfactory placode; HM/NO, head mesenchyme/notochord; E, endoderm; H, hypoblast; N, Hensen’s node; PS, primitive streak).
neural tissue competence is assigned by fibroblast growth factor (FGF) signals originating from the PMZ of the blastoderm. The FGF signals emanating from the PMZ activate tyrosine kinase receptors on the cell membranes of responding cells to permit a neural fate. Furthermore, this acquisition of neural fate (by embryonic ectodermal cells) from emanating signals by the PMZ involves the intensification of FGF signaling along with the attenuation of bone morphogenetic protein (BMP) (Wilson et al., 2001). However, FGFs in combination with BMP antagonists are not sufficient to induce neural fate in ectodermal tissue. Another signal, Wnt, is also a critical determinant of neural fate. The Wnt signals comprise a family of cysteine-rich glycoproteins derived from fifteen genes in vertebrates (Gilbert, 2000). A lack of epiblast (one of the two layers of cells present in the early embryo) cell exposure to Wnt signals allows FGF to induce a neural fate (Wilson et al., 2001).
In the formation of the organizer, the epiblast and middle layer cells of Koller’s sickle become Hensen’s node, the organizer equivalent to chicken known as the Spemann-Mangold organizer to amphibians (Streit and Stern, 1999). Therefore, the
development of some aspects of organizer function begins prior to formation of the primitive streak (the major structural characteristic of early chicken embryos) in the vicinity of Koller’s sickle (Stern and Canning, 1990). However, in order to form a fully functional organizer, spatiotemporal patterning requires posterior and central epiblast to merge at midstreak stages (3c/d) (Hamburger and Hamilton, 1951; stage 3 modified by Darnell et al., 1999) to express neuroectoderm (Yuan et al., 1995a; Yuan et al., 1995b; Yuan and Schoenwolf, 1999). Furthermore, extirpation studies indicate that neural tissue at stage 3d, but not 3c, was able to self differentiate when cultured in isolation (Darnell et al., 1999). Thus, the fully functional organizer forms during blastulation and early gastrulation when the midstreak (primitive streak) develops.
Development of another Organizer in Chick: The ADE
The development of the organizer is responsible for spatiotemporal arrangements of early embryonic tissues. However, several regions of the early embryo other than Hensen’s node could potentially contribute to head and trunk or AP patterning (Figure 4). The region
EE
NP
MHP
PM
CM
LPM
EEM
OP
HM/NO
E
H
N
PS
Stage 3a-b
Stage 4
Stage 8
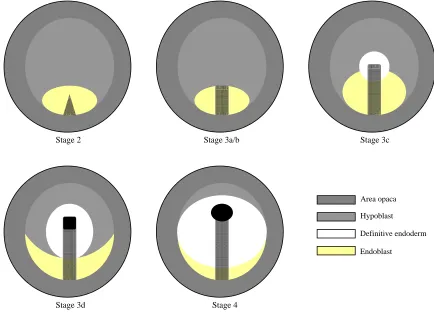
Figure 4. Early Chick Embryo Stages (Hamburger and Hamilton, 1951; stage 3 modified by Darnell et al., 1999)
At stage 2, a short, triangular streak forms in the caudal part of the embryo. At stages 3a-b, the streak elongates into a narrower, linear streak that does not reach the center of the area pellucida (the widest zone across the right/left axis). At stage 3c, the grooved streak elongates further reaching the center of the area pellucida (stage 3d is characterized by a rostral extension of the streak beyond that point). Furthermore, the morphological character of the ectoderm changes. Definitive endoderm begins to form by a polonaise movement, rostrally and laterally around the rostral end of the primitive streak (cells comprising the organizer specifying neural tissue); (Chapman et al., 2003). Hypoblast and endoblast are displaced to the rostral and caudal poles of the embryo, respectively (Chapman et al., 2003). At stage 3d, neural specification onset and initial ingression of Hensen’s node occurs. At stage 4, maximum streak extension by a noticeable swelling indicates the complete ingression of the node.
able to produce organizing-like signals includes a host of central epiblast (CE) cells (Darnell et al., 1999; Healy et al., 2001). This CE population is rostral to the primitive streak between stages 2-3b. As the primitive streak extends forward between stages 3c-4, the CE population becomes integrated into the streak and node (Joubin and Stern, 1999).
Another anterior signaling center in mammals, separate from the organizer, is called the anterior visceral endoderm (AVE), and it is necessary for head formation (Beddington and Robertson, 1998; Camus and Tam, 1999). Cells from the early embryo organizer in chick share head inducing qualities with the mammalian AVE that are sufficient to produce rostral neural formation (Darnell, 2005). The AVE appears to be another source secreting head inducers in the development of an embryo.
Chapman and collaborators (2003) elucidated a region similar to the AVE in chick. They identify this region as the hypoblast, which can induce early head pattern (stages 2-3b) formation and gene expression. Furthermore, they portray that other tissues with organizing ability comprise the lower layers of hypoblast and anterior definitive endoderm (ADE) or rostral endoderm. They also depict that anterior positional identity is established and maintained in the
CE by hypoblast at stages 3a-b and rostral endoderm at stages 3d-4 (Chapman et al., 2003). An explanation for this occurrence is that Hensen’s node is able to act as a head and trunk organizer, with spatiotemporally separated signals. In this view, the early head organizer produces neural identity in the ectoderm, the late organizer produces more caudal neural identity, and anterior identity is stabilized by inductive interactions between the hypoblast and anterior definitive endoderm (ADE). This model of organizer development correlates most closely with the Spemann and Mangold (1924) model of head to trunk transition. An alternative explanation is that the rostral head organizer (CE/hypoblast), separate from the node, begins head induction and patterning, and then it merges with the node and is modified by other signals, becoming the trunk organizer at later stages. This model resembles the current mouse model and the model proposed by Saxen and Toivonen (1989).
The Contribution of Organizers to Head/Trunk Axial Pattern
Once a head organizer is established, the mechanism for converting to a trunk organizer is not well defined. The AP identity of the mammalian brain vesicles and spinal cord is specified during gastrulation by Stage 2
Stage 4 Stage 3d
Stage 3c Stage 3a/b
Area opaca
Hypoblast
Definitive endoderm
mesoderm, the middle cell layer giving rise to heart, kidneys, gonads, bone, muscles, tendons, blood vessels, blood cells, and notochord (transient mesodermal ‘backbone’ essential for initiating dorsoventral nervous system differentiation), following the formation of Hensen’s node (Gilbert, 2000). This specification is stabilized at the neural plate stage by interactions within the plane of the ectoderm (Gilbert, 2000). Consequently, some signaling interactions must be responsible for the transition from head mesoderm to trunk notochord production and changes in Hensen’s node that exhibit this differentiation into trunk.
Darnell and colleagues (1992) revealed that in the absence of Hensen’s node, AP patterning of the CNS occurs. It was later demonstrated that the head to trunk transition is regulated by Hensen’s node in response to signals from the rostral endoderm (Darnell et al., 1999) and midstreak (Yuan et al., 1995b), which was identified as containing the capacity to induce a new node in the case that the node was removed (Yuan et al., 1995a). Moreover, Yuan and colleagues (1995) demonstrated that a region of the blastoderm located at the middle of the primitive streak can influence node differentiation (Yuan et al., 1995a; Yuan et al., 1995b) and is quite possibly involved in the head to trunk transition (Healy et al., 2001).
Furthermore, the formation of notochord from node was associated with the head to trunk transition due to morphological differences of notochord in head and trunk levels (Healy et al., 2001). Healy and colleagues (2001) performed notochord assays to assess the timing of the head to trunk transition. In the absence of the midstreak, rostral isolates containing the node form dots of notochord (associated with head differentiation) that resemble stages 3a-b isolates excluding the node. They also determined that notochord cells do not form an elongated rod (associated with trunk notochord). Therefore, the node may be a head organizer at these stages. At stages 3c-d, rostral isolates excluding the node fail to express any notochord (Healy et al., 2001), which is supported by evidence that notochord cells are derived from the node at stages 3c-d (Stern and Canning, 1990; Schoenwolf et al., 1992). Thus, young nodes (stages 3a-b) produce endodermal cells of the head, whereas older nodes (stages 3c-d) produce notochord. Moreover, inclusion of the midstreak and node in rostral region isolates at stage 3c yield an elongated notochord resembling stage 4/4+ isolates excluding or including the midstreak region (Healy et al., 2001). These findings indicate that the head to trunk transition is complete by stage 4/4+, and the node and midstreak are involved in this transition.
The initiation of notochord production that highlights the head to trunk transition must be regulated. Dias and Schoenwolf (1990) support this notion through Spemann-like ectopic grafts that induce head and trunk neuroectoderm from younger nodes, whereas older nodes induce only trunk neuroectoderm. Therefore, the initiation of notochord production is correlated with the transition from head to trunk neuroectoderm either by the Spemann and Mangold (1924), Nieuwkoop (1952), or Saxen and Toivonen (1989) model of neural patterning.
Localizing the Head to Trunk Boundary in the Chick Embryo
Early neural patterning begins in an anterior head state, and an early step in patterning is the spatial separation of the head and trunk regions. The tissues involved in
the boundary formation of head and trunk remains an issue. Darnell (1992) demonstrated that transection through Hensen’s node at stage 4, when trunk notochord formation begins, physically separates the prospective midbrain and hindbrain in the developing neuroectoderm (Darnell, 1992; Darnell and Schoenwolf, 1997). These results introduced the long-standing controversy about whether the head to trunk transition occurs at the traditional embryological boundary between the hindbrain and spinal cord or the boundary that occurs between the midbrain and hindbrain which uses transcription factors as positional information, or even another location.
The model of a single head and trunk organizer that forms during chick gastrulation does not fit with recent observations. These observations raise spatiotemporal problems with attributing head and trunk division solely to Hensen’s node because the mediation of signals regulating the head to trunk transition of the nervous system remains unclear. We aimed to: 1) elucidate the caudal head boundary, 2) elucidate the rostral trunk boundary, and 3) evaluate the spatiotemporal interactions regulating the initial induction and subdivision of head/trunk axial pattern. We used gene expression markers of the midbrain (DMBX) and hindbrain (X37) to evaluate the aforementioned interactions. We hypothesize that the head to trunk transition occurs at the midbrain-hindbrain boundary at stage 4/4+ due to inductive signals received from the midstreak (influencing Hensen’s node) and the head organizer.
We use gene expression markers of the midbrain (DMBX) and hindbrain (X37) to elucidate the location of the head to trunk boundary through microsurgical manipulations and in situ hybridization analyses of gene expression assays. DMBX (Dmbx1) (Gogoi et al., 2002) is a paired-type homeobox gene that is highly related to a family of neuronal markers known as the Otx genes. Expression of DMBX initiates during gastrulation, when transcription factors are detected in a cleft located at the anterior neural plate (Gogoi et al., 2002). DMBX marks the prospective midbrain throughout development with the rostral border occurring at the parencephalic-synencephalic boundary and the caudal border occurring at the isthmus of the midbrain-hindbrain boundary (Gogoi et al., 2002). Alternatively, X37 (Bell et al., 2004) is a gene expressed in the caudal hindbrain of the developing chick. Its expression has not been thoroughly characterized. Through the use of gene expression markers for DMBX and X37, we evaluated the spatiotemporal interactions regulating the head to trunk transition.
Results
We hypothesize that the head to trunk transition occurs at the midbrain-hindbrain boundary at stage 4/4+ due to inductive signals received from the midstreak (influencing Hensen’s node) and ADE. We use gene expression markers of the midbrain (DMBX) and hindbrain (X37) to elucidate the location of the head to trunk boundary through microsurgical manipulations and ISH analyses of gene expression assays.
DMBX is Expressed in the Midbrain
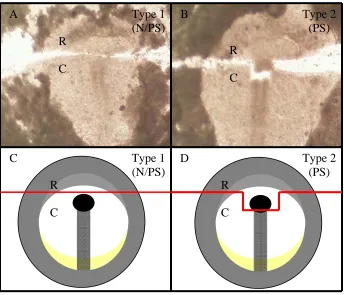
Figure 5. Type 1 and Type 2 Transections
Transections were performed on chick gastrula, and are labeled to indicate the embryonic tissue types they include in the caudal fragment. Rostral and caudal blastoderm fragments were cultured immediately following microsurgical manipulation for 24 h, and in situ hybridization (ISH) analyses detected probe-expressing neuroectoderm. Rod-like feature depicts primitive streak (PS) with Hensen’s node (N) confined to the rostral-most region of the PS. (A) Type 1 transections include N. (B) Type 2 transections do not include N. (C, D) Cartoon depictions of type 1 and type 2 transections, respectively, with red line depicting transection. R: rostral; C: caudal.
Figure 6. DMBX Expression and Midbrain Formation
The diagram indicates the expression of DMBX (black) and the time course of boundary formation in the developing chick midbrain. F: forebrain; M: midbrain; H: hindbrain.
subdivision of head/trunk axial pattern. Since head neuroectoderm including forebrain and midbrain expresses head transcription factors (i.e. Otx-2 (Millet et al., 1996)) as positional information and is dependent on head-inducing signaling factors for its formation (Epstein et al., 1997), the forebrain and midbrain regions of the head are distinct from the hindbrain and spinal cord in terms of gene expression. Therefore, we
characterized the expression of the marker, DMBX, which is expressed solely in the midbrain. In utilizing this gene marker as an evaluator of the head to trunk boundary transition, its expression can be used to demonstrate that midbrain is present.
The stage of midbrain marker expression must occur between stages 9-10 (33-40 h) to allow embryos to be evaluated after 24 hours of microsurgical
F
M
H
Stage 6 Head-Fold
Stage 7 1 somite
Stage 8 4 somites
Stage 9 7 somites
Stage 10 10 somites
Stage 11 13 somites
Type 1
(N/PS)
Type 2
(PS)
R
C
R
C
R
C
R
C
A B
C D
Type 1
(N/PS)
manipulation culture. DMBX expression was detected prior to the 1 somite stage (stage 7 of Hamburger-Hamilton stage series, 1951) and continued beyond the 13 somite stage (stage 11 of Hamburger-Hamilton stage series, 1951) (Figure 6). These are minimal estimates in view of the limited sensitivity of ISH. Through ISH, DMBX marked the prospective midbrain caudal to the forebrain and rostral to the isthmus of the midbrain-hindbrain boundary (Figure 7A). The previously characterized pan-neural marker Otx-2 (Millet et al., 1996), which expresses head transcription factors as positional information and is dependent on head-inducing signaling factors for its formation, was used as the control embryo for ISH (not shown). Furthermore, DMBX-expressing embryos were labeled with notochord marker Not-1 via immunocytochemistry (ICC) caudal to the midbrain (Figure 7B). Not-1 served as a rostrocaudal positional reference to DMBX expression. Not-1 has been characterized as an epitope expressed only in the notochord (Yamada et al., 1991), and it labeled this transient vertebrate embryonic structure. Next, transverse sections through DMBX-expressing embryos were performed in order to elucidate the dorsoventral pattern of midbrain expression, which depicted uniform neural tube labeling throughout the midbrain (Figure 7C). Finally, transverse sections were labeled with Not-1, which depicted notochord extending ventral or deep to neural tube labeling of the midbrain (Figure 7D). Thus, we established that DMBX is expressed at the appropriate stages and location to serve as a marker for the midbrain of the early chick embryo.
Figure 7. Characterization of DMBX
(A) A control embryo at stage 11 was labeled with DMBX (blue) via ISH. Gene expression is shown caudal to the forebrain, and rostral to the isthmus of the midbrain-hindbrain boundary. (B) Embryo shown in A was labeled with notochord marker Not-1 (red) via immunocytochemistry (ICC). Notochord labeling is shown caudal to the midbrain. (C) Transverse section through a control embryo at stage 11 was labeled with DMBX. Uniform neural tube labeling is shown. (D) Transverse section through embryo shown in B. Notochord labeling is shown extending posterior to neural tube labeling with DMBX at the midbrain level.
The Caudal Head Boundary Occurs Caudal to the Midbrain (Type 1 Experiments)
Next, we used DMBX to elucidate the location of the caudal head boundary. Prior to stage 3c, some organizer features (the ability to induce neural plate)
are not confined to the rostral primitive streak but are located in the blastoderm (Darnell et al., 1999). To assess the stage at which prospective neuroectoderm can form head independently of the organizer and thus elucidate the spatiotemporal interactions regulating head/trunk axial pattern, we transected blastoderm rostral to the primitive streak at stages 2 through 3b. In type 1 experiments transected at stages 2-3b (Figure 5A, Figure 5C), we detected expression of DMBX in 9/9 (100%) cases of rostral isolates after culture (Figure 8A, Figure 8B, Table 1). Thus, the rostral primitive streak, including the node, is not required for formation of head and therefore, the caudal head boundary occurs caudal to the midbrain as indicated by midbrain expression of DMBX transected at stages 2-3b.
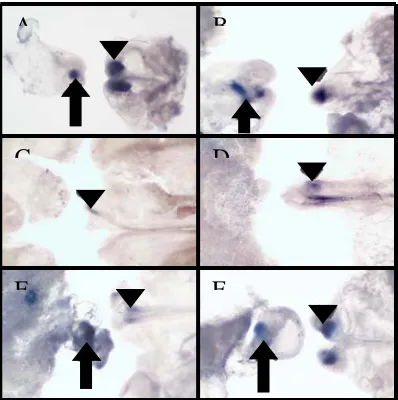
Figure 8. Transections Cultured and Labeled with DMBX by ISH
Rostral fragments are to the left and caudal fragments are to the right. (A-B) Type 1 embryos transected at stages 2-3b. All cases expressed DMBX in both rostral (arrow) and caudal (arrowhead) fragments indicating that Hensen’s node is not required to induce and pattern midbrain neuroectoderm at these stages. (C-D) Type 1 embryos transected at stages 3c-4. Embryos do not show any DMBX expression in the rostral fragment indicating the node is sufficient to induce midbrain neuroectoderm at these stages. (E-F) Type 2 embryos transected at stages 2-4. All embryos expressed DMBX in the rostral fragment, thus acting as the positive control demonstrating that the node is able to induce midbrain neuroectoderm at these stages.
In contrast, cultured rostral isolates failed to express DMBX when embryos were transected at stages 3c through 4 since we detected expression of DMBX in only 2/20 (10%) cases of rostral isolates after culture (Figure 8C, Figure 8D, Table 1). Since organizer activity, including the ability to form head, was not detected in the rostral blastoderm of embryos transected subsequent to stage 3c, these rostral fragments were used as negative controls for type 2 experiments. Moreover, cells that can express midbrain markers when embryos are transected at stages 2-3b in the rostral fragment are not committed (a step in development from which these cells do not go back). Thus, it seems the patterning signal is present rostral to the node, but it is not sufficient to maintain the pattern throughout early differentiation, and/or that the rostral signal is lost from the rostral region at stage 3c.
A
B
C
A
B
C
D
Table 1. Transections at various stages including or excluding Hensen’s nodea
Transections
experiment RBF CBF
type Probe Stages Neur/totalb Neur/totalb
Type 1 DMBX 2-3b 9/9 9/9 N/PS 3c 6/8 8/8 3d-4 2/20 20/20
Type 2 DMBX 2-3b 5/5 5/5 PS 3c 4/4 4/4 3d-4 9/9 9/9
Type 1 X37 2-3b 0/3 3/3 N/PS 3c 0/1 1/1
3d-4 0/4 4/4
Type 2 X37 2-3b 0/0 0/0 PS 3c 1/1 1/1 3d-4 3/3 3/3
a
N, node; PS, primitive streak; RBF, rostral blastoderm fragment; CBF, caudal blastoderm fragment.
b
Number of isolates that labeled neuroectoderm with neural markers per total number of isolates.
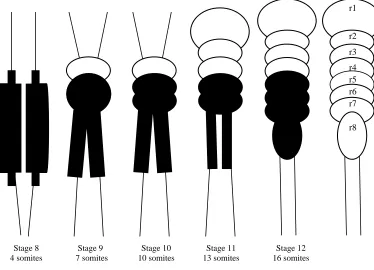
Figure 9. X37 Expression and Caudal Hindbrain Formation
The diagram indicates the expression of X37 (black) and the time course of boundary formation in the developing chick midbrain. r: rhombomere.
Planar Signals are Sufficient for Head Formation (Type 2 Experiments)
Subsequently, we further assessed spatiotemporal interactions regulating head/trunk axial pattern. Given that the blastoderm rostral to the primitive streak is unable to form head when isolated after stage 3c, we assessed head formation by performing type 2 experiments (planar inclusion of the rostral primitive streak (200 µm) in rostral fragments) that included Hensen’s node in rostral isolates (primitive streak in caudal fragments excludes the node) after stage 3c (Figure 5B, Figure 5D). In these cases, the rostral
blastoderm is sufficient for head formation in 9/9 (100%) cases of rostral isolates (Figure 8E, Figure 8F, Table 1). This result indicates that Hensen’s node was sufficient to induce neuroectoderm at this stage, and the caudal region of the primitive streak was not required for rostral head induction or maintenance after stage 3c as long as the node was in planar contact with the rostral blastoderm.
X37 is Expressed in the Caudal Hindbrain
Our next goal was to select a gene expression marker that would serve as a positional marker for elucidation Stage 8
4 somites
Stage 9 7 somites
Stage 10 10 somites
Stage 11 13 somites
Stage 12 16 somites
r1
r2
r3
r4
r5
r6
r7
of the rostral trunk boundary and the spatiotemporal interactions regulating the initial induction and subdivision of head/trunk axial pattern.
Since trunk neuroectoderm including hindbrain and spinal cord is antagonistic to head formation and is dependant on several caudalizing factors (i.e. Wnt (Bally-Cuif et al., 1995); FGF (Alvarez et al., 1998)) for its formation, the hindbrain and spinal cord regions are distinct from the forebrain and midbrain regions of the head in terms of gene expression. Therefore, we characterized the expression of the marker, X37, which is expressed solely in the caudal hindbrain. In utilizing this gene marker as an evaluator of the head to trunk boundary transition, its expression can be used to demonstrate that caudal hindbrain is present.
The stage of hindbrain marker expression must occur between stages 9-10 (33-40 h) to allow embryos to be evaluated after 24 hours of microsurgical manipulation culture. X37 expression was detected prior to the 1 somite stage (stage 7 of Hamburger-Hamilton stage series, 1951) and continued throughout the 16 somite stage (stage 12 of Hamburger- Hamilton stage series, 1951) (Figure 9). These are minimal estimates in view of the limited sensitivity of ISH. Through ISH, X37 marked the prospective hindbrain caudal to rhombomere 4 and rostral to somite 1 of the spinal cord (Figure 10A, Figure 10B). The previously characterized rhombomere marker, Krox-20 (Nieto et al., 1999), which induces Hox genes as positional information (Grapin-Botton et al., 1997) and is dependent on caudalizing signaling factors for its formation, was used as the control embryo for ISH (not shown). Thus, we established that X37 is expressed at the appropriate stages and location to serve as a marker for the caudal hindbrain of the early chick embryo.
Figure 10. Characterization of X37
(A) A control embryo at stage 8 was labeled with X37 (blue; black arrow) via ISH. Gene expression is shown in the caudal hindbrain, and rostral to somite 1 of the spinal cord. (B) A control embryo at stage 9+/10 depicting labeling as aforementioned in A.
The Rostral Trunk Boundary Occurs Rostral to the Caudal Hindbrain (Type 1 Experiments)
Next, we used X37 to elucidate the location of the rostral trunk boundary. To assess the stage at which prospective neuroectoderm can form trunk and thus elucidate the spatiotemporal interactions regulating head/trunk axial pattern, we transected blastoderm rostral to the primitive streak at stages 2 through 4. In
type 1 experiments transected at stages 2-3b (Figure 5A, Figure 5C), we detected expression of X37 in 3/3 (100%) cases of caudal isolates after culture, but X37 failed to express in rostral isolates (Figure 11A, Figure 11B, Table 1). Furthermore, in embryos transected at stages 3c through 4, a similar pattern of X37 expression was detected, where 4/4 (100%) cases of cultured caudal isolates expressed X37, but X37 again failed to express in rostral isolates after culture (Figure 11C, Figure 11D, Table 1). Thus, the rostral primitive streak, including the node, is required for formation of caudal hindbrain. The rostral head organizer is not sufficient to induce this level as indicated by the failure of caudal hindbrain expression of X37 in cultured rostral isolates transected at stages 2-4, indicating that the caudal hindbrain is not part of the head. Moreover, it seems that the patterning signal for the caudal hindbrain is present at or caudal to the node and is sufficient to maintain the pattern throughout early differentiation.
Figure 11. Transections Cultured and Labeled with X37 by ISH
Rostral fragments are to the left and caudal fragments are to the right. (A-B) Type 1 embryos transected at stages 2-3b. All cases expressed X37 in the caudal (arrow) fragments, but failed to express X37 in rostral fragments indicating that Hensen’s node is required to induce and pattern caudal hindbrain neuroectoderm at these stages. (C-D) Type 1 embryos transected at stages 3c-4. Embryos show the aforementioned pattern of expression. (E-F) Type 2 embryos transected at stages 3c-4. All embryos expressed X37 in the rostral fragment, thus acting as the positive control demonstrating that the node is able to induce caudal hindbrain neuroectoderm at these stages.
Hensen’s Node is Sufficient for Trunk Formation (Type 2 Experiments)
Finally, we assessed spatiotemporal interactions regulating head/trunk axial pattern. We assessed whether blastoderm rostral to the primitive streak is able to form trunk by the planar inclusion of the rostral primitive streak (200 µm) in rostral fragments that included Hensen’s node in rostral isolates (primitive streak in caudal fragments excludes the node) at stages 2 through 4 (Figure 5B, Figure 5D). In these cases, the rostral blastoderm is sufficient for trunk formation in 4/4 (100%) cases of rostral isolates (Figure 11E, Figure 11F, Table 1). This result indicates that Hensen’s node was sufficient to induce caudal
A B
C D
hindbrain at these stages, and the caudal region of the primitive streak was not required for caudal hindbrain induction or maintenance after stage 3c as long as the node was in planar contact with the rostral blastoderm. It has not been tested whether more caudal regions of the spinal cord require additional caudalizing signals.
Discussion
A defining feature of organizer activity and early axis formation is the induction of the neuroectoderm (Darnell et al., 1999). However, the precise timing and mechanism of neuroectoderm formation in amniotes has not yet been determined. Induction of the neural plate requires that tissue becomes competent, and this competence apparently occurs between Hamburger-Hamilton (HH) stages 2 and 4 (Darnell et al., 1999). Once such competence is established, interactions by diffusible signaling molecules from adjacent tissues lead to induction, which ultimately specifies the formation of neuroectoderm (Darnell et al., 1999). In this study, we focused directly on the regions responsible for the head to trunk boundary and the stages at which this transition occurs.
Localization of the Head to Trunk Boundary
We have provided evidence that the rostral primitive streak, including Hensen’s node, is not required for formation of head as indicated by midbrain expression of DMBX in rostral isolates transected at stages 2-3b. Since we show that a region rostral to the rostral primitive streak is sufficient to induce and pattern midbrain when excluded from Hensen’s node, the caudal boundary of the head region must occur caudal to the midbrain.
Furthermore, we have shown that the rostral primitive streak, including the node, is required for formation of trunk as indicated by the failure of caudal hindbrain expression of X37 in cultured rostral isolates transected at stages 2-4. Since we have shown that a region rostral to the rostral primitive streak cannot induce caudal hindbrain when excluded from Hensen’s node, the rostral trunk boundary should occur rostral to the caudal hindbrain.
Mootoosamy and Dietrich (2002) suggest that distinct regulatory cascades act in the development of trunk and head muscles, indicating that the head to trunk transition occurs rostral to somite 1 of the spinal cord since head mesoderm fails to read patterning cues in a somitic environment. Ultimately, our results, in accordance with other studies support the hypothesis that the head to trunk transition occurs at the midbrain-hindbrain boundary. However, the boundary could occur as caudal as the rostral extent of X37 (rhombomere 4). Additional experiments with rostral hindbrain markers are required to fine tune the rostral trunk boundary.
A Rostral Head Organizer Exists Prior to Stage 3c
Hensen’s node is located at the rostral end of the primitive streak and is capable of inducing and patterning both head and trunk at the extended-streak stage (when the primitive streak has completely elongated; stage 4 of HH stage series, 1951). We showed that midbrain formation occurred in the rostral fragment when the chick embryo is transected rostral to the node prior to stage 3c using a regionally restricted marker, DMBX. We concluded that Hensen’s node does not induce and pattern the rostral neuroectoderm prior to transection at stage 3b, since the rostral
primitive streak, including the node, was not required for formation of head as indicated by midbrain expression of DMBX transected at stages 2-3b. However, cultured rostral isolates failed to express DMBX when embryos were transected at stages 3c through 4. From this, we infer that a head organizer exists in the rostral region of the chick embryo separate from Hensen’s node that patterns midbrain in the absence of Hensen’s node prior to stage 3c.
The concept of head and trunk organizers crosses species and dates back to the initial modelers of developmental biology. Spemann (1931) originally proposed induction by head and trunk organizers for the amphibian embryo. The main idea was that the early organizer is a rostral head organizer capable of inducing only the head, whereas the later organizer, or more caudal organizer, induces the trunk (Spemann, 1931). In chick, it has been speculated that the spatially separate head organizer lies rostral to the node (Beddington and Robertson, 1999). Consistent with our results, a separate head organizer has been confirmed in chick embryos rostral to Hensen’s node (Darnell et al., 1999; Chapman et al., 2003).
Darnell and colleagues (1999) postulated that a region of CE cells is the location of a head organizing signal rostral to the primitive streak prior to stage 3c. Furthermore, the head organizing signal seems to be conserved throughout higher vertebrate development because a mammalian region similar to the CE exists (Darnell, 2005). We showed that midbrain is patterned by this head organizing signal using a regionally restricted marker, DMBX. We infer from our data that the head organizer signaling center, separate from Hensen’s node, is sufficient to produce rostral neural formation. Consequently, the head organizer of the chick is sufficient for midbrain formation in chick embryos prior to stage 3c.
Recent experiments in mouse have demonstrated a head organizer separate from the node located in the AVE which is required for the formation of forebrain (Camus and Tam, 1999). After disruption of the trunk organizer and primitive streak, the head organizer induces a normal forebrain and midbrain implying that the AVE acts as the head organizer rostral to the midbrain-hindbrain boundary (Camus and Tam, 1999). Chapman and colleagues (2003) depict that the mammalian region, called the AVE, shares early embryo head inducing qualities with the head organizer. As a result, the head organizer appears to be another source secreting head inducers and caudal antagonists in the development of mouse and chick embryos. They also reveal that anterior positional identity is established and maintained by the head organizer at stages 3a-b (Figure 4) (Chapman et al., 2003). Consistently, anterior identity is then stabilized by inductive interactions between the hypoblast and ADE (cells of the early chicken embryo comprising the medial region containing putative organizing ability). Consequently, we show that a rostral head organizer exists prior to stage 3c that is sufficient for midbrain formation in chick embryos, as revealed by DMBX.
Primitive Streak Merges into the Rostral Head Organizer at Stages 3c-4
rostral isolates failed to express midbrain when embryos were transected rostral to the node at stages 3c through 4. Two possible explanations exist for this occurrence: 1) Hensen’s node is reconstituted in the rostral region at stages 2-3c and is able to act as a head organizer but loses that ability subsequent to stage 3c, becoming solely a trunk organizer, or 2) the head organizer contains a head organizing signal that induces head prior to stage 3c, whereas between stages 3c-4, the primitive streak extends forward into the head organizer, thus integrating the head organizer into the rostral end of the primitive streak.
In the former view, a node would be reconstituted in the rostral region at stages 2-3c that would act as the head organizer. Yuan and colleagues (1995a) determined that the rostral primitive streak (node) could be reconstituted through the interaction of an inducing and responding region. In the absence of node, the inducing region (0-250 µm lateral to the streak and 500-750 µm caudal to the rostral end of the streak) and the responding region (250-500 µm lateral to the streak and 0-750 µm caudal to the rostral end of the streak) interact to reconstitute a node in the absence of node or when these two regions are grafted together into an ectopic site. Furthermore, grafting experiments with the node depict that the normal node suppresses the unnecessary formation of an extra node during normal development (Yuan et al., 1995a). In this view, a reconstituted node in the rostral region would act as the early head organizer that produces neural identity in the ectoderm, whereas the normal node would act as the late organizer that produces more caudal neural identity. However, this view appears inconsistent with our results since type 1 experiments transected rostral to Hensen’s node and the node inducer at stages 2-3c expressed midbrain in rostral isolates, as signified by DMBX, indicating that neither Hensen’s node nor the node inducer were required.
In the latter view, the head organizer induces anterior identity in the form of head neuroectoderm, and it becomes integrated into Hensen’s node and the primitive streak when the primitive streak extends forward between stages 3c-4. More specifically, at stage 3c, Hensen’s node (rostral tip of the primitive streak or midstreak) presumably elongates and merges into the head organizer to become a caudal or trunk positioning signaling center. When merging with the head organizer, neural specification can no longer change fates and only patterns trunk, no longer having the ability to pattern head (Chapman et al., 2003). This view appears consistent with our results since type 1 experiments transected rostral to Hensen’s node at stages 2-3c expressed midbrain in rostral isolates indicating that Hensen’s node was not required. Furthermore, Yuan and colleagues identified a region of the blastoderm located at the middle of the primitive streak that influences node differentiation and is quite possibly involved in the head to trunk transition (Yuan et al., 1995a; Yuan et al., 1995b). This is also consistent with our results because midbrain fails to express in type 1 rostral isolates at stages 3c-4 since the node and primitive streak have presumably merged at stage 3c.
Rostral Blastoderm Is Competent to Respond to Head and Trunk Induction by Hensen’s Node
The rostral blastoderm is sufficient for midbrain and caudal hindbrain formation in all rostral isolates when cultured in planar contact with Hensen’s node. This indicates that Hensen’s node is sufficient to induce
neuroectoderm at stages 2-4, and the caudal region of the primitive streak is not required for rostral head or trunk induction or maintenance. Therefore, head neuroectoderm, specifically midbrain as expressed by DMBX, and trunk neuroectoderm, specifically caudal hindbrain as expressed by X37, can reliably form in the absence of contact with the immediate caudal primitive streak. From this, we infer that planar inclusion of the rostral primitive streak (200 µm), or Hensen’s node, transduces a signal that can induce either head and/or trunk formation.
The Mechanism of Head to Trunk Transition
The model or mechanism of head to trunk transition is still unresolved. In accordance with our results, two models remain as possible explanations of the head to trunk conversion: 1) a modified Spemann and Mangold (1924) model or 2) a Saxen and Toivonen (1989) model. The former proposes that cells in the early organizer induce and pattern rostral neural regions and is later replaced with cells that pattern trunk neuroectoderm (Figure 2A) (Spemann and Mangold, 1924). Hence, the organizer shifts from rostral induction to caudal induction through spatial and temporal modification. The modified Spemann and Mangold (1924) model undergoes the same patterning mechanism and accounts for outside signaling derivatives including the head organizer (maintained within the hypoblast and the ADE), which patterns head in the absence of Hensen’s node. Since Hensen’s node has been suggested as a location rather than a fixed population of cells (Joubin and Stern, 1999), it is implied that external signals from outside derivatives such as the head organizer are involved in maintenance of the organizer. Other outside signaling derivatives include Crescent, Vg1, and Wnts located in the rostral region and primitive streak (Beddington and Robertson, 1999; Joubin and Stern, 1999). In zebrafish, Wnt signaling centers act as rhombomere boundaries required for precise metameric patterning, and this patterning mechanism is consistent in chick (Riley et al., 2004).
The latter model proposes that opposing gradients of morphogens establish the appropriate head and trunk patterning (Figure 2C). Since the default state in neural pattern formation is anterior neuroectoderm, Saxen and Toivonen (1989) claimed that head and trunk formation seem to depend on antagonistic gradient mechanisms rather than competition between gradients. They further proposed that the midbrain-hindbrain boundary is the intermediary state. Consequently, they developed a three-step model of neural patterning. First, initiation by neural induction is rostral in character. Secondly, transformation generates the trunk region. Finally, these two separate states are maintained in order to differentiate between head and trunk (Saxen, 1989).
in order to uncover the mechanism of head to trunk transition. We have provided evidence for different head and trunk organizers, accounted for by the head organizer, that are separated spatially during development before stage 3c, thus supporting the modified Spemann and Mangold (1924) model (Figure 12).
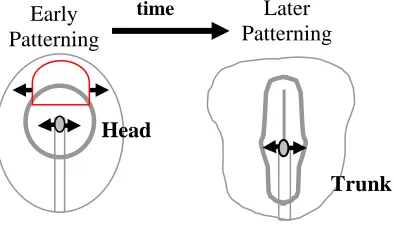
Figure 12. Modified Spemann and Mangold Model
The Spemann and Mangold (1924) model proposes that cells in the early organizer induce and pattern rostral neural regions and is later replaced with cells that pattern trunk neuroectoderm. Hence, the organizer shifts from rostral induction to caudal induction through a spatial and temporal model. However, the modified model undergoes the same patterning mechanism, but accounts for outside signaling derivatives including the head organizer (red semicircle), maintained within the hypoblast and the ADE, which patterns head in the absence of Hensen’s node.
Future Experiments
The head to trunk boundary appears to occur caudal to the isthmus of the midbrain-hindbrain boundary, as identified by the caudal border of DMBX, and rostral to rhombomere 4 of the caudal hindbrain, as identified by the rostral border of X37. However, the exact location of the head to trunk boundary is still unclear, since a marker between the midbrain and caudal hindbrain has not been tested. Therefore, it is necessary to more specifically elucidate the head to trunk boundary by testing gene expression markers between the midbrain and caudal hindbrain.
Furthermore, the mechanism of head to trunk transition is still unclear. It has not been determined whether a caudalizing signal from another source transforms previously induced rostral neuroectoderm to caudal neuroectoderm by an antagonistic/competitive manner or whether the midstreak, regulated by the node and rostral blastoderm, is responsible for this transition (Darnell, 2005). Therefore, we propose to test secreted rostral factors for the ability to inhibit the head to trunk transition. The first candidate tested would be anti-dorsalizing morphogenetic protein (ADMP) based on its inhibition of midstreak function (Joubin and Stern, 1999). We would specifically implant ADMP pellets into stage 3d-4 embryos that would be transected to include the node without the midstreak in the rostral fragment (type 2 experiment; Figure 5). These embryos would be assessed by a gene expression marker (X37) appropriate to the transection. If ADMP is sufficient to inhibit type 2 rostral isolate formation of caudal hindbrain, then we can conclude that the midstreak, regulated by the node and rostral blastoderm is responsible for this transition.
We can further investigate the head to trunk transition by evaluating head organizer activity in the
classical assay. We would graft rostral endoderm, epiblast, and blastoderm from stages 2-3b quail donors to stage 3c chick-host rostral isolates and assess head and trunk markers. Darnell and colleagues (1999) determined, through a comparison of host sites, that rostral isolates respond to organizer activity with the same or higher frequency than do lateral blastoderms. If we demonstrate head organizer activity through grafting to rostral isolates, excluding the node, we can more specifically conclude that rostral blastoderm in the transected embryos can self-differentiate as head neuroectoderm and that the head organizer has the signaling capacity to induce neighboring cells to differentiate. Moreover, through grafting to the region rostral to the primitive streak at stages 2-4, we may more precisely conclude on the timing of the merger of the rostral region, the head organizer, with the primitive streak.
Limitations and Significance of Research
The chick embryo, the model system of this study, provides an excellent way of studying the development of higher vertebrates because it strongly resembles the human blastoderm at early stages, having a flat, disk-like structure during gastrulation (Darnell and Schoenwolf, 2000a). The blastoderm has been thoroughly fate mapped (e.g., ectoderm and mesoderm (Schoenwolf et al., 1992); Figure 3) and the locations of progenitor cells prior to gastrulation, the temporal boundary of this study, are also well documented (Stern and Canning, 1990). In addition, the chick embryo has been divided into recognizable stages and used extensively as a model system for evaluating tissue interactions involved in early developmental events (Hamburger and Hamilton, 1951; Sanes, 1992). Thus, it allows for many advantages in terms of elucidating developmental events of higher organisms. However, a possible source of error includes the evaluation of microsurgical embryos, since these embryos might develop slower and differently than normal uncut embryos (Darnell and Schoenwolf, 2000b). To avoid this error source in our experiments, we used the respective embryo fragments as controls to account for differences in morphology between microsurgically manipulated embryos and uncut embryos (e.g., expression in caudal isolates from type 1 experiments transected prior to stage 3c were used as positive controls for rostral isolates).
Looking at the big picture, determination of early neural developmental pattern is not only important for the overall neural architecture of an organism but also the specificity of its comprising cells. Specifically, the prospect of knowing what signaling cascades are important to grow midbrain as opposed to caudal hindbrain or spinal cord neurons from stem cells in culture has several implications in the field of regenerative medicine. More specifically, CNS neurons do not regenerate after trauma or spinal cord injury. Therefore, it is important to further elucidate the signaling cascades of the head to trunk transition in order to apply the mechanism of head and trunk differentiation to growing spinal cord neurons in culture or other procedures of regenerative medicine.
Experimental Procedures
Embryo Culture and Staging
Fertile unhatched Gallus domesticus eggs were incubated at 38°C in a forced-draft, humidified egg incubator with a programmable timer for 9-48 hours. Specific stages were