Progress in Biological Sciences
Vol. 4, Number 1, Winter / Spring 2014/43-52Received: November 6, 2013; Accepted: January 18, 2014
Samaneh Saadat1, Zhaleh Safikhani2,Kambiz Badie3
, Mehdi Sadeghi4*
1- Department of Algorithms and Computation, University of Tehran, Tehran, Iran; 2- Institute of Biochemistry and Biophysics, University of Tehran, Tehran, Iran; 3- National Telecom Research Center, Tehran, Iran; 4- National Institute of Genetic Engineering and Biotechnology, Tehran, Iran
Given the importance of transcriptome analysis in various biological studies and considering the vast amount of whole transcriptome sequencing data, it seems necessary to develop an algorithm to assemble transcriptome data. In this study we propose an algorithm for transcriptome assembly in the absence of a reference genome. First, the contiguous sequences are generated using de Bruijn graph with different k-mer lengths. Then, the eclectic mixtures of sequences are gathered in order to form the final sequences. Lastly, the contiguous sequences are clustered and the isoform groups are provided. This proposed algorithm is capable of generating long contiguous sequences and accurately clustering them into isoform groups.To evaluate our algorithm, we applied it to a simulated RNA-seq dataset of rat transcriptome and a real RNA-seq experiment of the loricaria gr. cataphracta transcriptome. The correctness of the assembled contigs was more than 95%, and our algorithm was able to reconstruct over 70% of the transcripts at more than 80% of the transcripts’ lengths. This study demonstrates that applying a sophisticated merging method improves transcriptome assembly. The source code is available upon request by contacting the corresponding author by email.
Keywords: De novo, next generation sequencing, RNA-seq, transcriptome assembly.
Clustering of short read sequences for
de novo
Introduction
Sequencing expressed mRNA (RNA-seq) using next generation sequencing technologies provides a huge amount of transcriptome data which requires an efficient and accurate method for assembly. Applications of transcriptomic information include obtaining gene expression level, gene expression profiling after experimental treatments, cancer gene expression, and gene discovery. There are different approaches to assembling RNA-seq data. Some transcriptome assemblers have been developed to assemble transcriptome short reads based on a reference genome, including TopHat (1) and Cufflinks (2). Reference-based assemblers map short reads onto a reference genome in order to find full-length transcript sequences. However, reference genomes of most species are not available, and sometimes the individual that is under study is different from the reference genome, so mapping the short reads to the reference is not reliable. Therefore, it seems that having a method to assemble short reads in the absence of a reference genome is essential. De novo
RNA-seq read assemblers such as Trinity (3), transABySS (4), and Oases (5) construct transcript assemblies (transfrags) without using any reference genome.
Some de novo assemblers including Atlas (6) and ARACHNE (7) are based on the overlap-layout-consensus (OLC) approach which constructs an overlap graph of reads. In an overlap graph, each read is considered a node, and nodes will be connected to each other if they have adequate overlaps. Although OLC algorithms are appropriate for assembling long reads, they cannot be applied to a set of short reads. A large quantity of short reads with short overlaps culminates in a huge graph which is time and memory inefficient and greatly ambiguous. In order to
overcome these limitations and disadvantages of OLC based algorithms, de Bruijn-based assemblers have been developed. Using the de Bruijn graph is the best way to handle redundancy in short reads, and its construction is based on words with the size of k nucleotides called k-mer. Recent algorithms of genome assembly are mostly based on de Bruijn graphs (8-10).
The fundamental stages of both genome and transcriptome assembly to create contiguous sequences (contigs) are the same, so it is possible to use a de Bruijn-based genome assembler to generate contigs from transcriptome short reads. However, transcriptome assembly is different in some aspects. First, all the parts of a genome have uniform coverage depth, but this is not true for transcriptome short reads. In other words, the expression levels of genes might be different; some of the genes are expressed very low and some of them might be expressed very high. Second, the ultimate goal of genome assembly is to construct a whole genome as one contiguous sequence, but transcriptome inherently contains a number of separate sequences belonging to different genes that should not be connected to each other. Third, alternative splicing makes assembling RNA-seq reads more challenging. Therefore, in order to make genome assemblers appropriate for transcriptome assembly, some post-processes are required. Velvet (10) is a fast and memory efficient de Bruijn-based assembler. It is the most conventional genome assembler which is exploited by several transcriptome assemblers including Rnnotator and Multiple-K (11-13).
is difficult. Moreover, based on the variability of gene expressions, it is strongly recommended that, for transcriptome assembly, the de Bruijn assembler be run with different k-mer values; then the results should be combined.
Assembly Assembler (https://github.com/dzerbino/velvet/tree/mast
er/contrib/AssemblyAssembler1.3) is a software designed to combine the contigs obtained from several executions of Velvet. AssemblyAssembler applies the Velvet assembler on input short reads across a user-specified range of k-mer values. Then, it finds the best k-mer length which generates the longest maximum contigs and conducts additional assemblies with k-mer lengths close to the best k-mer. Eventually, the AssemblyAssembler gathers all the contigs of these runs and utilizes them as the input of a final assembly process. The final contigs are considered transcripts.
Producing contigs using a de Bruijn-based genome assembler, however, is not enough for transcriptome assembly, because isoform transcripts have overlaps. They do not form a plain sequence, and there are branches in their presentation. Thus, this notion should be represented using the graph structure. Some de Bruijn based de novo transcriptome assemblers such as Oases (5) and Multiple-K (12) construct a graph which demonstrates the relationship between the contigs and clusters the assembled contigs. These methods use different strategies to construct graphs. Oases employs the number of single and paired-end reads to create the graph and cluster contigs, while Multiple-K uses the proteome of a related species as a reference to assemble contigs belonging to the same gene.
In this work, we used Velvet as a tool to assemble short reads and generate contigs. First, we executed Velvet several times with different k-mer values and selected the best
sets of contigs from among the results. Then, the selected contigs were combined to construct the final longer contigs. Afterward, scores between final contigs were computed, and a graph was generated based on the contigs and their scores. Finally, the generated graph was clustered into its connected components which were isoform transcript groups. Moreover, we assessed our algorithm using criteria such as correctness, completeness, contiguity, and group fusion.
Materials and Methods
Merging Contigs
The performance of a de Bruijn-based assembler depends on the hash length or k-mer length. It is challenging to find the optimal k-mer value for a de Bruijn-based assembler. In addition, based on the variety of expression levels of the transcriptome data, a genome assembler like Velvet is not able to reconstruct full-length transcripts with different expression levels just by using one single k-mer length. This is mainly because of the fact that a higher k-mer length is able to construct highly expressed transcripts. In order to reconstruct low-expressed transcripts, it is recommended to use lower k-mer lengths (12). The most conventional solution for dealing with heterogeneous expression levels of transcripts is to apply various k-mer lengths to produce initial contigs and then merge them into a final contig set. There are different ways to merge assembled contigs, and the performance of the final contigs heavily depends on the merging strategy. We examined different contig-merging methods and compared their results. This study introduces a highly accurate method for merging obtained contigs from different k-mer lengths.
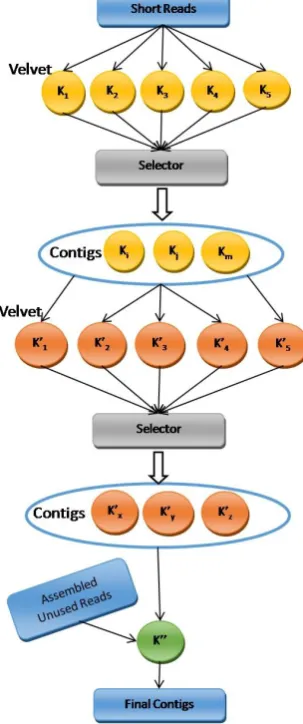
run with a range of user-specified k-mer lengths. Then the result of each Velvet run is verified and a subset of k-mer lengths which will produce satisfactory results is selected. In the second step, the union of the selected sets of contigs, which are constructed using opted k-mer lengths, is considered as the input for another series of Velvet runs with a range of user-specified hash lengths. Then the algorithm determines which k-mer lengths produce better assemblies than the others. Next, it merges the assembled contigs which are produced using the selected k-mer lengths and creates the final assemblies. Figure 1 illustrates our strategy to generate and merge contigs.
Figure 1. Merging phase diagram
Although assembling transcriptome short reads using just one k-mer value does not produce the desired contigs, the use of a wide variety of k-mer lengths might lead to the generation of misassemblies and cause the assembler’s performance to deteriorate. Therefore, it is necessary to design a sophisticated procedure to verify the performance of Velvet with each k-mer length and choose the best ones among them. Velvet results including contigs with longer N50 and longer maximum lengths are more appropriate for the input of the final assembler. Our algorithm verifies the performance of each Velvet execution and selects the desired results of the executions. In the current study, we used the average value of N50 and the maximum contig length of all the executions as thresholds to determine which executions had an acceptable amount of N50 and maximum contig length.
We also kept track of unused reads in each Velvet execution and tried to assemble them independently. In the final step, assembled unused reads were taken into account and used as part of the input for the final Velvet execution.
Clustering Contigs
assembled contigs. Thus, we call isoforms with common exons an isoform group. All transcripts of an isoform group are expected to constitute a cluster.
In order to illustrate the structure of each isoform group, we used a directed graph. An isoform group contains several transcripts, and each transcript consists of one or more contigs, so every isoform group is a collection of its transcript contigs. We represented an isoform group using graph data structure. In this graph, the contigs are considered nodes. The edges of the graph determine the relationship between and the order of the contigs.
In the sequencing process, reads can be obtained either from only one end of a fragment, which is called single-end sequencing, or from both ends of a fragment, which is called paired-end sequencing. For paired-end sequencing, the approximate fragment size or insert length is used to estimate the distance between both ends. Two contigs, the distance between which is less than the insert length, probably share a fragment. In other words, the read from one end of the fragment contributes to the construction of the first contig, and the read from the other end of the fragment contributes to the construction of the second contig. Based on our experiments, the best criterion for relating two contigs and specifying their order is the number of paired-end reads that admits the strength and direction of the connection between them. In order to find the isoform groups, we built a directed weighted graph based on the paired-end scores; the calculation process is presented in the following section. Afterward, the low-weighted edges were discarded, and the remaining graph was divided into its connected components. Finally, the generated sub-graphs were considered as the clusters.
Each cluster demonstrated an isoform group which consisted of the contigs of its transcripts and the relationships between them. The graph related to each isoform group is a DAG (Directed Acyclic Graph), and each path in this graph is a possible transcript.
Calculating Scores
The score between two contigs is the number of paired-end reads that admits their connection. If a connection is confirmed by an adequate number of paired-end reads, the contigs belong to the same gene. To calculate the scores, short reads are aligned to the final contigs. The score between two contigs increases by one unit if a specific read is aligned to the first contig and its pair is aligned to the second contig. To align short reads to contigs, BLAT software (14) was used. If more than 80% of a short read length is aligned to a contig, the read will be regarded as part of the contig. There are many similar but distinct genes within a family of genes, so some distinct genes might have several short reads in common, and contigs belonging to these genes will be fused together. However, in the assembly process, the only available information is sequencing information, so gene fusion is inevitable where there are similar genes.
Experimental Data
comprised 71-bp short reads of loricaria gr.
cataphracta sequenced using Illumina
sequencing technology.
We used a rat transcriptome data set to measure the correctness, completeness, contiguity, and group fusion of contigs generated by our algorithm. In order to simulate a RNA-seq data set similar to real ones, a random number between 10 and 50 was considered as the expression level of each transcript. The frequency of each transcript in our expressed transcript data was equal to its randomly generated expression level.
We used the expressed transcripts data set as the input of a short read simulator. Dwgsim (https://github.com/nh13/DWGSIM) was used to simulate paired-end short reads. Short read length was considered 45bp, and the insertion length between paired-ends was set to 200bp.
Results
k-mer length impact
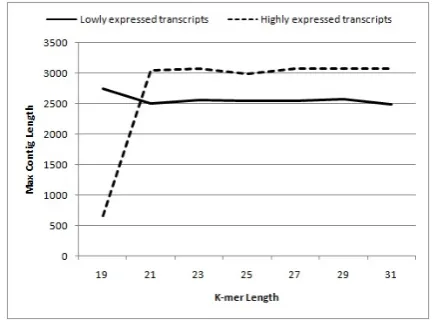
To verify the impact of k-mer value on assembly performance, we simulated two sets of data. First, we selected 100 transcripts of rat and considered the expression level of each transcript as a random number between 5 and 10. Second, we assigned random numbers between 40 and 50 as expression levels of 100 selected transcripts. We called the first set of data ‘low-expressed transcripts’ and the second set of data ‘high-expressed transcripts.’ Then, we simulated short reads of these two transcript data sets. Lastly, we applied Velvet Assembler to each set separately and compared their performances. As Figures 2, 3, and 4 show, the smaller k-mer lengths performed better for low coverage transcripts, but for highly expressed genes, the results of the longer k-merlengths were more satisfactory.
Figure 2. Impact of k-mer length on median coverage depth of contigs
Figure 3. Impact of k-merlength on median N50 of contigs
Figure 4. Impact of k-mer length on maximum contig length
depth, so the existence of a large amount of misassemblies in final contigs causes a reduction in median coverage depth. As shown in Figure 2, the median coverage depth would be very low when lower k-mer lengths are used for high-expressed genes. The median coverage depth usually grows when k-mer values are increased for highly-expressed genes, and it decreases for low-expressed genes. N50 and maximum length of contigs are significant measures used to evaluate the result contigs. In Figure 3 and 4, it is observable that for transcripts with low expression levels, lower k-mer lengths perform better and generate longer contigs, but for highly-expressed transcripts, larger k-mer values produce longer contigs.
Constructing a de Bruijn graph with a small hash length results in contigs which cover most parts of the transcripts, but it also creates misassemblies and generates many extra contigs which are not aligned to the original transcripts. Hence, small k-mer lengths make de Bruijn graphs more ambiguous. However, larger k-mer lengths generate more accurate de Bruijn graphs, although they might not be able to produce some assemblies. The de Bruijn assembler which uses small k-mer values generates more complete contigs, but large k-mer lengths provide more accurate contigs. Therefore, choosing the k-mer length is a trade-off between completeness and correctness.
Metrics
We consider several metrics to evaluate the explained algorithm and to compare it with the other algorithms. The metrics used for assessment are correctness, completeness, contiguity, and group fusion.
Correctness is the percentage of contigs that are correctly constructed. To identify
correct contigs, the original exons were aligned to the contigs. In an ideal situation, all contigs should be covered completely by exons, but in the experimental situation, most contigs are only partially covered. If more than 80% of a contig length is covered, it will be considered a correct contig.
An ideal assembler generates contigs that cover all of the transcripts. Completeness denotes the percentage of nucleotides of the original transcripts that are covered by the generated contigs. We also measured the percentage of isoform groups in which more than 80% of their nucleotides are covered by the resulting contigs.
It is anticipated that all the exons belonging to one isoform group will be covered by one cluster. This measure is called contiguity. In fact, contiguity specifies the percentage of isoform groups which are covered by one cluster at more than 80% of the group length.
Different isoform groups should be regarded as different clusters. Since some isoform groups have common portions of sequence, they might be fused together. Group fusion determines the percentage of clusters covering two different groups.
Evaluating Scores
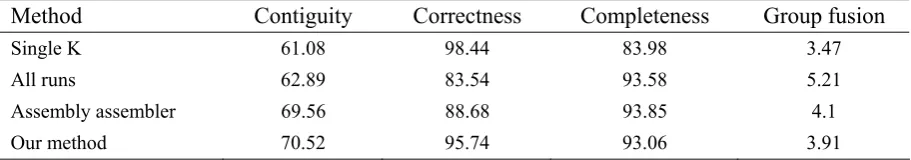
Table 1. Comparison results of various merging methods
Method Contiguity Correctness Completeness Group fusion
Single K 61.08 98.44 83.98 3.47
All runs 62.89 83.54 93.58 5.21
Assembly assembler 69.56 88.68 93.85 4.1
Our method 70.52 95.74 93.06 3.91
Comparison of Merging Methods on Simulated data
The final outcomes of evaluating different strategies are summarized in Table 1. This table shows that the strategy of running Velvet with different k-mer lengths and merging the results is definitely superior to generating contigs using just one single k-mer length. Running Velvet with a single k-mer length does not culminate in a desirable performance. In order to judge the merits of merging contigs of different Velvet executions, we also conducted our experiments on running Velvet with just onek-merlength.
In order to compare our merging method with Assembly Assembler, we applied Assembly Assembler to short reads, and then we clustered its final contigs using our clustering method. The performance of AssemblyAssembler’s merging method is shown in Table 1. We also present the performance of the assembler when the selection method was not applied to Velvet results, and all of the generated sets of contigs in the first series of Velvet executions were used as input for the second series of Velvet executions.
Each contig usually contains one or more exons, so it was expected that contigs would be covered by the exons. To evaluate the correctness of the contigs, we aligned exons to the assembled contigs. Therefore, each exon covered a specific part of a contig. If more than 80% of the contig length is covered by exons, it is considered to be a correctly constructed contig. For the rat transcript data set, more than 95% of the contigs were covered by exons at over 80% of the contig length.
In order to assess the completeness of generated contigs, we aligned exons to the contigs, and we anticipated the alignment of all of the exons to the contigs. Covering all of the exons with the contigs is not possible in real situations. If more than 80% of the exon length is aligned to a contig, the exon will be considered completely covered. The contigs generated using our method were over 93% completely reconstructed, which is considerably more than the results obtained by running Velvet with just one single k-mer length. Generally, Velvet with just one k-mer length produces fewer contigs which are more accurate and less complete.
The contiguity of the contigs is estimated by the percentage of the isoform groups which are covered by one cluster. In order to discover isoform groups, we aligned exons to the transcripts. All exons belonging to one transcript were considered as initial isoform groups. Then we tried to find the groups with common exons, merge them, and unify all of their exons. It was expected that the exons of one isoform group would be aligned to the contigs of one cluster. The clusters obtained using our method covered about 70% of the desired isoform groups which is indicative of good contiguity.
We also computed the percentage of clusters containing group fusion. In our method, 3.9% of groups had group fusion which means that they aligned to one cluster.
Comparison with Multiple-K on real data
RNA-seq de novo transcriptome assembler, Multiple-K (12). The loricaria gr. cataphracta
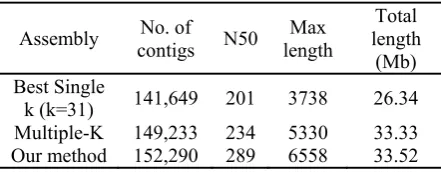
transcriptome short reads data set was used for this comparison. The assembled contigs obtained with our method and the Multiple-K resulting contigs were compared using N50 which is the weighted median of contig lengths. The higher value of this statistic indicates the longer lengths of the assembled contigs. Generally, producing longer contigs leads to the generation of more contiguous reconstructed transcripts. Table 2 shows that the assembled contigs obtained with our method are longer than the contigs assembled using Multiple-K. Our method also succeeded in generating contigs with longer maximum contig length in comparison with the results of K. Our method and the Multiple-K algorithm both assembled the same number of input transcripts.
Table 2. Comparing of our method with Multiple-K method
Assembly contigs No. of N50 length Max length Total (Mb) Best Single
k (k=31) 141,649 201 3738 26.34 Multiple-K 149,233 234 5330 33.33 Our method 152,290 289 6558 33.52
Discussion
Our proposed algorithm is able to reconstruct transcripts with a diverse range of expression levels, although it does not have the power to assemble transcripts with low expression levels. Since reference-based RNA-seq assembly performs well in assembling low-expressed genes, combining reference-based and de novo
approaches achieves better results.
One of the most important parameters affecting a de Bruijn-based assembler’s performance is the k-mer length. This parameter is crucial to assembling transcriptome short reads because of the inherent variability of gene expression levels.
Hence, there is no optimal k-mer value for assembling transcriptome short reads. Therefore, running a de Bruijn assembler using different hash lengths and merging the results generates more contiguous sequences. The performance of the final contigs is highly dependent on the merging strategy. In this work, we examined different methods in order to improve the results, and eventually we generated a more contiguous assembly. Obviously, there may be other merging strategies which can improve performance.
We determined that if the connection between the contigs is admitted by the adequate number of paired-end short reads, they belong to the same gene, and the score obtained based on the paired-end reads is an appropriate measure for finding isoform groups. However, the discovery of other characteristics that reveal relationships between contigs can be helpful in improving the contiguity of the final results.
Group fusion in the assembly process leads to the construction of transcripts, the sequences of which are merged together. This problem can be solved by employing some post-processing tasks. One possible solution for this problem is to use coverage depth information to separate the fused groups. The coverage depth of all parts of a transcript is uniform, so all the contigs that are clustered into a specific isoform group should have similar coverage depth. Since the exons common among transcripts increase the coverage depth of the contigs related to those exons, it is necessary to develop a method for distinguishing the common exons.
Acknowledgment
1. Trapnell, C., Pachter, L. and Salzberg, S.L. (2009) TopHat: discovering splice junctions with RNA-Seq. Bioinformatics, 25, 1105-1111.
2. Trapnell, C., Williams, B.A., Pertea, G., Mortazavi, A., Kwan, G., van Baren, M.J., Salzberg, S.L., Wold, B.J., Pachter, L. (2010) Transcript assembly and quantification by RNA-Seq reveals unannotated transcripts and isoform switching during cell differentiation. Nat. Biotechnol., 28, 511-515.
3. Manfred,G.G., Brian,J. H., Moran,Y., Joshua, Z.L., Dawn,A.T., Ido,A., Xian, A., Lin,F., Raktima, R., Qiandong,Z., Zehua, C., et al. (2011) Full-length transcriptome assembly from RNA-Seq data without a reference genome. Nat. Biotechnol., 29, 644-652.
4. Robertson, G., Schein, J., Chiu, R., Corbett, R., Field, M., Jackman, S.D., Mungall, K., Lee, S., Okada, H.M., Qian, J.Q., et al. (2010) De novo assembly and analysis of RNA-seq data. Nat. Methods, 7, 909-912.
5. Schulz, M.H., Zerbino, D. R., Vingron, M. and Birney, E. (2012) Oases: Robust De novo RNA-seq assembly across the dynamic range of expression levels. Bioinformatics, 28, 1086-1092.
6. Weinstock, G.M. and Gibbs, R.A. (2004) The Atlas genome assembly system. Genome Res., 14, 721–732.
7. Batzoglou, S., Jaffe, D.B., Stanley, K., Butler, J., Gnerre, S., Mauceli, E., Berger, B., Mesirov, J.P., and Lander, E.S. (2002) ARACHNE: A whole genome shotgun assembler. Genome Res.,12, 177–189.
8. Myers, E.W. (2005) The fragment assembly string graph. Bioinformatics, 21, ii79–ii85.
9. Jiang, Z., Tang, H., Ventura, M., Cardone, M. F., Marques-Bonet, T., She, X., Pevzner, P. A., and Eichler, E. E. (2007) Ancestral reconstruction of segmental duplications reveals punctuated cores of human genome evolution. Nat. Genet., 39, 1361–1368.
10. Zerbino, D. R. and Birney, E. (2008) Velvet: algorithms for De novo short read assembly using De Bruijn graphs. Genome Res., 18, 821–829.
11. Martin, J., Bruno, V.M., Fang, Z., Meng, X., Blow, M., Zhang, T., Sherlock, G., Snyder, M. and Wang, Z. (2010) Rnnotator: an automated De novo transcriptome assembly pipeline from stranded RNA-Seq reads. BMC Genomics, 11, 663-670.
12. Surget-Groba, Y. and Montoya-Burgos, J. I. (2010) Optimization of De novo transcriptome assembly from next-generation sequencing data. Genome Res., 20, 1432-1440.
13. Geng, C., KangPing, Y., Charles, W., TieLiu S. (2011) De novo transcriptome assembly of RNA-Seq reads with different strategies. 54, 1129-1133.