IJPAR |Vol.8 | Issue 3 | Jul - Sep - 2019 Journal Home page: www.ijpar.com
Research article Open Access
Preparation and characterization of oral fast dissolving tablet containing
glibenclamide
Farhath Sultana*, D.Karthikeyan, G. Ganesh Kumar
1 *1SriKurpa Institute of Pharmaceutical Sciences, Siddipet, Telangana- 502277. India. (Affiliated to
Osmania University, Hyderabad)
*Corresponding Author: Dr. Ganesh Kumar Gudas
E-mail: [email protected]
ABSTRACT
The purpose of the study was to achieve rapid onset of action. Glibenclamide is an oral anti-diabetic agent used in the treatment of type-2 diabetes mellitus. The formulation (F1-F16) were developed by using design expert 11 version. Glibenclamide prepared b using direct compression method. 16 batches of fast dissolving tablet of glibenclamide were prepared by using cross carmellose sodium and xanthan gum in different concentration. All the formulation were evaluated for weight variation, hardness friability, thickness, in -vitro disintegration time, in-vitro dissolution time etc., and F3 showed the values within limits. Formulation F3 with cross carmellose sodium showed the less disintegration time (8 sec). In-vitro dissolution studies showed 98.34 %drug release at the end of 30 minutes.
Keywords:
Glibenclamide, Cross carmellose sodium and Xanthan gumINTRODUCTION
Solid dosage forms are popular because of low cost, ease of administration, accurate dosage self-medication, pain avoidance, and the most importantly the patient compliance. The most popular solid dosage forms are being tablets and capsules [1, 2]. One important drawback of such dosage forms is Dysphagia, or difficulty in swallowing is common among all age groups. Common complaints about the difficulty in swallowing tablets are size, surface, and taste of tablets. Geriatric and paediatric patients and
travelling patients, who may not have ready access to water, are most in need of easy swallowing dosage forms [3].
To fulfill these medical needs, pharmaceutical technologists have developed a novel oral dosage form known as ODTs which disintegrate rapidly in saliva, usually within a matter of seconds, without the need to take it water. Drug dissolution and absorption, as well as onset of clinical effect and drug bioavailability, may be significantly greater than those as compared with conventional dosage forms [4-6].
ODTs releases the medicament in the mouth for absorption through local oromucosal tissue and through pre-gastric (oral cavity, pharynx, and esophagus), gastric (stomach), and post-gastric astric (oral cavity, pharynx, and esophagus), gastric (stomach), and post-gastric (small and large intestine) segments of gastrointestinal tract (GIT) [7].
Orodispersible tablet
[8]
ODTs are also called as orodispersible tablets, quick disintegrating tablets, mouth dissolving tablets, fast disintegrating tablets, fast dissolving tablets, rapid dissolving tablets, porous tablets, and rapidmelts. However, of all the above terms, United States pharmacopoeia (USP) approved these dosage forms as ODTs. The European Pharmacopoeia has used the term orodispersible tablet for tablets that disperses readily within 3 minutes in the mouth before swallowing.
United States Food and Drug Administration defined ODT as “A solid dosage form containing a medicinal substance or active ingredient which disintegrates rapidly usually within a matter of seconds when placed upon the tongue.” The disintegration time for ODTs generally ranges from several seconds to about a minute.
MATERIALS AND METHODS
Glibenclamide was purchased from Yarrow chemicals and Cross Carmellose Sodium, Xanthan Gum, Talc, Magnesium Stearate, Aspartame, Polyvinyl pyrrolidine K30 and Micro Crystalline cellulose were purchased from SD fine chemicals.
PREFORMULATION STUDIES
Identification Tests
IR Spectroscopy
The FT-IR spectrum of the obtained sample of drug was compared with the standard FT-IR spectra of the pure drug
Melting Point determination
Melting point determination of the obtained drug sample was done because it is a good first indication of purity of the sample since the presence of relatively small amount of impurity can
be detected by a lowering as well as widening in the melting point range
COMPATIBILITY STUDIES
IR Spectroscopy
FT-IR spectroscopy was carried out to check the compatibility between drug and polymers. The FT -IR spectra of drug with polymers were compared with the standard FT-IR spectrum of the pure drug.
Preparation of phosphate buffer
Preparation of 0.2M Potassium Dihydrogen
Ortho Phosphate
Dissolve 27.218gof KH2PO4 in distilled water and made up the volume to 1000 ml with distilled water Preparation of 0.2M Sodium Hydroxide: Dissolved NaOH in water to produce a 40 to60 % w/v solution and allowed to stand. Taking precautions to avoid absorption of carbon dioxide siphoned off the clear supernatant liquid dioxide free water a suitable volume of the liquid to contain 8 g of NaOH in 1000 ml.
Preparation of pH 6.8 buffer
Placed 50 ml of 0.2M KH2PO, in a 200 ml volumetric flask and 22.4ml of 0.2M NaOH was added the and made up the volume with distilled water.
λ max determination of drug in buffer
solution:
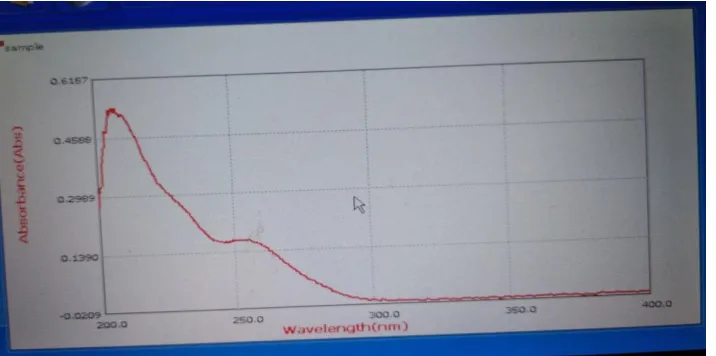
10 ug/ml of drug solution was prepared and scanned against pH6.8 buffer as reference solution under wave length range of 200-400nm by using UV spectrophotometer. A graph was plotted by taking absorbance on Y-axis and wavelength on X-axis. mg/ml.
Construction of calibration graph in pH 6.8
buffer
Table 1: Formulations of Glibenclamide containing different superdisintegrants.
Ingredie nts(mg)
Formulations
F1 F2 F3 F4 F5 F6 F7 F8 F9 F10 F11 F12 F13 F14 F15 F16
Glibencl amide
5 5 5 5 5 5 5 5 5 5 5 5 5 5 5 5
Croscar mellose Sodium
7.5 12. 75 13. 8 13.9 5 17. 1 19. 2 20.2 5 22 .5 - - - - Xanthu m Gum
- - - 7.5 12.7
5
13.8 13.95 17.1 19.2 20.2 5
22.5
Talc 3 3 3 3 3 3 3 3 3 3 3 3 3 3 3 3
Magnesi um Stearate
3 3 3 3 3 3 3 3 3 3 3 3 3 3 3 3
Asparta me
5 5 5 5 5 5 5 5 5 5 5 5 5 5 5 5
Polyviny l Pyrrolid ine K30
8 8 8 8 8 8 8 8 8 8 8 8 8 8 8 8
Micro crystalli ne Cellulos e 11 4.5 109 .25 10 8.2 108. 05 10 4.9 10 2.8 101. 75 99 .5 11 4.5 109. 25 108. 2 108.0 5 104. 9 102. 8 101. 75 99.5
Total 15 0
150 15 0
150 15 0
15 0
150 15 0
15 0
150 150 150 150 150 150 150
RESULTS AND DISCUSSION
Figure no: 2 Calibration graph of Glibenclamide
Fig No 3 : FTIR spectrum of Glibenclamide
y = 0.0091x R² = 0.9992
0 0.1 0.2 0.3 0.4 0.5 0.6
0 10 20 30 40 50 60 70
Abs
o
rba
nce
Concentration (µg/ml)
Standard graph of Glibenclamide
Absorbance
Fig No 4: FTIR spectrum of Optimized Formulation
Table No 2: FTIR interpretation of Glibenclamide pure drug Characteristic bands Reference peak(cm-1) Observed peak(cm-1)
CH3-O stretch 2830-2810 2852.52
C=O 1725-1705 1714.60
N-H(secondary amine)
Deformation
1650-1550 1616.17
S=O stretch 1358-1336 1342.36
C-Cl stretch 730-580 723.28
Melting point determination
The melting point of the obtained drug sample was found to be 169˚C which is the reported range
of 168-174˚C. It complies with USP standards thus indicating the purity of the drug sample.
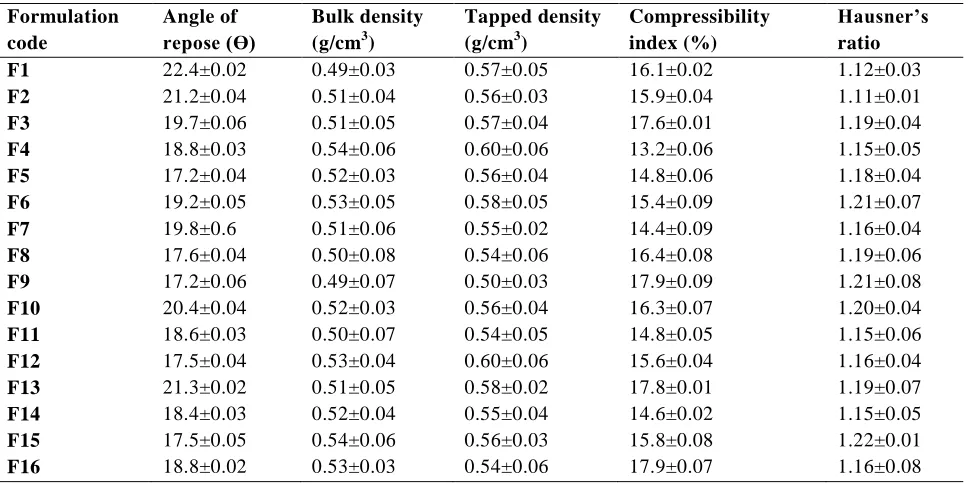
Table No 2: Preformulation Studies of blend of all formulations Formulation
code
Angle of repose (Ɵ)
Bulk density (g/cm3)
Tapped density (g/cm3)
Compressibility index (%)
Hausner’s ratio
F1 22.4±0.02 0.49±0.03 0.57±0.05 16.1±0.02 1.12±0.03
F2 21.2±0.04 0.51±0.04 0.56±0.03 15.9±0.04 1.11±0.01
F3 19.7±0.06 0.51±0.05 0.57±0.04 17.6±0.01 1.19±0.04
F4 18.8±0.03 0.54±0.06 0.60±0.06 13.2±0.06 1.15±0.05
F5 17.2±0.04 0.52±0.03 0.56±0.04 14.8±0.06 1.18±0.04
F6 19.2±0.05 0.53±0.05 0.58±0.05 15.4±0.09 1.21±0.07
F7 19.8±0.6 0.51±0.06 0.55±0.02 14.4±0.09 1.16±0.04
F8 17.6±0.04 0.50±0.08 0.54±0.06 16.4±0.08 1.19±0.06
F9 17.2±0.06 0.49±0.07 0.50±0.03 17.9±0.09 1.21±0.08
F10 20.4±0.04 0.52±0.03 0.56±0.04 16.3±0.07 1.20±0.04
F11 18.6±0.03 0.50±0.07 0.54±0.05 14.8±0.05 1.15±0.06
F12 17.5±0.04 0.53±0.04 0.60±0.06 15.6±0.04 1.16±0.04
F13 21.3±0.02 0.51±0.05 0.58±0.02 17.8±0.01 1.19±0.07
F14 18.4±0.03 0.52±0.04 0.55±0.04 14.6±0.02 1.15±0.05
F15 17.5±0.05 0.54±0.06 0.56±0.03 15.8±0.08 1.22±0.01
F16 18.8±0.02 0.53±0.03 0.54±0.06 17.9±0.07 1.16±0.08
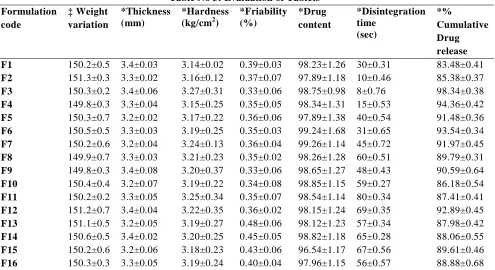
Table No 3: Evaluation of Tablets Formulation
code
‡ Weight variation
*Thickness (mm)
*Hardness (kg/cm2)
*Friability (%)
*Drug content
*Disintegration time
(sec)
*%
Cumulative Drug release
F1 150.2±0.5 3.4±0.03 3.14±0.02 0.39±0.03 98.23±1.26 30±0.31 83.48±0.41
F2 151.3±0.3 3.3±0.02 3.16±0.12 0.37±0.07 97.89±1.18 10±0.46 85.38±0.37
F3 150.3±0.2 3.4±0.06 3.27±0.31 0.33±0.06 98.75±0.98 8±0.76 98.34±0.38
F4 149.8±0.3 3.3±0.04 3.15±0.25 0.35±0.05 98.34±1.31 15±0.53 94.36±0.42
F5 150.3±0.7 3.2±0.02 3.17±0.22 0.36±0.06 97.89±1.38 40±0.54 91.48±0.36
F6 150.5±0.5 3.3±0.03 3.19±0.25 0.35±0.03 99.24±1.68 31±0.65 93.54±0.34
F7 150.2±0.6 3.2±0.04 3.24±0.13 0.36±0.04 99.26±1.14 45±0.72 91.97±0.45
F8 149.9±0.7 3.3±0.03 3.21±0.23 0.35±0.02 98.26±1.28 60±0.51 89.79±0.31
F9 149.8±0.3 3.4±0.08 3.20±0.37 0.33±0.06 98.65±1.27 48±0.43 90.59±0.64
F10 150.4±0.4 3.2±0.07 3.19±0.22 0.34±0.08 98.85±1.15 59±0.27 86.18±0.54
F11 150.2±0.2 3.3±0.05 3.25±0.34 0.35±0.07 98.54±1.14 80±0.34 87.41±0.41
F12 151.2±0.7 3.4±0.04 3.22±0.35 0.36±0.02 98.15±1.24 69±0.35 92.89±0.45
F13 151.1±0.5 3.2±0.05 3.19±0.27 0.48±0.06 98.12±1.23 57±0.34 87.98±0.42
F14 150.6±0.5 3.4±0.02 3.20±0.25 0.45±0.05 98.82±1.18 65±0.28 88.06±0.55
F15 150.2±0.6 3.2±0.06 3.18±0.23 0.43±0.06 96.54±1.17 67±0.56 89.61±0.46
F16 150.3±0.3 3.3±0.05 3.19±0.24 0.40±0.04 97.96±1.15 56±0.57 88.88±0.68
*All the values represented as mean ± Standard Deviation (SD), n=3.
In-Vitro
Drug dissolution study
The Dissolution study on formulation number: F1-F16 were carried out using 500ml of 6.8pH phosphate buffer as dissolution medium at 50rpm
using USP apparatus 2. The formulation F3 shown 36.23- 98.34 in 30 mins. The rapid In-vitro dissolution was shown in the formulation F3 containing cross carmellose sodium.
Fig No: 5. Comparison In-vitro dissolution profile of F1, F2, F3 and F4 formulations
0 20 40 60 80 100 120
0 10 20 30 40
%
cum
ula
tiv
e
drug
re
lea
se
Time (min)
F1 % cumulative drug release
F2 % cumulative drug release
F3 % cumulative drug release
Fig No: 6. Comparison In-vitro dissolution profile of F5, F6, F7 and F8 formulations
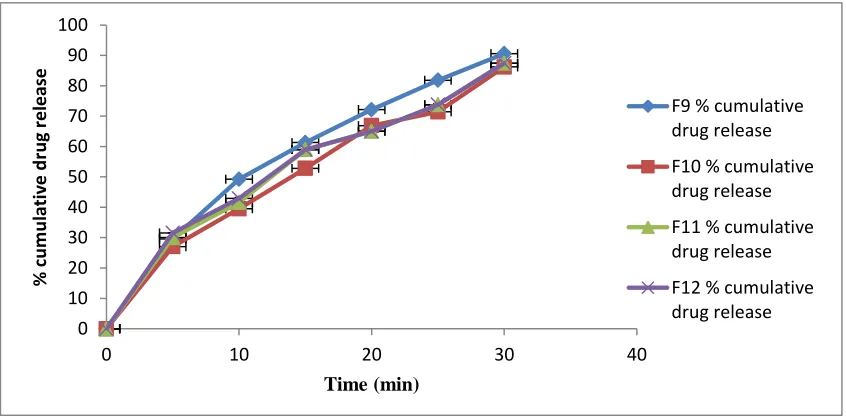
Fig No: 7. Comparison In-vitro dissolution profile of F9, F10, F11 and F12 formulations
0 10 20 30 40 50 60 70 80 90 100
0 10 20 30 40
%
cum
ula
tiv
e
drug
re
lea
se
Time (min)
F5 % cumulative drug release
F6 % cumulative drug release
F7 % cumulative drug release
F8 % cumulative drug release
0 10 20 30 40 50 60 70 80 90 100
0 10 20 30 40
%
c
u
m
u
lativ
e
d
ru
g
re
le
ase
Time (min)
F9 % cumulative drug release
F10 % cumulative drug release
F11 % cumulative drug release
Fig No: 8. Comparison In-vitro dissolution profile of F13, F14, F1 and F16 formulations
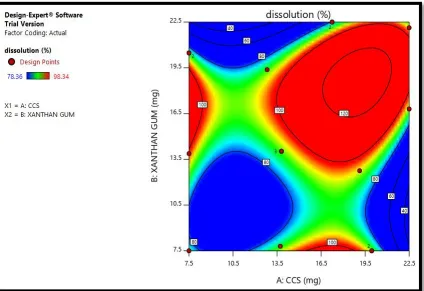
Percentage of drug release 3D graph by using Factorial design software 11.0 version
Figure No 9: Drug release (%)
0 10 20 30 40 50 60 70 80 90 100
0 5 10 15 20 25 30 35
%
cum
ula
tiv
e
drug
re
lea
se
Time (min)
F13 % cumulative drug release
F14 % cumulative drug release
F15 % cumulative drug release
Figure No 10: Drug release (%)
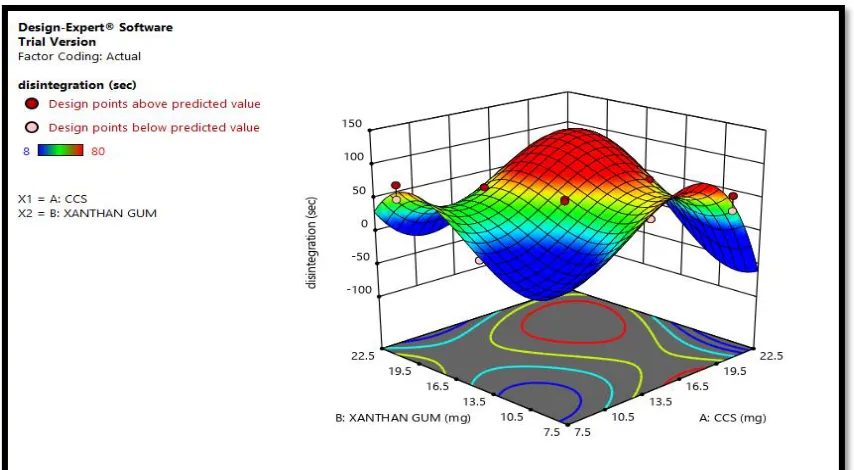
Disintegration of 3D graph by using Factorial design software 11.0 version
Figure No 12: Disintegration time (sec)
3D response surface plot showing the relationship between various levels of two factors on % cumulative drug release.
Accelerated stability studies
The optimized formulation was subjected to stability studies at 400C ± 75% RH for period of 3 months. Each tablet was individually wrapped in aluminium foil and packed in ambered coloured bottle and put at above specified condition in a heating
CONCLUSION
Fast dissolving tablets of Glibenclamide were prepares by using different super disintegrants like cross carmellose sodium and xanthan gum by direct compression method. Pre compression parameters were conducted for all formulations blend and were found to be satisfactory.
The prepared tablets were evaluated for various parameters like weight variation, content uniformity, hardness, thickness, in-vitro disintegration time, in-vitro dissolution. The results indicated that the tablets complied with the official specifications.
The disintegration studies shown F3 formulation disintegration time of 8 seconds and in-vitro drug release of 98.34%.
An accelerated stability study on optimized formulation was performed. The formulation was found to be stable; there was no change in the hardness, friability, disintegration time, and in-vitro drug release pattern.
In conclusion, it can be stated that the objective of the study has been achieved. From the above study the formula used for F3 formulation was concluded as an optimized formulation due to its less disintegration time and good % drug release when compared with other formulation.
REFERENCES
[1]. Debjit B, Chiranjib B, Krishna K, Chandira RM. Fast dissolving tablet: An overview. J Chem Pharm Res 1(1), 2009, 163-77.
[2]. Sastry VS, Ram NJ, Joseph AF. Recent technological advances in oral drug delivery – A review. PSTT 3, 2000, 139-44.
[4]. Sreenivas SA, Dandagi PM, Gadad AP, Godbloe AM, Hiremath SP, Mastiholimath VS. Orodispersible tablets: New-fangled drug delivery systems – A review. Indian J Pharm Educ Res 39(4), 2005, 177-81. [5]. Seager H. Drug-delivery products and the Zydis fast-dissolving dosage form. J Pharm Pharmacol 50(4),
1998, 375-82.
[6]. Bradoo R, Shahani S, Deewan B, Sudarshan S. Fast dissolving drug delivery system. J Am Med Assoc India 4(10), 2001, 27-31.
[7]. Bangale GS, Shinde GV, Stephen Rathinaraj B. New generation of orodispersible tablets: Recent advances and future propects. Int J Adv Pharm Sci 2, 2011, 17 -28.