R E S E A R C H A R T I C L E
Open Access
Pitfalls of improperly procured adjacent
non-neoplastic tissue for somatic mutation
analysis using next-generation sequencing
Lei Wei
1*†, Antonios Papanicolau-Sengos
2†, Song Liu
1†, Jianmin Wang
1†, Jeffrey M. Conroy
2†, Sean T. Glenn
3,
Elizabeth Brese
5, Qiang Hu
1, Kiersten Marie Miles
2, Blake Burgher
2, Maochun Qin
1, Karen Head
5, Angela R. Omilian
5,
Wiam Bshara
5, John Krolewski
2, Donald L. Trump
4,7, Candace S. Johnson
6and Carl D. Morrison
2*Abstract
Background:The rapid adoption of next-generation sequencing provides an efficient system for detecting somatic alterations in neoplasms. The detection of such alterations requires a matched non-neoplastic sample for adequate filtering of non-somatic events such as germline polymorphisms. Non-neoplastic tissue adjacent to the excised neoplasm is often used for this purpose as it is simultaneously collected and generally contains the same tissue type as the neoplasm. Following NGS analysis, we and others have frequently observed low-level somatic mutations in these non-neoplastic tissues, which may impose additional challenges to somatic mutation detection as it complicates germline variant filtering.
Methods:We hypothesized that the low-level somatic mutation observed in non-neoplastic tissues may be entirely or partially caused by inadvertent contamination by neoplastic cells during the surgical pathology gross assessment or tissue procurement process. To test this hypothesis, we applied a systematic protocol designed to collect multiple grossly non-neoplastic tissues using different methods surrounding each single neoplasm. The procedure was applied in two breast cancer lumpectomy specimens. In each case, all samples were first sequenced by whole-exome sequencing to identify somatic mutations in the neoplasm and determine their presence in the adjacent non-neoplastic tissues. We then generated ultra-deep coverage using targeted sequencing to assess the levels of contamination in non-neoplastic tissue samples collected under different conditions.
Results:Contamination levels in non-neoplastic tissues ranged up to 3.5 and 20.9 % respectively in the two cases tested, with consistent pattern correlated with the manner of grossing and procurement. By carefully controlling the conditions of various steps during this process, we were able to eliminate any detectable contamination in both patients.
Conclusion:The results demonstrated that the process of tissue procurement contributes to the level of contamination in non-neoplastic tissue, and contamination can be reduced to below detectable levels by using a carefully designed collection method. A standard protocol dedicated for acquiring adjacent non-neoplastic tissue that minimizes neoplasm contamination should be implemented for all somatic mutation detection studies.
Keywords:Somatic mutations, Tumor contamination, Adjacent normal tissues
* Correspondence:[email protected];[email protected] †Equal contributors
1
Department of Biostatistics and Bioinformatics, Roswell Park Cancer Institute, Buffalo, NY, USA
2Center for Personalized Medicine, Roswell Park Cancer Institute, Buffalo, NY,
USA
Full list of author information is available at the end of the article
Background
Cancer is a genetic disease largely caused by somatic muta-tions [1]. Identifying somatic mutamuta-tions provides funda-mental insights into the development, progression, and personalized treatment of cancer. Recent advances in next-generation sequencing (NGS) provide a very sensitive means for detecting somatic mutations in cancer, but vari-ant calling improves when matched non-neoplastic tissue is sequenced in parallel to filter out non-somatic events, such as germline polymorphisms or “normal” transcripts [2]. For solid neoplasms, the most commonly used non-neoplastic sources are blood, saliva, or non-non-neoplastic tis-sue adjacent to the neoplasm [2–9]. Compared with blood or saliva, the adjacent non-neoplastic tissue is conveniently collected during the same surgical procedure, and often consists of the same cell type as the neoplasm. However, we and others have frequently observed the presence of low level somatic mutations in these non-neoplastic adja-cent tissues in prior studies, which imposes additional chal-lenges in distinguishing somatic mutations from germline polymorphisms (Additional file 1: Figure S1) [10].
The presence of somatic mutations in adjacent non-neoplastic tissue may be explained by a “field effect” or by simple contamination by neoplastic tissue. The con-cept of the carcinogenesis field effect is not new, but has been recently re-defined as epithelium with “normal” morphology and genetic alterations that can result in the development of an overt malignant neoplasm [11, 12]. There is considerable literature supporting the field effect concept in malignancies from multiple organ systems [13–20]. However, for breast cancer, in particular, at least one report indicates that microscopically identifiable ma-lignant cells, attributed to tumor cell contamination, are often found in adjacent non-neoplastic breast tissue [21]. Such contamination of the matched non-neoplastic tissue can limit the sensitivity of a genomic analysis by inad-vertently excluding mutations that may be important for neoplasm progression, prognosis, or treatment.
To determine if sample contamination during tissue grossing and procurement is a major cause of the presence of somatic mutations in non-neoplastic tissues, we system-atically acquired multiple non-neoplastic tissues using dif-ferent collection methods around the same neoplasm, and assessed the presence of mutant alleles in non-neoplastic tissues using next-generation sequencing. By comparing the contamination levels of non-neoplastic tissues from differ-ent collection methods, we demonstrated in this study that neoplasm contamination can be reduced to below detect-able levels by using a carefully designed collection method.
Methods Specimens
The contamination problem was initially observed in a subset of previously sequenced breast cancers where the
neoplasm, adjacent non-neoplastic tissue and matched blood were all available (Additional file 1: Figure S1, S2). These specimens were grossed for the general purposes of variant discovery. The grossing procedure was not specifically designed for evaluating contamination problem so that information such as whether clean instruments were used as well as the distance from the neoplasm the non-neoplastic tissue was procured was not available. For further and more detailed analysis of the contamination problem specimens were collected from two breast lump-ectomies following a written grossing and tissue procure-ment protocol (Additional file 2: Suppleprocure-mental materials: Grossing and tissue procurement procedure for special col-lections). Grossing was performed by a certified Pathologist Assistant (PA). All patients were consented for specimen collection under an institutional approved IRB protocol. The final diagnosis for both specimens was invasive breast carcinoma. The neoplastic cellularity of the two breast lumpectomies was estimated to be 50 and 70 %, for Patient1 and Patient2, respectively.
Collection of adjacent non-neoplastic samples
The two breast lumpectomies were sectioned from left to right using one blade for the entire specimen (Fig. 1). Grossly non-neoplastic tissue, sectioned before the neoplasm, was designated “PA Clean” (PA: pathologist assistant). Grossly non-neoplastic tissue, sectioned after the neoplasm, was designated “PA Dirty”. Three tissue samples were obtained from each of the two sectioned lumpectomy specimens: a “PA Clean” section, a “PA Dirty” section, and a section of the neoplasm. The“PA Clean” section was placed in one Petri dish, while the “PA Dirty” section and the neoplasm section were placed in a second Petri dish (Fig. 1). Placing the “PA dirty” section and the neoplasm section in the second Petri dish was meant to mimic the way neoplasm and non-neoplasm samples are often allowed to interact during grossing (that is, without significant consideration by the grosser regarding possible microscopic contamin-ation of the non-neoplastic tissues).
Using a clean scalpel and forceps, the “PA Clean” section in the first Petri dish was cut in half. The first piece of the“PA Clean” section was cut in 300–500 mg pieces using clean forceps and scalpel, placed in a cryo-vial, and snap-frozen in LN2. This tissue was referred to
Using a new set of scalpel and forceps, the neoplasm section in the second Petri dish was cut into 300– 500 mg pieces. A neoplasm fragment was snap frozen in a container with liquid nitrogen (LN2) and transferred to
a cryovial. Using a new set of scalpel and forceps, the “PA Dirty”section (also located in the second Petri dish) was cut in half. The first piece of the“PA Dirty”section was cut in 300–500 mg pieces, placed into another cryo-vial and snap-frozen. Once frozen, the tissue was trans-ferred into a cryovial using the “clean” forceps. This tissue is referred to as PA “Dirty” and TP “Clean”, or “Dirty/Clean”. The second“PA Dirty”section was cut in 300–500 mg pieces using the“dirty” forceps and scalpel previously used to section the neoplasm fragment (see beginning of this paragraph) and placed directly in the container with LN2. Once frozen, the tissue was trans-ferred to a cryovial using the “dirty” forceps. This tissue was referred to as“PA Dirty” and “TP Dirty”, or“Dirty/ Dirty”.
To histologically evaluate the procured tissues, they were removed from storage and frozen sections were cut for the pathologist’s review. For each case, QC slides were cut, stained with H&E, and assessed by a patholo-gist for the presence of neoplasm or absence of neo-plasm. The full grossing procedure is in the Additional file 2: Supplemental Methods Section.
A matched peripheral blood sample was collected peri-operatively. DNA from the frozen breast tissues and the matched peripheral blood were extracted fol-lowing standard DNA extraction SOPs (Additional file 2: Supplemental methods).
Whole-exome sequencing
Each pool was normalized to 10 pM, loaded, and clustered to individual lanes of a HiSeq Flow Cell using an Illumina cBot (TruSeq PE Cluster Kit v3), followed by 2 × 101 PE sequencing on a HiSeq2500 sequencer according to the manufacturer's recommended protocol (Illumina, Inc.).
Targeted amplicon sequencing
The sequencing libraries were prepared using a two-step PCR method targeting approximately 300 bp surrounding the somatic variants of interest. Primers targeting the genomic regions were designed using Primer3 software (http://bioinfo.ut.ee/primer3-0.4.0/) and forward adaptor sequence 5’-TCGTCGGCAGCGTCAGATGTGTATAAG AGACAG-3’ and reverse adaptor sequence 5’-GTCTC GTGGGCTCGGAGATGTGTATAAGAGACAG-3’ were added to the primers necessary for the second round PCR amplification. The first round PCR utilized a gradient annealing temperature which decreased by 1 °C per cycle from 68 to 58 °C followed by 25 cycles with a 57 °C annealing temperature and 72 °C extension and 94 °C denature steps. Genomic (12.5 ng) DNA was used to amp-lify each of the target regions. After purification with AMPureXP beads (Beckman Coulter) and analysis on a Bioanalyzer DNA1000 chip (Agilent Technologies, Inc.) to ensure the desired target size, the amplicons from the same sample were normalized and pooled to a total of 15 ng using quantitation data from the Bioanalyzer. The amplicon pool from the first round PCR was amp-lified with eight cycles of PCR using a Nextera Index Kit (Illumina, Inc.), which uses primers that target the overhang adaptor sequence incorporated during the first round of PCR to add a unique indexed tag to each sample which allows pooling of libraries and multiplex se-quencing. Indexed libraries were purified with AMPureXP beads, run on a Bioanalyzer DNA1000 chip to verify de-sired size distribution, quantitated using a KAPA qPCR library quantitation kit (Kapa Biosystems) and pooled in an equimolar fashion to a final concentration of 4 nM. 2 × 150 cycle sequencing was performed on a MiSeq (Illumina, Inc.), according to the manufacturer’s protocol.
Somatic mutation detection from neoplasm and the matched blood samples
High quality paired-end reads passing the Illumina RTA filter were aligned to the NCBI human reference genome (hg19) using Burrows-Wheeler Aligner [22]. PCR dupli-cated reads were marked and removed by using Picard (http://broadinstitute.github.io/picard/). Putative SNVs and Indels were identified by running the variation detec-tion module of Bambino [23]. After initial variant calling, the predicted mutations were further filtered to remove po-tential false calls: (1) the alternative allele is present in the matched blood sample and the Fisher’s exact test P value not less than 0.05; (2) the mutant alleles are only present in
one of the two strands and the Fisher’s exact test p< 0.05; (3) the putative mutation occurs at a site with systematically dropped base quality scores, defined as more than 70 % of the mutant reads with Phred quality score reduced by at least 10 at the mutant base compared with the 5’or 3’side neighboring bases. All identified mutations were manually reviewed using Bambino viewer (Edmonson, Zhang et al. [23]). The functional effects were predicted by ANNOVAR [24] using RefSeq sequence database downloaded from NCBI on March 22, 2015.
Assessing contamination in non-neoplastic samples For each somatic mutation identified from the neoplasm whole-exome sequencing (WES) data, the mutation site was re-sequenced in all matched blood and non-neoplastic adjacent tissue, by either WES or TAS. The NGS reads at the mutation site were extracted from the BAM file and classified by mutation status into three groups: mutant, non-mutant (wild-type or a different allele), and unknown (e.g. low base quality). The mutation statuses of paired reads were consolidated and any read pairs where the for-ward and reverse reads had conflicting mutant status were excluded from the analysis. The coverage and VAF were calculated based on mutant and non-mutant read pairs. In WES, the relative contamination levels between samples were compared by using fractions of SNVs present in non-neoplastic data with at least one mutant read. In TAS, the contamination level in terms of the percentage of neoplasm content in each non-neoplastic sample was estimated by:(VAF_in_nonneoplastic_tissue -VAF_in_blood)/VAF_in_neoplasm based on individual SNVs.
Results
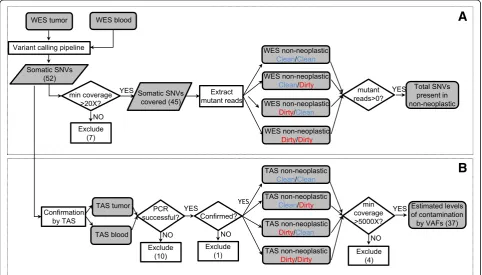
Due to the high sensitivity of NGS, standard grossing procedures may lead to frequent detection of contamin-ation in the adjacent non-neoplastic tissues, resulting in decreased somatic mutation detection sensitivity. There-fore, we evaluated two breast lumpectomies using a sys-tematic protocol for non-neoplastic sample collection designed to determine if the level of apparent contamin-ation can be affected by the specimen grossing and tis-sue procurement process (Fig. 1). The overall workflow of adjacent sample collection consists of two processes: Pathologist Assistant (PA) directed process and the Tissue Procurement (TP) process. For each of these two processes, we defined two conditions, referred to as “Clean”and“Dirty”, to denote different scenarios that pre-sumably lead to varying levels of contamination. These collection scenarios yield four types of adjacent non-neoplastic samples (described in detail in the Methods section): “Clean/Clean”, “Clean/Dirty”, “Dirty/Clean”, and “Dirty/Dirty”. The level of contamination in adjacent non-neoplastic tissues was assessed by comparing the adjacent tissues with a blood sample from the same individual, using whole-exome sequencing (WES) followed by tar-geted amplicon sequencing (TAS). An analytic flow chart identifies all steps in this process (Fig. 2), which consists of three sets of sequence determination: 1) identification ofde novo mutations in the neoplastic tissue which then
served as genetic markers of neoplasm contamination; 2) confirmation of the presence of these somatic mutations in the non-neoplastic samples; 3) precise measurement of contamination levels by comparing each non-neoplastic sample to blood. The first two goals were achieved by using WES. For the third goal, we used TAS to generate the needed ultra-deep coverage.
Identification of somatic mutations and initial assessment of tumor contamination using whole-exome sequencing Whole exome sequencing was performed on six sample types (neoplastic, blood, and four types of non-neoplastic tissues for evaluation purpose) for each of the two pa-tients. We generated an average of 193 million reads per sample, with mapping rate ranged from 94 to 99 %. The average coverage within the targeted region ranged from 85.6X to 279.3X in all samples, with a median of 206.3X. Most samples (10 of 12) had above 80 % of the targeted regions covered with at least 30X coverage (Additional file 3: Table S1).
Putative somatic mutations were identified by comparing neoplasm sample with the matched blood sample. In the current study, only single nucleotide variants (SNVs) were used in the estimation of neoplasm contamination. Small insertion/deletions (Indels) were excluded to avoid poten-tial bias due to the difficulty in mapping reads harboring
Indels [26]. For the current two breast carcinoma samples, we identified a total of 52 putative somatic SNVs (Fig. 2, Additional file 4: Table S2).
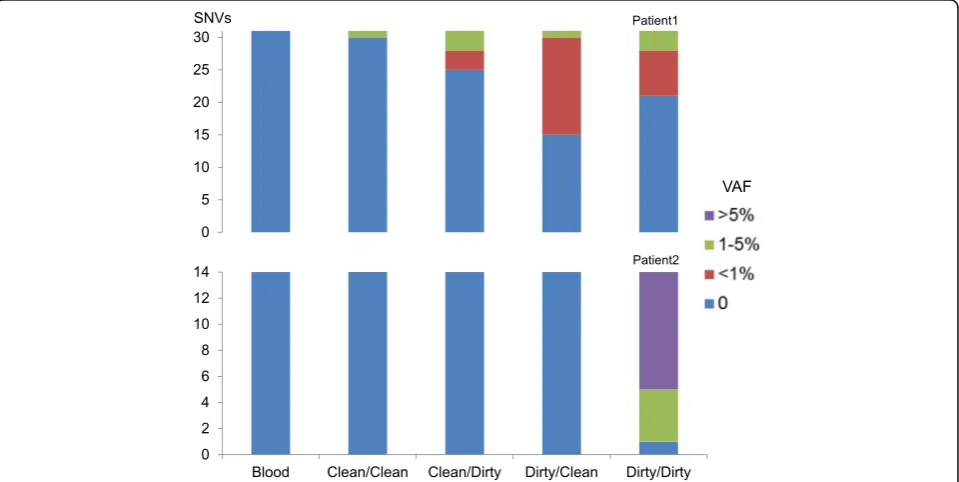
These SNVs were then used as markers to assess neo-plasm contamination in the WES data of the four types of non-neoplastic tissue samples. A minimum 20X coverage at the mutation site in all related samples was required, retaining 45 out of the 52 SNVs, including 31 in Patient1, 14 in Patient2 (Additional file 4: Table S2). The first indication of contamination was the evidence of somatic SNVs present in non-neoplastic tissue: in Patient1, Clean/Clean: 3 % (1/31), Clean/Dirty: 19 % (6/31), Dirty/Clean: 52 % (16/31), and Dirty/Dirty: 32 % (10/31), or 33 occurrences in total, had variant allele fraction (VAF) greater than zero. Of these, eight occurrences had VAFs between 1 and 5 % and the rest were less than 1 %. Noticeably, in Patient1, one SNV was present under the condition “Clean/Clean”. Upon further manual review of the raw BAM file, this SNV in gene CELF6 (Additional file 4: Table S2) had two mutant reads with the same read id, suggesting these two reads were from the same DNA insert (data not shown), possibly reflected artifacts during library prep-aration. In Patient2, none of the SNVs were present in the first three conditions (Clean/Clean, Clean/Dirty, and Dirty/Clean), but most SNVs (93 %, or 13/14, in-cluding four SNVs between 1 and 5 % and nine over 5 %) were present in the Dirty/Dirty condition (Fig. 3). No SNVs were present in the blood sample in either
case. Due to the limited coverage (Additional file 3: Table S1), these results by WES should only be considered as a first indication and might not accurately reflect con-tamination levels.
Accurate measurement of tumor contamination in non-neoplastic tissues using ultra-deep targeted amplicon sequencing
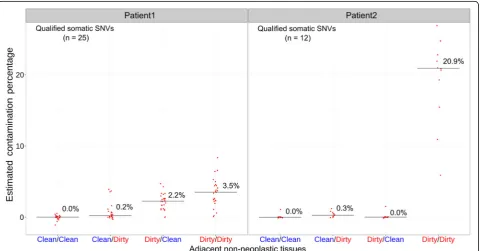
To obtain more precise measurements of neoplasm con-tamination level, ultra-deep coverage at the identified mutation sites was obtained using targeted amplicon se-quencing (TAS). TAS was first performed to confirm the NGS SNVs detected in the neoplasm and matched blood samples. Ten out of 52 SNVs had PCR failure and were excluded from further analyses. For the remaining pre-dicted SNVs, 41 of 42 were validated as somatic muta-tions, and one was determined to be a false positive. This false call did not affect the previous WES results (Fig. 3) because this variant was among the seven ex-cluded variants that did not meet the minimum 20X coverage requirement as shown in the overall flow chart (Fig. 2). The 41 validated somatic SNVs were then evalu-ated by TAS of all four types of adjacent non-neoplastic samples. A minimum coverage of 5000X in all TAS samples was required for all SNVs; four SNVs did not meet this requirement and were excluded from further analyses. For the 37 remaining SNVs (25 in Patient1, 12 in Patient2), the median coverage of each SNV across
all TAS samples ranged from 17,585X to 158,918X (Additional file 1: Figure S3).
The allele fractions of most SNVs ranged from 10 to 30 %, and were overall consistent between the two plat-forms (between WES and TAS:r2= 0.8663 and 0.7443 in Patient1 and Patient2, respectively) (Additional file 1: Figure S4). The neoplasm contamination levels were es-timated based on individual SNVs in all evaluated non-neoplastic samples. In Patient1, the medians of neoplasm contamination levels estimated by the 25 SNVs were 0.0, 0.2, 2.2, and 3.5 % for the four types of non-neoplastic samples (Clean/Clean, Clean/Dirty, Dirty/Clean, and Dirty/ Dirty), respectively. In Patient2, based on the 12 qualified SNVs, the median contamination levels were 0.0, 0.3, 0.0, and 20.9 % (Fig. 4, Additional file 5: Table S3).
Discussion
Tissue contamination is a well-known pitfall in path-ology laboratories and tissue processing [27], and is a particular challenge for NGS-based somatic alteration analyses because of the high sensitivity of this technique. The contamination of non-neoplastic tissue with low levels of mutant nucleic acids can cause somatic muta-tions to be misclassified as germline events and subse-quently be excluded from further analysis. Attempting to bioinformatically ‘rescue’ these missing somatic muta-tions is an additional challenge and may result in a high
false positive rate. These problems are best solved by min-imizing neoplasm contamination during sample gross-ing and procurement. However, until now, the relation between methods of non-neoplastic sample collection and neoplasm contamination has not been formally addressed. In this investigation, we tried to mimic the procedures that may occur during multiple steps of non-neoplastic tissue collection. Our results provide clear evidence that neoplasm contamination in adjacent non-neoplastic samples can be reduced by optimizing the collection protocol at every step. In both tested lumpectomies, the “Clean/Clean” protocol was shown to have the lowest level of contamination, while the "Dirty/Dirty" protocol generated the highest level of contamination (Fig. 4). The lumpectomy from Patient1 had an incremental pro-gression of increasing estimated neoplasm contamin-ation from Clean/Clean, to Clean/Dirty, to Dirty/Clean, to Dirty/Dirty. This suggests that both “Pathologist Assistant” and “Tissue Procurement” stages could con-tribute to contamination. However, the specimen from Patient2 did not have such an incremental progression. Instead, there was a relatively small amount of contami-nation in the Clean/Dirty condition, no contamicontami-nation in the Dirty/Clean condition, and very high relative con-tamination in the Dirty/Dirty condition. This suggests that there was no carryover of neoplasm when the speci-men was initially sectioned. One possible explanation is
that during the initial sectioning of the specimen, neo-plastic cells were carried over mostly in the sections im-mediately after the neoplasm. Sampling from the less-contaminated distal portions of the specimen may ex-plain the lack of contamination. However, since we did not keep track of the distance between the neoplasm and the tissue subsequently tested for contamination, we cannot evaluate further.
It is worth re-iterating that in the“PA dirty”condition, non-neoplastic tissue and a neoplasm section were placed in the same Petri dish to mimic the way neo-plasm and non-neoneo-plasm samples are often allowed to interact during grossing. As such, contamination that occurred during the initial sectioning of the specimen and contamination that occurred during the interaction of neoplasm and non-neoplastic tissue in the Petri dish cannot be distinguished.
Despite the fact that the neoplastic cellularity was esti-mated to be 50 and 70 % for Patient1 and Patient2, re-spectively, the VAF of the detected variants by WES and TAS tended to be significantly lower (Additional file 1: Figure S4). There are various possible explanations for this such as heterozygous status, over-representation of non-neoplastic cells, copy number changes, and hetero-geneity within the neoplasm.
Another possible explanation of the presence of vari-ants in non-neoplastic tissue is field effect. Previously, oncogenic copy number gains in common breast cancer driver genes had been found in microscopically normal breast cells outside the tumor [28]. Due to the scope of the current study, we did not assess the possibility of a field effect in a detailed fashion, which would require sampling of non-neoplastic tissues at various distance intervals from the neoplasm. Also, we did not consider the potential effect of circulating tumor cells or tumor DNA. Since the variants were not detectable under Clean/Clean condition by deep sequencing, field effect or circulating tumor cells or DNA is unlikely to be the major cause in the current study.
Most variants caused by contamination in non-neoplastic data appeared to be low frequency event (<10 %) in the current WES. Previous study on cross-patient contamination showed that as little as 2 % con-taminations could cause significant increase of mutation burden due to false positives [29, 30]. For within-patient contaminations in control sample, to the best of our knowledge, there has been no systematic evaluation pub-lished on the effects on somatic mutation calling. Since algorithms have different levels of tolerance for muta-tions present in control, the ones with higher tolerance may lose fewer variants, but at the cost of increased false positive due to germline events. A safer approach might be excluding control samples with known contamination issues [31].
For future somatic analyses involving germline gen-etic material, using peripheral blood or other difficult-to-contaminate tissues as sources is a reasonable strategy. However, when grossed material is the only source of non-neoplastic sample, a specialized grossing protocol will be beneficial. First, the individual grossing the specimen should always be aware of the gross features of neoplasms. Second, clean non-neoplastic tissue should be collected from an area sectioned before the neoplasm is sectioned. Third, the non-neoplastic tissue and neoplasm/neo-plasm-contaminated-tissue should be processed in sep-arate work areas. Finally, the instruments used to cut the non-neoplastic tissue should be clean instruments that have not previously come in contact with the neoplasm.
Conclusions
We have demonstrated that clean grossing and procure-ment techniques can minimize the chance of neoplasm contamination in adjacent non-neoplastic tissue, which may improve the detection of somatic mutation. Al-though this is a pilot study that included only two lump-ectomy specimens and the analysis consisted of DNA sequencing alone, our results provide clear evidence that the methods used in sample grossing and procurement can play a trivial role in obtaining high quality non-neoplastic tissue samples. It is important that protocols for tissue grossing and procurement account for con-tamination reduction measures, thereby facilitating the acquisition of high quality, non-contaminated adjacent non-neoplastic tissues which can be used to maximize the accuracy of molecular testing.
Availability of supporting data
Additional files
Additional file 1:Supplementary figures S1-4.Figure S1.An example of previous observation of neoplasm contamination in adjacent non-neoplastic tissues.Figure S2.An example of one somatic mutation (BRCA2S3041*) present in the matched normal data from adjacent non-neoplastic tissue.
Figure S3.Coverage by targeted capture sequencing (TAS).Figure S4.
Concordance of variant allele fraction (VAF) between whole-exome sequencing (WES) and targeted capture sequencing (TAS). (PPTX 925 kb)
Additional file 2:Supplementary methods, description of tables, figure legends and references. (DOCX 33 kb)
Additional file 3: Table S1.Coverage summary of whole-exome se-quencing (WES). (XLSX 12 kb)
Additional file 4: Table S2.Detailed information of all somatic mutations identified by WES, including coverage, variant allele fraction (VAF) and the predicted amino acid changes. (XLSX 19 kb)
Additional file 5: Table S3.Detailed information of all somatic mutations in targeted amplicon sequencing (TAS), including coverage, VAF and estimated contamination level. (XLSX 20 kb)
Abbreviations
Indel:Small insertion/deletion; IRB: Institutional review board; NGS: Next-generation sequencing; PA: Pathologist assistant; SNV: Single nucleotide variation; TAS: Targeted amplicon sequencing; TP: Tissue procurement; VAF: Variant allele fraction; WES: Whole-exome sequencing
Acknowledgements
The RPCI Bioinformatics Shared Resource, Clinical Data Network, Data Bank and BioRepository, Genomics Shared Resource and Pathology Resource Network are CCSG Shared Resources supported by NIH grant P30 CA016056.
Funding
This work was supported by the Roswell Park Alliance Foundation.
Availability of data and materials
The raw data for whole-exome sequencing and targeted sequencing are available upon request.
Author’s contributions
LW, APS, SL, JW, JMC and CDM designed the study. LW, APS, SL, JW, JMC, STG, EB, QH, KMM, BB, MQ, KH, ARO, WB, DLT, CSJ and CDM performed experiments and analyzed data. LW, APS, SL, JW, JMC and CDM wrote the manuscript, STG, EB, QH, KMM, BB, MQ, KH, ARO, WB, JK, DLT, CSJ assisted in preparing the manuscript. All authors read and approved the final manuscript.
Competing interests
The authors declare that they have no competing interests.
Consent for publication
Not applicable.
Ethics approval and consent to participate
The Roswell Park Cancer Institute (RPCI) Institutional Review Board (IRB) gave approval for this study. The patient was consented for next generation sequencing, remnant tissue procurement, and collection of blood through RPCI IRB-approved protocols.
Author details
1Department of Biostatistics and Bioinformatics, Roswell Park Cancer Institute,
Buffalo, NY, USA.2Center for Personalized Medicine, Roswell Park Cancer Institute, Buffalo, NY, USA.3Department of Cancer Genetics, Roswell Park Cancer Institute, Buffalo, NY, USA.4Department of Medicine, Roswell Park Cancer Institute, Buffalo, NY, USA.5Department of Pathology, Roswell Park Cancer Institute, Buffalo, NY, USA.6Department of Pharmacology and Therapeutics, Roswell Park Cancer Institute, Buffalo, NY, USA.7Inova Dwight & Martha Schar Cancer Institute, Falls Church, VA, USA.
Received: 20 January 2016 Accepted: 7 October 2016
References
1. Stratton MR. Exploring the genomes of cancer cells: progress and promise. Science. 2011;331(6024):1553–8.
2. Jones S, Anagnostou V, Lytle K, Parpart-Li S, Nesselbush M, Riley DR, Shukla M, Chesnick B, Kadan M, Papp E, et al. Personalized genomic analyses for cancer mutation discovery and interpretation. Sci Transl Med. 2015;7(283):283ra253. 3. Ding L, Getz G, Wheeler DA, Mardis ER, McLellan MD, Cibulskis K, Sougnez C,
Greulich H, Muzny DM, Morgan MB, et al. Somatic mutations affect key pathways in lung adenocarcinoma. Nature. 2008;455(7216):1069–75. 4. Cancer Genome Atlas Research N. Comprehensive genomic characterization
defines human glioblastoma genes and core pathways. Nature. 2008; 455(7216):1061–8.
5. Network TCGAR. Corrigendum: Comprehensive genomic characterization defines human glioblastoma genes and core pathways. Nature. 2013;494(7438):506. 6. Cancer Genome Atlas Research N. Comprehensive genomic characterization
of squamous cell lung cancers. Nature. 2012;489(7417):519–25. 7. Kandoth C, McLellan MD, Vandin F, Ye K, Niu B, Lu C, Xie M, Zhang Q,
McMichael JF, Wyczalkowski MA, et al. Mutational landscape and significance across 12 major cancer types. Nature. 2013;502(7471):333–9. 8. The Cancer Genome Atlas Research N. Comprehensive molecular
characterization of urothelial bladder carcinoma. Nature. 2014;507(7492):315–22. 9. Zhu Q, Hu Q, Shepherd L, Wang J, Wei L, Morrison CD, Conroy JM, Glenn ST,
Davis W, Kwan ML, et al. The Impact of DNA Input Amount and DNA Source on the Performance of Whole-Exome Sequencing in Cancer Epidemiology. Cancer Epidemiol Biomarkers Prev. 2015;24(8):1207–13.
10. Wang Q, Jia P, Li F, Chen H, Ji H, Hucks D, Dahlman KB, Pao W, Zhao Z. Detecting somatic point mutations in cancer genome sequencing data: a comparison of mutation callers. Genome Med. 2013;5(10):91.
11. Slaughter DP, Southwick HW, Smejkal W.“Field cancerization”in oral stratified squamous epithelium. Clinical implications of multicentric origin. Cancer. 1953;6(5):963–8.
12. Chai H, Brown RE. Field effect in cancer–an update. Annals of Clinical & Laboratory Science. 2009;39(4):331–7.
13. Franklin WA, Gazdar AF, Haney J, Wistuba II, La Rosa FG, Kennedy T, Ritchey DM, Miller YE. Widely dispersed p53 mutation in respiratory epithelium. A novel mechanism for field carcinogenesis. J Clin Investig. 1997;100(8):2133–7. 14. Takahashi T, Habuchi T, Kakehi Y, Mitsumori K, Akao T, Terachi T, Yoshida O.
Clonal and chronological genetic analysis of multifocal cancers of the bladder and upper urinary tract. Cancer Res. 1998;58(24):5835–41. 15. Prevo LJ, Sanchez CA, Galipeau PC, Reid BJ. p53-mutant clones and field
effects in Barrett's esophagus. Cancer Res. 1999;59(19):4784–7.
16. Heaphy CM, Bisoffi M, Fordyce CA, Haaland CM, Hines WC, Joste NE, Griffith JK. Telomere DNA content and allelic imbalance demonstrate field cancerization in histologically normal tissue adjacent to breast tumors. Int J Cancer. 2006; 119(1):108–16.
17. Rivenbark AG, Coleman WB. Field cancerization in mammary carcinogenesis -Implications for prevention and treatment of breast cancer. Exp Mol Pathol. 2012;93(3):391–8.
18. Foschini MP, Morandi L, Leonardi E, Flamminio F, Ishikawa Y, Masetti R, Eusebi V. Genetic clonal mapping of in situ and invasive ductal carcinoma indicates the field cancerization phenomenon in the breast. Hum Pathol. 2013;44(7):1310–9. 19. Hawthorn L, Lan L, Mojica W. Evidence for field effect cancerization in
colorectal cancer. Genomics. 2014;103(2–3):211–21.
20. Martincorena I, Roshan A, Gerstung M, Ellis P, Van Loo P, McLaren S, Wedge DC, Fullam A, Alexandrov LB, Tubio JM, et al. Tumor evolution. High burden and pervasive positive selection of somatic mutations in normal human skin. Science. 2015;348(6237):880–6.
21. Sadanandam A, Lal A, Benz SC, Eppenberger-Castori S, Scott G, Gray JW, Spellman P, Waldman F, Benz CC. Genomic aberrations in normal tissue adjacent to HER2-amplified breast cancers: field cancerization or contaminating tumor cells? Breast Cancer Res Treat. 2012;136(3):693–703. 22. Li H, Durbin R. Fast and accurate short read alignment with
Burrows-Wheeler transform. Bioinformatics. 2009;25(14):1754–60.
23. Edmonson MN, Zhang J, Yan C, Finney RP, Meerzaman DM, Buetow KH. Bambino: a variant detector and alignment viewer for next-generation sequencing data in the SAM/BAM format. Bioinformatics. 2011;27(6):865–6. 24. Wang K, Li M, Hakonarson H. ANNOVAR: functional annotation of genetic variants
from high-throughput sequencing data. Nucleic Acids Res. 2010;38(16), e164. 25. Cree IA, Deans Z, Ligtenberg MJL, Normanno N, Edsjö A, Rouleau E, Solé F,
26. Mose LE, Wilkerson MD, Hayes DN, Perou CM, Parker JS. ABRA: improved coding indel detection via assembly-based realignment. Bioinformatics. 2014; 30(19):2813–2815.
27. Layfield LJ, Witt BL, Metzger KG, Anderson GM. Extraneous tissue: a potential source for diagnostic error in surgical pathology. Am J Clin Pathol. 2011; 136(5):767–72.
28. Forsberg LA, Rasi C, Pekar G, Davies H, Piotrowski A, Absher D, Razzaghian HR, Ambicka A, Halaszka K, Przewoznik M, et al. Signatures of post-zygotic structural genetic aberrations in the cells of histologically normal breast tissue that can predispose to sporadic breast cancer. Genome Res. 2015;25(10):1521–35. 29. Cibulskis K, McKenna A, Fennell T, Banks E, DePristo M, Getz G. ContEst:
estimating cross-contamination of human samples in next-generation sequencing data. Bioinformatics. 2011;27(18):2601–2.
30. Cibulskis K, Lawrence MS, Carter SL, Sivachenko A, Jaffe D, Sougnez C, Gabriel S, Meyerson M, Lander ES, Getz G. Sensitive detection of somatic point mutations in impure and heterogeneous cancer samples. Nat Biotechnol. 2013;31(3):213–219.
31. Alioto TS, Buchhalter I, Derdak S, Hutter B, Eldridge MD, Hovig E, Heisler LE, Beck TA, Simpson JT, Tonon L, et al. A comprehensive assessment of somatic mutation detection in cancer using whole-genome sequencing. Nat Commun. 2015;6:10001.
• We accept pre-submission inquiries
• Our selector tool helps you to find the most relevant journal • We provide round the clock customer support
• Convenient online submission • Thorough peer review
• Inclusion in PubMed and all major indexing services • Maximum visibility for your research
Submit your manuscript at www.biomedcentral.com/submit