© 2017, IRJET | Impact Factor value: 5.181 | ISO 9001:2008 Certified Journal
| Page 1751
due to the need of column free space, aesthetical view and functional requirement. The building located on sloping ground is irregular and unsymmetrical in both vertical and horizontal planes and torsionally coupled. In this present study fourteen number of ten storey RCC building frame models are considered, out of which seven models are step back building frames in which six models are step back building with floating columns at different location and one is step back building without floating column and remaining seven models are step back-set back in which six models are step back-set back building with floating columns at different location and one is step back –set back building without floating column are considered. The pushover analysis is performed for the considered fourteen models as per IS 1893:2002 & ATC 40, using ETABS version 9.7.4. From the pushover analysis the properties of the buildings such as time period, displacement, storey shear, storey drift, and performance point have been studied for different models.
Key Words: Floating column, sloping ground, pushover
analysis
1.INTRODUCTION
Now a day, rapid construction is taking place in hilly areas due to scarcity of plain ground. As a result the hilly areas have marked effect on the buildings in terms of style, material and method of construction leading to popularity of multi-storeyed structures in hilly regions. Due to sloping profile, the various levels of such structures step back towards the hill slope and may also have set back also at the same time. The step-back structures usually have the number of story’s decreasing successively at the bottom in each bay, in the direction of the slope maintaining same roof level, where as step back-set back buildings do not have same roof level. These structures become highly uneven and asymmetric, due to variation in mass and stiffness distributions on different vertical axis at each floor. Such construction in earthquake zone areas makes them to attract greater shear forces and torsion compared to normal construction.
Floating column is also a vertical member, the columns Float or move in above stories such that to provide more open
open space is accessible for assembly hall or parking purpose.
1.1 MODEL DESCRIPTION
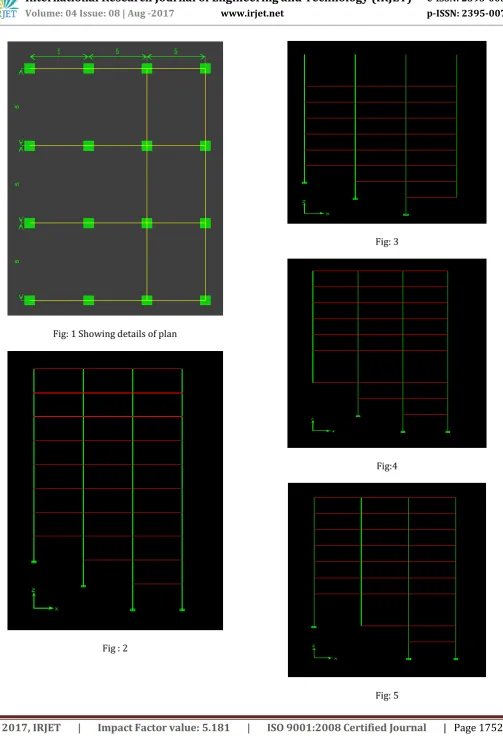
Basically the model consist of 3 bays with 10 story building, each bay having a dimension of 5m in X direction 5m in Y direction. The story height is kept 3m .the beam size is of 0.3x0.45m and the column size is of 0.6x0.85m.The slab thickness is 0.125m. The building is to be situated in the seismic zone 5 with medium soil. The floor finish 1kN/m2
and live load 3kN/m2 are consider and concert grade of M25
and M30 and the grade of steel Fe-500 are assumed for study. These model were analyzed using pushover analysis method in ETABS
2.1 Models under Study
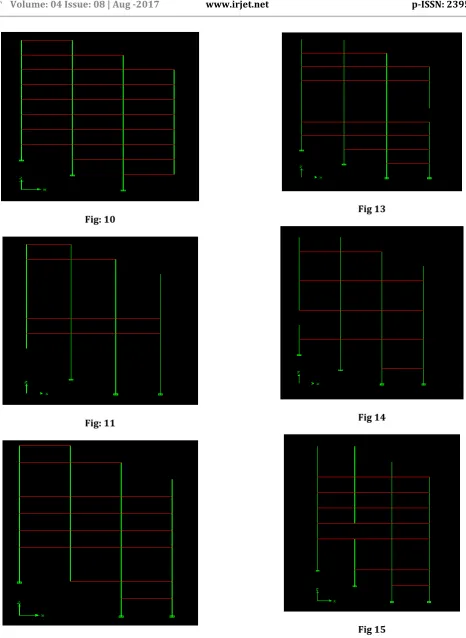
2.1.1 Set 1: Step Back Buildings on Sloping Ground
MODEL NO DESCRIPATION
Model -1 Step back building without floating column as shown in fig 2
Model -2 Step back building with floating column at right side of the corner as shown in fig 3
Model -3 Step back building with floating column at left side of the corner as shown in fig 4
Model -4 Step back building with floating column at center of the floor as shown in fig 5 Model -5 Step back building with floating column
at right side of the corner at 5th storey
as shown in fig 6
Model -6 Step back building with floating column at left side of the corner at 5th storey as
shown in fig 7
Model -7 Step back building with floating column at center of the floor at 5th storey as
© 2017, IRJET | Impact Factor value: 5.181 | ISO 9001:2008 Certified Journal
| Page 1752
[image:2.595.51.266.99.378.2]Fig: 1 Showing details of plan
Fig : 2
Fig: 3
Fig:4
[image:2.595.50.272.409.690.2]© 2017, IRJET | Impact Factor value: 5.181 | ISO 9001:2008 Certified Journal
| Page 1753
Fig: 6
Fig: 7
Fig: 8
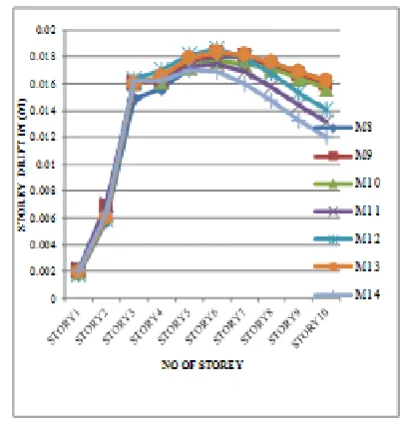
Model -11 Step back-set back building with floating column at center of the floor as shown in fig 12
Model -12 Step back-set back building with floating column at right side of the corner at 5th storey as shown in fig 13
Model -13 Step back-set back building with floating column at left side of the corner at 5th storey shown in fig 14
Model -14 Step back-set back building with floating column at center of the floor at 5th storey as shown in fig 15
© 2017, IRJET | Impact Factor value: 5.181 | ISO 9001:2008 Certified Journal
| Page 1754
Fig: 10
Fig: 11
Fig: 12
[image:4.595.61.528.67.706.2]Fig 13
Fig 14
Fig 15
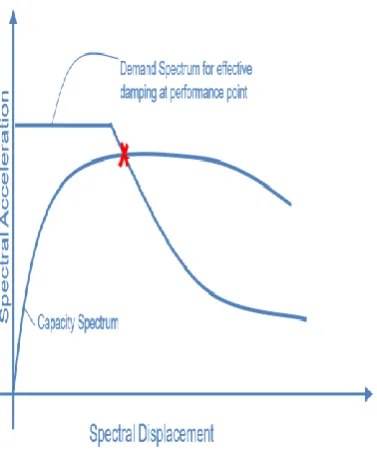
3. PUSHOVER ANALYSIS
© 2017, IRJET | Impact Factor value: 5.181 | ISO 9001:2008 Certified Journal
| Page 1755
1.32 1.34 1.36 1.38 1.4 1.42 1.44M1 M2 M3 M4 M5 M6 M7
TI M E P ER IO D I N (S EC ) MODEL NO
Fig-16 Fundamental time period for (model-1 to model-7 for step back) by pushover analysis
Table-2 Fundamental time period for (8 to model-14 for step back-set back) by pushover analysis
1.16 1.18 1.2 1.22 1.24 1.26
M8 M9 M10 M11 M12 M13 M14
Fig-17 Fundamental time period for (model-8 to model-14 for step back) by pushover analysis
step back
Fig-19 lateral displacement in transverse direction for step back-set back
0 0.1 0.2 0.3 0.4 0.5 D IS P L A C E M E N T I N ( M )
NO OF STOREY
M8 M9 M10 M11 M12 M13 M14
Fig-20 lateral displacement in longitudinal direction
Fig-21 lateral displacement in transverse direction
M7 1.359
MODEL
NO TIME PERIOD (IN SEC)
M8 1.193
M9 1.211
M10 1.245
M11mmmm M10 M11 1.195
M12 1.205
M13 1.205
© 2017, IRJET | Impact Factor value: 5.181 | ISO 9001:2008 Certified Journal
| Page 1756
Set 1:lateral displacement for step back
It is seen that by pushover analysis the displacement along longitudinal direction are increased by 5.8%, 5.6%, 2.7%, 5.3%, 5.5%, 1.2% for model 2,3,4,5,6,7 respectively compared to model-1.
It is seen that by pushover analysis the displacement along transverse direction are increased by 1.01%, 6.08%, 3.6%, 4.6%, 4.2%, 1.2%, for models 2,3,4,5,6,7 respectively compared to model-1
Set 2: lateral displacement for step back-set back
It is seen that by pushover analysis the displacement along longitudinal direction are increased by 8.4%, 12.5%, 3.8%, 13.5%, 10.9%, 7.1% for models 9,10,11,121,13,14, respectively compared to model-8.
It is seen that by pushover analysis the displacement along transverse direction are increased by 2.1%, 4.5%, 1.5%, 1.05%, 12.06%, 5.12%, models 9,10,11,12,13,14 respectively compared to model-8
0 0.002 0.004 0.006 0.008 0.01 0.012 0.014 0.016 0.018 0.02 S T O R E Y D R IF T I N (M )
NO O F STOREY
[image:6.595.324.541.97.303.2]M1 M2 M3 M4 M5 M6 M7
Fig 22 Showing storey drift in x-direction for step back
Fig 23 Showing storey drift in Y-direction for step back
0 0.005 0.01 0.015 0.02 0.025 S T ORE Y DR IF T I N (M )
NO OF STOREY
[image:6.595.332.534.352.566.2]M8 M2 M3 M4 M5 M6 M7
[image:6.595.55.269.382.513.2]Fig 24 Showing storey drift in x-direction for step back-set back
Fig 25 Showing storey drift in Y-direction for step back-set back
3.1 PERFORMANCE POINT
[image:6.595.50.272.548.667.2]© 2017, IRJET | Impact Factor value: 5.181 | ISO 9001:2008 Certified Journal
| Page 1757
[image:7.595.60.537.436.561.2]Fig 26
Table 3: Performance parameter for step back building for longitudinal direction
MODEL NO BASE
SHEAR (kN) DISPLACEMENT (m) ACCELERATION SPECTARL (m/s2)
SPECTRAL DISPLACEMENT
(m)
M1 1964.24 0.207 0.095 0.142
M2 1554.29 0.232 0.081 0.166
M3 1566.27 0.283 0.072 0.191
M4 1945.55 0.212 0.093 0.145
M5 1536.95 0.240 0.79 0.170
M6 1549.85 0.259 0.075 0.177
M7 1737.83 0.239 0.084 0.165
Table 4: Performance parameter for step back building for transverse direction
MODEL NO BASE SHEAR
(kN)
DISPLACEMENT
(m) ACCELERATION SPECTRAL (m/s2)
SPECTRAL DISPLACEMENT
(m)
M1 1797.00 0.224 0.85 0.163
M2 1506.76 0.267 0.075 0.183
M3 1467.60 0.289 0.068 0.207
M4 1774.19 0.224 0.083 0.163
M5 1449.31 0.275 0.072 0.189
M6 1464.17 0.275 0.070 0.196
[image:7.595.57.540.593.744.2]© 2017, IRJET | Impact Factor value: 5.181 | ISO 9001:2008 Certified Journal
| Page 1758
Set 1: Displacement at performance point for step back building
It is seen that by pushover analysis the displacement along longitudinal direction are increased by 10.77%, 26.85%, 20.36%, 13.75%, 20%, 13.3% for model 2, 3, 4, 5, 6, 7 respectively compared to model-1.
It is seen that by pushover analysis the displacement along transverse direction are increased by 16.10%, 22.49%, 16.10%, 22.49%, 18.54%, 10.5%, for model 2, 3, 4, 5, 6, 7 respectively compared to model-1.
Set 1: Base shear at performance point for step back building It is seen that by pushover analysis the base shear along longitudinal direction are decreased by 20.87%, 20.26%, 1%, 21.75%, 21.09%, 11.52% for model 2, 3, 4, 5, 6, 7 respectively compared to model-1.
[image:8.595.58.537.270.395.2]It is seen that by pushover analysis the base shear along transverse direction are decreased by 16.19%, 18.3%, 1.27%, 19.36%, 18.52%, 7%, for model 2, 3, 4, 5, 6, 7 respectively compared to model-1.
Table 5: Performance Parameter for step back-set back building for longitudinal direction
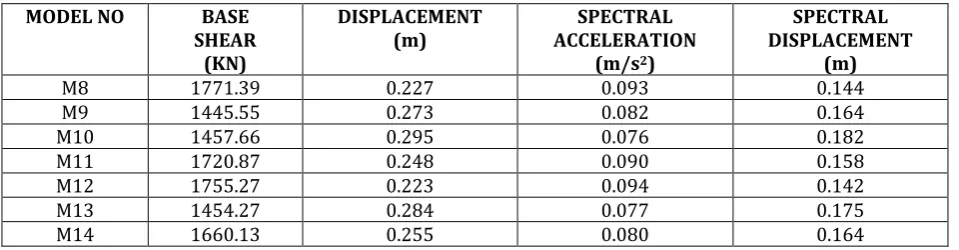
Table 6: Performance Parameter for step back-set back building for transverse direction
MODEL NO BASE
SHEAR (KN)
DISPLACEMENT
(m) ACCELERATION SPECTRAL (m/s2)
SPECTRAL DISPLACEMENT
(m)
M8 1771.39 0.227 0.093 0.144
M9 1445.55 0.273 0.082 0.164
M10 1457.66 0.295 0.076 0.182
M11 1720.87 0.248 0.090 0.158
M12 1755.27 0.223 0.094 0.142
M13 1454.27 0.284 0.077 0.175
M14 1660.13 0.255 0.080 0.164
Set 2: Displacement at performance point for step back-set back building
Pushover analysis results shows that the displacements along longitudinal directon are increased by 13.3%, 26.37%, 10.26%, 4.28%, 18.95%, 12.60%, for model 9, 10, 11, 12, 13, 14 respectively compared to model-8.
Pushover analysis results shows that the displacements along transverse directon are increased by 16.84%, 23.05%, 8.46%, 5.46%, 20.07%, 10.98%, for model 9, 10, 11, 12, 13, 14, respectively compared to model-8.
Set 2: Base shear at performance point for step back-set back building
Pushover analysis results shows that the base shear along longitudinal directon are decreased by 21.95%, 18.36%,
7.08%, 0.22%, 19.46%, 10.86%, for model 9, 10, 11, 12, 13, 14, respectively compared to model-8.
Pushover analysis results shows that the base shear along transverse directon are decreased by 18.39%, 17.71%, 2.85%, 0.21%, 17.89%, 6.2%, for model 9, 10, 11, 12, 13, 14, respectively compared to model-8.
4. Conclusions
From this present study the following conclusions are drawn
1. It is concluded that building with provision of floating column at corner on any floor shows the poor performance compared to other cases. Hence provision of floating columns at corner should be considered as critical case, hence special attention is needed.
MODEL NO BASE SHEAR
(kN) DISPLACEMENT (m) ACCELERATION SPECTRAL (m/s2 )
SPECTRAL DISPLACEMENT
(m)
M8 1965.79 0.201 0.108 0.125
M9 1534.19 0.232 0.090 0.148
M10 1604.82 0.273 0.082 0.169
M11 1826.45 0.224 0.100 0.142
M12 1961.31 0.210 0.110 0.133
M13 1583.15 0.248 0.086 0.155
[image:8.595.60.540.426.551.2]© 2017, IRJET | Impact Factor value: 5.181 | ISO 9001:2008 Certified Journal
| Page 1759
5. It is observed that in step back-set back building on sloping ground maximum displacement decreases when compared to step back building on sloping ground without floating column.
6. The performance of step back frames during seismic excitation prove to be more vulnerable in comparison with step back-set back building frames, hence step back-set back building frames are desirable then the step back frames.
7. The displacement at performance point of a building with floating column is more compared to building frame without floating column located on sloping ground.
8. The base shear at performance point of building without floating column is more as compared to building with floating column on sloping ground.
5. REFERENCES
1. B.G. Birajdar, S.S. Nalawade. “Seismic Analysis Of buildings resting On Sloping ground” Vancouver, B.C., Canada August 1-6, 2004 Paper No. 1472. 2. Hardik Bhensdadia1, Siddharth Shah, “ Pushover
analysis Of RC frame Structure with floating column and Soft storey In different earthquake Zones” IJRET journal paper No 114
3. Kalyanrao, Gude Ramakrishna.” Pushover
analysis of sloping ground RC buildings”. IJRET volume 3-issue6 (june-2014). Paper No. 866 4. Mohammed Umar Farooque Patel Et Al. “A
Performance Study And Seismic evaluation Of RC frame buildings On sloping ground ”. IOSR Journal Of Mechanical And Civil Engineering WWW.IOSR journals.Org. paper No 51
5. Mohammad Abdul Imran Khan Et Al. “Buildings on Sloping Ground Are More Vulnerable To Earthquakes”.
6. Narayan Kalsulkar And Satish Rathod “
Seismic analysis of RCC building resting on sloping ground with varying number of bays and hill slopes”. IJCET journal volume 5.No.3 (june 2015) paper No 2063
7. Nikhi.N.Varma, S.A.Bhalchandra, master’s
Student, “Pushover Analysis of RC Building with and without Floating Column”. IJTRA journal volume 4,