R E S E A R C H
Open Access
Improved detection of gene-microbe
interactions in the mouse skin microbiota
using high-resolution QTL mapping of 16S
rRNA transcripts
Meriem Belheouane
1,2, Yask Gupta
3, Sven Künzel
1, Saleh Ibrahim
3†and John F. Baines
1,2*†Abstract
Background:Recent studies highlight the utility of quantitative trait locus (QTL) mapping for determining the contribution of host genetics to interindividual variation in the microbiota. We previously demonstrated that similar to the gut microbiota, abundances of bacterial taxa in the skin are significantly influenced by host genetic variation. In this study, we analyzed the skin microbiota of mice from the 15th generation of an advanced intercross line using a novel approach of extending bacterial trait mapping to both the 16S rRNA gene copy (DNA) and transcript (RNA) levels, which reflect relative bacterial cell number and activity, respectively.
Results:Remarkably, the combination of highly recombined individuals and 53,203 informative SNPs allowed the identification of genomic intervals as small as <0.1 megabases containing single genes. Furthermore, the inclusion of 16S rRNA transcript-level mapping dramatically increased the number of significant associations detected, with five versus 21 significant SNP-bacterial trait associations based on DNA- compared to RNA-level profiling,
respectively. Importantly, the genomic intervals identified contain many genes involved in skin inflammation and cancer and are further supported by the bacterial traits they influence, which in some cases have known genotoxic or probiotic capabilities.
Conclusions:These results indicate that profiling based on the relative activity levels of bacterial community members greatly enhances the capability of detecting interactions between the host and its associated microbes. Finally, the identification of several genes involved in skin cancer suggests that similar to colon carcinogenesis, the resident microbiota may play a role in skin cancer susceptibility and its potential prevention and/or treatment.
Keywords:QTL mapping, Skin microbiota, 16S rRNA transcript, Skin cancer
Background
Mammals host a wide range of complex and diverse mi-crobial communities in association with their barrier or-gans, which contribute to critical aspects of host biology. Accordingly, many studies of the resident microbiota in the past decade provided primary surveys in a variety of different contexts (e.g., organ, disease state, genotype,
development, geography) [1–5]. A salient feature of these studies is the revealing of substantial diversity be-tween individuals. Thus, a thorough understanding of the fundamental factors that govern the assembly and stability of bacterial communities is of critical import-ance. Broadly speaking, studies addressing these ques-tions identify the environment, diet, and host genetics as important contributors to interindividual variation in host-associated communities [6–8].
The influence of host genetics on bacterial community structure has been addressed by a number of different approaches in human and mouse models, such as twin studies [9, 10], comparison of mouse inbred strains [11,
* Correspondence:[email protected] †Equal contributors
1
Max Planck Institute for Evolutionary Biology, August-Thienemann-Str. 2, 24306 Plön, Germany
2Institute for Experimental Medicine, Christian-Albrechts-University of Kiel,
Arnold-Heller-Str. 3, 24105 Kiel, Germany
Full list of author information is available at the end of the article
© The Author(s). 2017Open AccessThis article is distributed under the terms of the Creative Commons Attribution 4.0
12], quantitative trait locus (QTL) analysis [13, 14], and more recently first genome-wide association studies [15–19]. These studies provide valuable insights into the role of host genetics in shaping the structure of the bac-terial communities, although are largely limited to gut communities.
The skin offers numerous niches for microbes and ac-cordingly harbors complex bacterial communities [20], which differ between distinct body sites and individuals. However, individuals display greater intrapersonal than interpersonal similarity within a specific skin habitat over time [21, 22], suggesting that in addition to other principles governing community stability, host genetics may be a contributing factor to these observed patterns. In a recent study, we addressed whether host genetic variation contributes to variation in the skin microbiota in mice by employing a QTL mapping approach to the fourth generation of an advanced intercross line (AIL) [23]. This revealed a total of 13 regions of the mouse genome significantly associated to skin bacterial traits, although the large size of the defined genomic regions (from 9 to 33 megabases) did not easily allow for more detailed characterization of the individual genes involved.
In this study, we aimed to improve the mapping reso-lution of QTLs for skin microbial abundances by using the 15th generation of the previously used AIL [23], which we generated through the continuous random intercrossing of individuals, and by increasing the marker density to 53,203 informative SNPs. Further-more, we introduced a novel means of microbial pheno-typing in a QTL context by performing 16S ribosomal RNA (rRNA) profiling at both the gene copy (DNA) and transcript (RNA) levels, which reflect relative bacterial cell number and activity, respectively. Our analysis re-veals numerous genomic regions associated with skin microbial abundances, in several cases containing single immune- and/or skin cancer-related genes, whereby 16S rRNA transcript-level profiling was considerably more effective in terms of the number of associations identi-fied. This suggests that bacterial activity levels may pro-vide deeper insight into mechanisms of host-microbe interactions than DNA-level profiling alone.
Results
Skin microbiota composition in the AIL mapping population
In order to fine-map genomic regions influencing bac-terial taxon abundances in the skin, we analyzed a total of 270 mice from the 15th generation (hereafter G15) of
the same AIL from which we previously analyzed the 4th generation (G4) [23]. An important factor to
con-sider when analyzing the G15 mice is that the AIL was
transferred from an animal facility at the University of
Rostock to a new animal facility at the University of Lübeck, shortly after the analysis of the G4 mice was
conducted. Thus, prior to QTL mapping, we conducted a thorough ecological analysis of the G15 mice in order
to re-evaluate the bacterial taxa present and to aid the interpretation of mapping results. Furthermore, given that the skin harbors comparatively low biomass com-munities and is in constant contact with the environ-ment, we reasoned that bacterial 16S rRNA transcripts may in some cases better reflect true resident skin bac-teria interacting with their host. Thus, we performed 16S rRNA gene amplicon (V1–V2 hypervariable regions) sequencing on the Illumina MiSeq platform using both bacterial genomic DNA and RNA reverse transcribed into complementary DNA (cDNA) as template. In total, we analyzed nearly two million sequences after quality filtering and processing, with a normalized coverage of 3500 sequences per sample for each of the DNA- and RNA-based datasets, which we refer to as the“standing” and“active”communities, respectively.
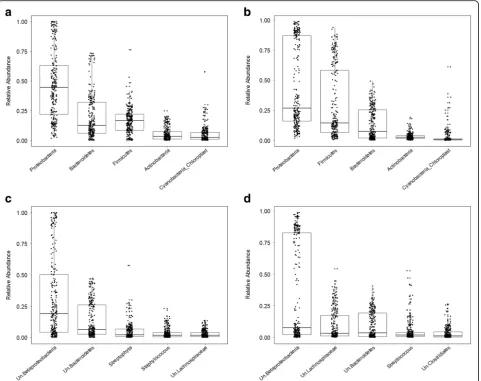
First, we analyzed community composition at the phylum and genus levels (Fig. 1). Overall, the mean rela-tive abundances of the major phyla and genera vary largely between the standing and active datasets (Table 1). Proteobacteria is the most abundant phylum in both standing and active datasets (46 and 44%, re-spectively) and does not significantly differ between them. Bacteroidetes and Firmicutes, on the other hand, display significant contrasting patterns between the standing and active communities, with Bacteroidetes be-ing more abundant at the DNA compared to the RNA level (19 versus 13%, respectively) and Firmicutes being almost twofold more abundant at the RNA compared to the DNA level (29 versus 16%, respectively). Actinobac-teria and CyanobacActinobac-teria make up a smaller proportion of the standing communities (5.3 and 4.7%, respectively) and are further significantly reduced in the active com-munities (3 and 2.5%, respectively). These relative pat-terns at the RNA compared to the DNA level are also largely reflected by the respective most abundant genera belonging to each of these phyla (Fig. 1c, d; Table 1).
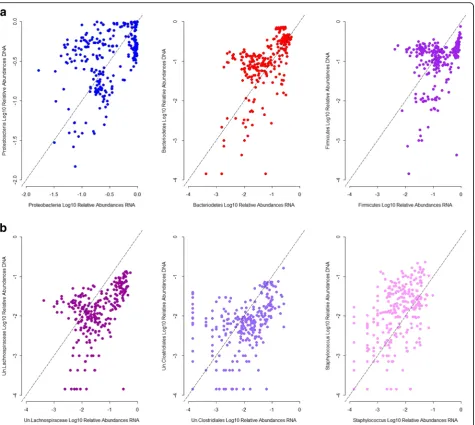
To further examine the correspondence of abundances at the DNA and RNA levels for a single taxon, we inves-tigated their correlations. Among the most abundant taxa, we observe overall moderate to poor correlations; Proteobacteria, Bacteroidetes, unclassified Lachnospira-ceae, unclassified Clostridiales, andStaphylococcus abun-dances show a moderate, positive, and significant correlation, whereas Firmicutes abundances correlate poorly between the standing and active datasets (Fig. 2a, b). This indicates that the presence and activity of taxa vary distinctively across individuals and bacterial groups.
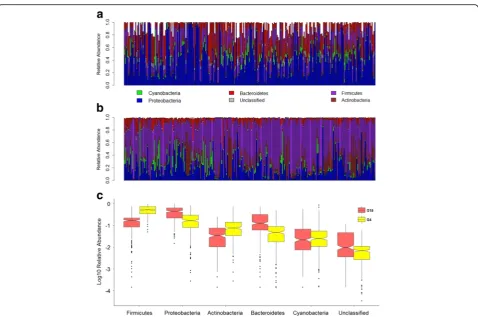
there is a large degree of overlap in terms of the major taxa present, significant differences between these two mouse cohorts are already apparent among phylum-level abundances, whereby the former G4cohort is dominated
by Firmicutes in contrast to the G15, which is dominated
by Proteobacteria (Fig. 3a–c). Systematic community-level differences are also clearly revealed by beta diver-sity analyses (Additional file 1), whereby the standing and active communities of the G15 display much more
similarity to each other than either does to the standing communities of the G4, despite the differences in
abun-dance between the DNA- and RNA-based profiling out-lined above.
Patterns of variation among Core Measurable Microbiota taxa
For further analysis, we defined a “Core Measurable Microbiota” (CMM) [13] (see “Methods”) for the G15
Fig. 1Relative abundances of phyla and genera. The five most abundant phyla and genera are shown.aMajor phyla in standing (DNA-based) communities.bMajor phyla in active (RNA-based) communities.cMajor genera in standing (DNA-based) communities.dMajor genera in active (RNA-based) communities.Ununclassified
Table 1Mean relative abundances of major taxa between standing and active communities in the G15population
Rank Taxon Paired Wilcoxon test
Phylum Proteobacteria 0.43
Phylum Bacteroidetes 1.68 × 10⁻¹²
Phylum Firmicutes 3.97 × 10⁻¹¹
Phylum Actinobacteria 2.24 × 10⁻⁵
Phylum Cyanobacteria_Chloroplast 3.97 × 10⁻¹¹
Genus Streptophyta 6.65 × 10⁻¹⁰
Genus Staphylococcus 6.04 × 10⁻¹⁰
Genus Un.Lachnospiraceae 2.2 × 10⁻¹⁵
Genus Streptococcus 6.65 × 10⁻¹⁰
Genus Un.Clostridiales 1.5 × 10⁻⁵
Significantpvalues (≤0.05) after Benjamini-Hochberg [27] correction for mul-tiple testing are indicated in italics
population, which in total contains 92 taxa from the genus to the phylum level and 44 species-level oper-ational taxonomic units (OTUs). The CMM traits repre-sent a small fraction (9 and 0.2%, for CMM taxa and OTUs, respectively) of all detected taxa, but their cumu-lative abundances represent more than 90 and 60% of taxon and OTU abundances, respectively, within the en-tire standing and active datasets. Due to the known technical challenges of metagenomic analysis of low mi-crobial biomass samples such as the skin [24, 25], we evaluated the possible influence of contamination during experimental procedures on our ability to reliably meas-ure the CMM and other traits included in the QTL
analysis (CMM traits plus those previously significant in the G4 population, see below) using “SourceTracker”
[26]. This analysis reveals minimal estimates of contam-ination for the mapped genera and species-level OTUs (97% similarity threshold), whereby estimates for the ac-tive communities are in each case lower (mean ± stand-ard deviation, genus: DNA 5.2 ± 3.4%, RNA 3.8 ± 3.5%; OTU: DNA 3.2 ± 2.2%, RNA 2.5 ± 2.5%).
To assess the degree of interindividual variation within each CMM trait, we calculated summary statistics of the relative abundances in the standing and active datasets (Additional files 2, 3, 4, and 5). The relative abundances of the CMMs vary greatly across individuals. For Fig. 2Correlation between standing and active relative abundances for representative taxa.aPhyla.bGenera. Spearman’s correlation:
Proteobacteria:r= 0.42,p= 4.19 × 10⁻¹³; Bacteroidetes:r= 0.66,p= 3.3 × 10⁻¹⁶; Firmicutes:r= 0.39,p= 2.72 × 10⁻¹¹; Un.Lachnospiraceae:r= 0.56,p
example, in the standing communities, unclassified Beta-proteobacteria ranges from 1.5 to 100%, while Staphylo-coccus_OTU16varies from 1.3 to 17.3%. Examples in the active communities include Campylobacter, which ranges from 2.1 to 31.9%, and Acinetobacter_OTU18, which ranges from 0.7 to 44.9%. As expected, the most abundant CMMs harbor the highest dispersion across individuals, whereas the least abundant ones display tighter dispersion.
To measure the influence of the cage environment, gender, and age on the interindividual variation in the CMMs, we built a mixed effects model for each CMM trait using the log10-transformed relative abundance as
the response variable, gender and age as fixed explana-tory variables, and cage as a random term, separately for the standing and active communities. Accordingly, we quantified the fractions of total variance explained by each of these factors (Additional files 6, 7, 8, and 9), which varies considerably across CMM traits and be-tween the standing and active datasets. For example, in the standing communities, only 0.52% of the total vari-ance in Enterobacteriaceae abundvari-ance is explained by cage, whereas cage explains 32.98% of the total variance
in Deltaproteobacteria abundance, and similar patterns are observed for the active communities. Within individ-ual CMM traits, some display large correspondence be-tween the standing and active communities (e.g., cage explains 21.14 and 17.20% of variation in Peptostrepto-coccaceae abundance in DNA- and RNA-based data, re-spectively), whereas others do not (e.g., cage explains 12.05 compared to 0% of the variation inAlistipes abun-dance in DNA- compared to RNA-based data, respect-ively). On average, the fraction of total variance explained by cage is higher in the standing compared to active communities (DNA: genus to phylum taxa 12.91%, species 12.67%; RNA: genus to phylum taxa 10.58%, species 9.42%). Similar to the cage environment, the variance explained by gender and age also fluctuates substantially across CMM traits and their relative pat-terns in the standing and active communities. However, the fraction of total variance explained by gender and age combined is higher in the active compared to stand-ing communities (DNA: genus to phylum taxa 12.44%, species 12.59%; RNA: genus to phylum taxa 25.26%, spe-cies 16.61%). Importantly, after accounting for cage, gen-der, and age effects, the remaining residual variation still Fig. 3Comparison of skin microbiota composition between G4and G15populations.aBar plot of phylum abundances in the G15population.b
Bar plot of phylum abundances in the G4population.cBoxplots of log10-transformed mean relative abundances of major phyla in populations G4
comprises the greatest proportion of total variance for nearly all CMM traits. The residuals for all mapped traits are provided in Additional file 10.
QTL mapping of the skin microbiota in the G15
To identify regions of the host genome influencing vari-ation in skin microbial traits in the G15 population, we
performed linkage mapping (see “Methods”) on the 136 CMM traits described in addition to alpha diversity. Fur-ther, in an attempt to potentially replicate previously identified QTLs, we additionally included those CMM traits that showed significant associations with the host genome in the G4and are present in the G15, but do not
meet the criteria to be defined as part of the CMM in the G15. In total, we identified 13 significant (p≤0.05)
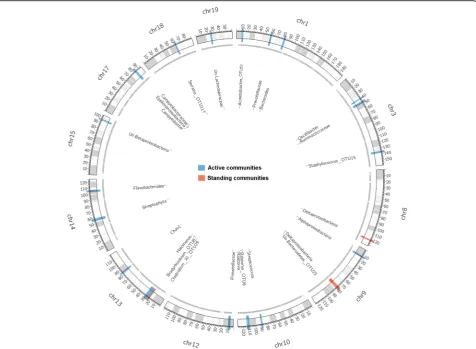
and 12 suggestive (p≤0.1) QTLs among the standing and active community traits (Fig. 4, Table 2). Notably, QTL sizes span narrow confidence intervals ranging from 5 to 0.08 Mb, which in some cases contain single genes, and the phenotypic variance explained by
individual peak SNPs averaged across all traits accounts for approximately 9% of the total variance. Five QTLs are defined for the standing communities, two of which have pleiotropic effects. For example, the genomic re-gion on chromosome 9, ranging from 77 to 80 Mb, is as-sociated with variation in both Deltaproteobacteria and Bacteroidetes_OTU23. In comparison, 21 QTLs are present among the active communities, none of which overlap with those identified for the standing communi-ties. Two of the active QTLs are for Prevotellaceae, whereas the same region is identified at the genus and species levels forRalstonia(Table 2). Further, we identi-fied a single QTL influencing genus-level alpha diversity (Chao1) in the active communities.
To further evaluate the reliability of bacterial traits as measured by NGS-based methods, we independently an-alyzed three bacterial traits for which QTLs were de-tected (Betaproteobacteria, Epsilonproteobacteria, and
Streptococcus) by performing qPCR measurements on a random subset of 80 mice using group-specific primers.
Fig. 4QTL mapping of the standing and active microbiota in the G15population. Only chromosomes with identified QTLs are shown.Black lines
The relative abundances assessed by sequence profiles and qPCR estimates display significant positive correla-tions for all three traits (Spearman’s correlation: Epsilon-proteobacteria: r= 0.40, p= 0.0003; unclassified Betaproteobacteria: r= 0.25, p= 0.02; Streptococcus: r= 0.36, p= 0.0012; p values corrected according to Benjamini-Hochberg [27]), thus supporting the reliability of our bacterial phenotyping methods.
To determine whether we replicate previously detected QTLs in the G4population, we compared the identified
genomic regions in the G15 to our previous study [23].
The most promising trait isNeisseria, which was associ-ated to chromosome 14 (confidence interval 56 to 69 Mb) in the G4 population. In G15, the confidence
interval ranges from 60.55 to 60.98 Mb, the LOD score of the peak SNP is 9.01, and the percent explained vari-ance is 14.24%, although it is not significant at our deter-mined genome-wide thresholds (Additional file 11). We did, however, discover four genomic regions contained within regions previously detected in the G4that are
sig-nificantly associated with four CMM traits in the G15
population (Table 2), although the bacterial taxa are not the same.
In addition, we compared the intervals detected in our G15 analysis to published human GWAS and mouse
QTL studies. While none of the loci previously
associated with skin microbial traits in humans [16, 28] were contained within our G15intervals, we detect some
overlap with QTL studies of the gut microbiota in mice [3, 13]. These include the QTL on chromosome 10 (111.57–113.68 Mb) for the genus Ralstoniaand corre-sponding OTUs, which overlaps with a pleiotropic gen-omic region from Benson et al. [13] on chromosome 10 associated with Coriobacteriaceae (106–122 Mb) and
Lactococcus and Streptococcaceae (100–111 Mb). Add-itionally, our QTL on chromosome 12 (6.59–8.05 Mb) for Prevotellaceae overlaps with a QTL on chromosome 12 (−26 Mb) for Ruminococcaceae identified by Benson et al. [13]. Finally, our QTL located on chromosome 15 (95.01–95.39 Mb) for unclassified Betaproteobacteria overlaps with a QTL for Rikenellaceae on chromosome 15 (92.73–97.39 Mb) identified by McKnite et al. [3].
Analysis of candidate regions
Due to the narrow confidence intervals identified in the G15, we were able to identify many promising candidate
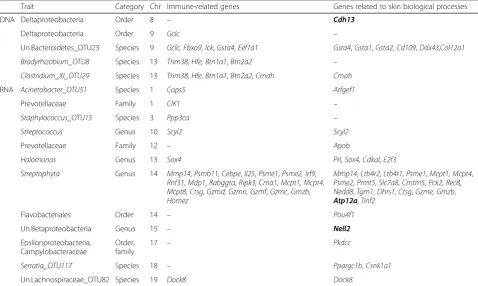
genes. In Table 3, we list the genes related to the im-mune response and/or other skin biological processes contained within our confidence intervals whose tions are supported by experimental evidence. The func-tions of the potential candidate genes are further summarized in Additional file 12 and can largely be
Table 3List of potential candidate genes located in the defined confidence intervals
Trait Category Chr Immune-related genes Genes related to skin biological processes
DNA Deltaproteobacteria Order 8 – Cdh13
Deltaproteobacteria Order 9 Gclc –
Un.Bacteroidetes_OTU23 Species 9 Gclc, Fbxo9,Ick,Gsta4, Eef1a1 Gsta4,Gsta1,Gsta2,Cd109,Ddx43,Col12a1
Bradyrhizobium_OTU8 Species 13 Trim38,Hfe, Btn1a1,Btn2a2 –
Clostridium_XI_OTU29 Species 13 Trim38,Hfe,Btn1a1,Btn2a2,Cmah Cmah
RNA Acinetobacter_OTU51 Species 1 Cops5 Arfgef1
Prevotellaceae Family 1 ClK1 –
Staphylococcus_OTU15 Species 3 Ppp3ca –
Streptococcus Genus 10 Scyl2 Scyl2
Prevotellaceae Family 12 – Apob
Halomonas Genus 13 Sox4 Prl,Sox4,Cdkal,E2f3
Streptophyta Genus 14 Mmp14,Psmb11,Cebpe,Il25,Psme1,Psme2, Irf9,
Rnf31,Mdp1,Rabggta,Ripk3,Cma1, Mcpt1,Mcpt4,
Mcpt8,Ctsg,Gzmd, Gzmn, Gzmf,Gzmc,Gmzb,
Homez
Mmp14,Ltb4r2,Ltb4r1,Psme1,Mcpt1, Mcpt4,
Psme2,Prmt5,Slc7a8,Cmtm5,Pck2, Rec8,
Nedd8,Tgm1,Dhrs1,Ctsg,Gzme, Gmzb,
Atp12a,Tinf2
Flavobacteriales Order 14 – Pou4f1
Un.Betaproteobacteria Genus 15 – Nell2
Epsilonproteobacteria, Campylobacteraceae
Order, family
17 – Pkdcc
Serratia_OTU117 Species 18 – Ppargc1b, Csnk1a1
Un.Lachnospiraceae_OTU82 Species 19 Dock8 Dock8
Only genes whose functions are experimentally demonstrated to be related to immune response and/or to other skin biological processes are reported. Genes in bold indicate the presence of the peak SNP
divided into five diverse groups: immune response, inter-action with bacteria and viruses, skin developmental processes, susceptibility to autoimmune diseases, and susceptibility to skin cancer. Genes belonging to the lat-ter two groups are the most frequent. Regarding skin cancer, we find genes involved in squamous cell carcin-oma (SCC), melancarcin-oma, actinic keratosis, skin hyperpig-mentation, and epithelial dysplasia. For autoimmune diseases, we report genes mainly associated with psoria-sis, inflammatory arthritis, acute allergic reaction, and ichthyosis.
The significance of the biological functions listed above is also supported by pathway and gene ontology enrichment analyses, which in addition reveal further in-teresting functions (Additional files 13 and 14). Among the enriched pathways are several involved in apoptosis and tissue homeostasis including apoptotic DNA frag-mentation and tissue homeostasis, granzyme A-mediated apoptosis, caspase cascade in apoptosis, and the effects of calcineurin in keratinocyte differentiation. Additional significantly enriched pathways include glu-tamate metabolism activities, which are also revealed by the biological process analysis. Interestingly, glutamate is a key neurotransmitter of the central nervous system, but recent studies show that glutamate receptors are expressed in non-neuronal tissues such as the skin and that glutamate signaling is dysregulated in numerous cancer forms including melanoma [29, 30]. Further path-ways include immune-related functions (e.g., B cell re-ceptor signaling pathway, fMLP-induced chemokine
gene expression in HMC-1 cells, and MEF2D in T cell apoptosis) and, interestingly, the nitric oxide signaling pathway. Of note, nitric oxide plays diverse biological functions, and in the skin, it is involved in the mainten-ance of barrier function, melanogenesis, erythema, im-munosuppression, and the protection of keratinocytes against UV-induced apoptosis [31, 32]. On the other hand, the biological process analysis reveals phosphate ion metabolism as the most enriched term. Previous studies show that phosphate, a critical element for divid-ing cells, likely modulates the activity of cancer cells [33], and elevated levels of serum phosphate have been related to lung and skin carcinogeneses in mouse models [34]. Additional enriched terms include regulation of cell polarity and several transport functions (e.g., anion, cat-ion, sodium, and acidic amino transport).
Two exceptional candidate regions are those associ-ated with Deltaproteobacteria (standing communities) and unclassified Betaproteobacteria (active communi-ties), which each contain only a single gene: cadherin 13 (Cdh13) and neural epidermal growth factor-like 2 (Nell2), respectively (Fig. 5). Cdh13 codes for a cell ad-hesion molecule that is specifically expressed in the basal keratinocytes of the human and mouse epidermis [35].
Cdh13expression is also observed to be significantly re-duced in both invasive cutaneous SCC and psoriasis vul-garis lesions and is thus considered to be an endogenous negative regulator of keratinocyte proliferation and also a crucial preserver of healthy skin architecture [36–38].
Nell2, on the other hand, is reported to be specifically
expressed in the epidermis (keratinocytes) of patients suffering from atopic dermatitis [39]. Several other note-worthy candidates are described in the“Discussion.”
Discussion
In this study, we performed the first high-resolution genetic mapping of skin microbial traits in the mouse genome. While the overall degree of replication between the G4 and G15 is low (possible reasons are discussed
below), up to five genomic regions display some evi-dence of overlap between the two cohorts, and the greatly improved results of the G15analysis provide
sev-eral points of novel insight into the nature of host-microbe interactions in the skin. This is on the one hand made possible by the highly advanced nature of the mapping population (i.e., the 15th generation of an ad-vanced intercross) and high marker density (>50,000 in-formative SNPs). On the other hand, we also introduced a novel means of microbial“phenotyping” in a QTL set-ting by performing 16S rRNA profiling on the transcript level, which proved to be more effective in detecting sig-nificant associations. One of the most surprising and in-triguing aspects of our findings is the preponderance of identified candidate genes involved in cancer-related processes, which is also supported by aspects of the mi-crobial traits themselves as discussed below.
Comparison between the G4and G15populations
Many potential factors could contribute to the overall lack of replication we observe between the G4and G15
study. From the genetic perspective, Greene et al. [40], for example, addressed the question of failing to repli-cate genetic associations between distinct datasets and concluded (using simulations) that in part, changes in al-lele frequency can lead to opposite allelic effects on the phenotype. Further, a recent QTL study of the gut microbiota performed on two distinct generations of the same advanced intercross line (generations 4 and 10) similarly replicated and refined only four genomic re-gions in the more advanced generation, whereby three of the QTLs concerned phylogenetically related traits be-tween cohorts. The authors explained that this poor rep-lication could be due to false-positive QTLs and/or a disparate microbiome composition between the genera-tions as a result of phenotypic and/or genotypic drift [41]. Indeed, in our study, we note significant changes in community composition that occurred between the G4
and G15, which is not surprising given the movement
be-tween two different animal facilities and the multitude of factors concerned with animal husbandry known to influence the microbiome [42].
Moreover, we note that an additional aim of the G4
study was to simultaneously evaluate the role of host genetics for skin microbiota composition and
susceptibility to autoimmune skin blistering, for which we induced an immunization-based disease model in a subset of the G4 mice [23]. This could in part explain,
e.g., the significantly higher proportion of Firmicutes in the G4 compared to the G15 (ANOVA, p= 2.2 × 10⁻¹⁶),
as this phylum is known to dominate the skin micro-biota in the context of inflammatory disorders such as psoriasis and atopic dermatitis [43, 44]. However, we note that this difference can not be solely due to disease in the G4, as a subset of these animals was not
immu-nized and Firmicutes are uniformly distributed across in-dividuals (Fig. 3b).
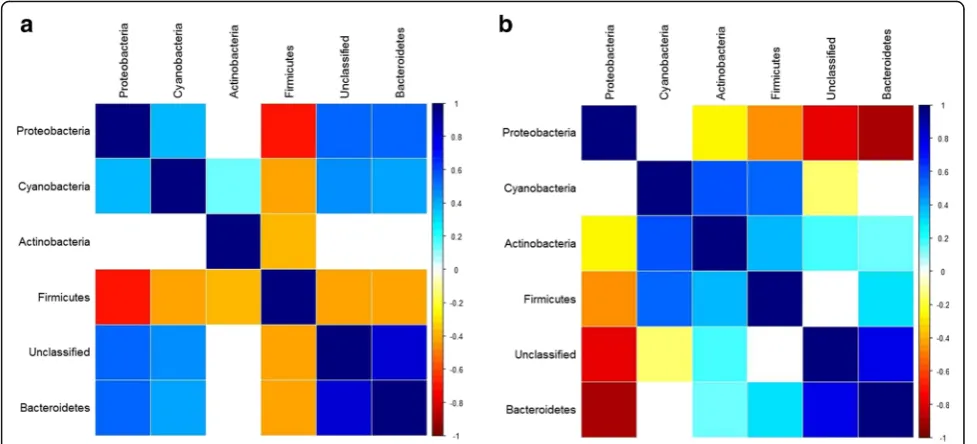
Finally, although our mapping approach treats each microbial taxon as an independent trait, microbial abun-dances may also change in an interrelated manner due to complex community interactions. To determine whether interdependencies between taxa may have chan-ged in the context of the community-level differences we observe between the G4 and G15, we inspected the
interactions between the relative abundances of CMM phyla within each population and indeed observe crucial changes in community interactions. In the G4
popula-tion, every phylum is strongly negatively correlated with Firmicutes, with Proteobacteria showing the strongest negative association (Fig. 6a). In the G15population, we
observe the opposite pattern; every phylum is negatively correlated with Proteobacteria, with Bacteroidetes exhi-biting the strongest negative relationship (Fig. 6b). Thus, a change in the overall structure of community interac-tions between the two cohorts may also alter the nature of host genetic influence on the skin community, i.e., our observations may in part represent gene x environ-ment interactions.
16S rRNA profiling at the DNA versus RNA level
peak that defines a significant QTL on the RNA level does not reach the genome-wide significance threshold for DNA.
Second, in contrast to the example of the unclassified Betaproteobacteria QTL described above, we observe an overall poor correlation between the taxon abundances at the DNA versus RNA level, which in some cases is charac-terized by taxa with high activity but low abundance (see, e.g., unclassified Lachnospiraceae in Fig. 2). Thus, it is likely that many taxa observed at the RNA level are below the limits of reliable measurement at the DNA level. Fur-ther, observations at the bacterial transcript level may be more likely to be representative of interaction with the host. This hypothesis is consistent with previous observa-tions of DNA- versus RNA-level bacterial community pro-filing in a dynamic aquatic habitat, where bacterial activity, but not presence alone, varied along with fluctua-tions in environmental parameters [45].
Candidate genes and bacterial traits
In addition to the genomic intervals for which only sin-gle genes are present (Cdh13 and Nell2, above), several other regions contain highly interesting candidate genes, whose potential functional role in host-microbe interac-tions is in some cases further supported by the bacterial traits with which they putatively interact. The QTL for
Acinetobacter_OTU51 (RNA level) on chromosome 1 contains a potential immune-related interaction, as the
Cops5 gene (synonyms CSN5, Jab1) found in this inter-val was shown to influence T cell development [46], whereasAcinetobacteritself was demonstrated to protect against allergic sensitization and inflammation in the
skin by influencing the balance between TH1, TH2, and anti-inflammatory responses [47]. However, Cops5 may alternatively or in addition represent another potential cancer-related interaction, as it is also known to play a critical role in cell proliferation, apoptosis, and regula-tion of genomic stability and DNA repair [48]. Abnormal expression of Cops5 was demonstrated to impact car-cinogenesis in several cancer types including breast can-cer, laryngeal cancan-cer, and oral squamous cell carcinoma (SCC) [49–51]. Further, Ivan et al. [52] assessed Cops5
in various melanocytic lesions and found higher expres-sion levels ofCops5in metastatic melanomas, suggesting that Cops5 may influence the survival and growth of melanoma cells.
As mentioned above, the QTL for Deltaproteobacteria (DNA level) on chromosome 8 contains Cdh13(Fig. 5),
which is expressed in keratinocytes and involved in sus-ceptibility to SCC and malignant melanoma. Interest-ingly, the Deltaproteobacteria class includes sulfate-reducing bacteria that generate hydrogen sulfide (H2S),
which can have genotoxic properties [53] and is impli-cated in the pathogenesis of ulcerative colitis [54–56], a disease associated with increased colon cancer risk. On the other hand, H2S is also recognized as an endogenous
gasotransmitter and was demonstrated to play a func-tional role in human cutaneous microvasculature [57] and a protective role in systemic sclerosis-associated skin fibrosis [58]. Thus, further functional characterization of potential H2S-producing bacteria in
the skin and in the context of Cdh13 as a regulator of keratinocyte proliferation and skin architecture may be warranted.
Fig. 6Correlations among CMM phyla in the standing communities of populations G4and G15.aG4population.bG15population.
A final highly notable example is the QTL for Halomo-nas(RNA level) on chromosome 13, which contains the
Sox4 gene belonging to the SoxC class of transcription factors. Sox4 is known to inhibit apoptosis and increase proliferation and is thus highly linked to carcinogenesis [59]. Foronda et al. [60] further addressed the role of
Sox4(which is the only member of theSoxCclass that is expressed in the skin) in skin homeostasis and cancer by making a skin-specific deletion of Sox4 in combination with a chemically induced carcinogenesis model. The authors report reduced tumor progression and number inSox4-deficient mice compared to wild type, indicating an oncogenic activity of Sox4 in the skin. Interestingly, extracts from Halomonas meridiana bacteria isolated from brine pools of the Red Sea were demonstrated to have significant anticancer activity (apoptosis) in human cancer cell lines [61], raising the intriguing possibility that resident skin microbes play a role in endogenous anticancer activity from a hologenomic perspective.
Conclusions
The path from QTL mapping to gene/mutation identifi-cation and functional characterization is complex and challenging. Through the use of high-resolution map-ping and the introduction of phenotymap-ping based on mi-crobial activity, our study makes a substantial step towards understanding the host genetic component to interindividual variability in the skin microbiota and its potentially important fitness consequences. In particular, the preponderance of cancer-related candidate genes identified should motivate greater attention to the role of host-microbe interactions in cancer susceptibility and their potential as preventative and/or therapeutic targets. Finally, we suggest that adding activity-based community profiling may greatly enhance the capability to detect biologically meaningful host-microbe interactions in a wide variety of microbiome study settings.
Methods
Animals and skin sample collection
MRL/MpJ, NZM2410/J, BXD2/TyJ, and CAST/EiJ mice were purchased from the Jackson Laboratory (Maine, USA) and kept under conventional conditions. To gen-erate a heterogeneous intercross line, these individuals were intercrossed at an equal strain and sex distribution as described previously [23]. Male and female offspring used in the study were transferred to separate cages ac-cording to family. Animals were held under specific pathogen-free conditions at a 12-h light/dark cycle with food and water ad libitum. All 270 animals (98 males and 172 females) were housed in the University of Lübeck, Germany, and sampled from the 15th gener-ation of this advanced intercross line at a mean age of 5.9 months. All animal experiments were approved by
the “Ministerium für Energiewende, Landwirtschaft, Umwelt und ländliche Räume des Landes Schleswig-Holstein” in Kiel, Germany (reference number: V 312– 72241. 122–5 (12-2/09)).
An identical region from the left ear of each mouse was sampled, snap frozen, and stored at −80 °C until processing. During the dissection process, tools were carefully sterilized by flaming 70% ethanol. Total DNA and RNA were extracted simultaneously using the All-Prep DNA/RNA Qiagen kit. The working surface and pi-pettes were decontaminated with RNase AWAY® (Thermo Fisher Scientific). An additional 2-h room temperature incubation step was included after homogenization in order to increase the nucleic acids’ dissolution in the RLT buffer. RNA was treated with DNase (RNase-Free DNase Qiagen, stock solution con-centration) for 15 min, twice. cDNA synthesis was per-formed using High-Capacity cDNA Reverse Transcription Kits (Applied Biosystems). In addition, RNA purity was checked by a negative reverse tran-scriptase (without trantran-scriptase) PCR and agarose gel electrophoresis.
16S rRNA gene sequencing and processing
We amplified the V1–V2 regions of the bacterial 16S rRNA gene following a dual indexing approach for each sample. The primer pair (5′-
AATGATACGGCGAC-CACCGAGATCTACACXXXXXXXXTATGGTAATTGT
AGAGTTTGATCCTGGCTCAG-3′) and (5′
CAAGCA-GAAGACGGCATACGAGAT
XXXXXXXXAGTCAGT-CAGCC TGCTGCCTCCCGTAGGAGT-3′) contains the Illumina P5 (forward) and P7 (reverse), denoted by
negative as inclusion criteria. Further, negative extraction controls for each round of DNA/RNA extraction (n= 14, i.e., in total, 28 negative extraction controls, as DNA and RNA are split during the procedure) were included. For all samples, PCR product concentrations were first quantified on an agarose gel using image analysis soft-ware (Bio-Rad). After quantification, products were mixed together to make equimolar subpools. Subpools were then extracted from agarose gel with the Qiagen MinElute Gel Extraction Kit and quantified with the Quant-iT™dsDNA BR Assay Kit on a Qubit fluorometer (Invitrogen). Finally, subpools were combined in one equimolar pool for each library. Pools were further puri-fied using AMPure® Beads (Agencourt), and complete li-braries were run on an Agilent Bioanalyzer prior to sequencing, as recommended by Illumina. The Ampli-con libraries were sequenced on a MiSeq using the MiSeq Reagent Kit v3 600 cycles sequencing chemistry.
No mismatch to the barcode was allowed while de-multiplexing (CASAVA, Illumina). Raw forward and re-verse reads were merged in USEARCH (v.7) [62] as fol-lows: forward and reverse reads were truncated before alignment at the first base where the quality score dropped below Q= 2; the maximum number of mis-matches allowed in the overlap region was 2; the mini-mum length of the forward and reverse reads after truncating was 200 bp; the minimum length of the over-lap region was 150 bp; the minimum length of the merged read was 270 bp; the maximum length of the merged read was 330 bp. Merged reads were filtered by the parameter of expected error (E= 0.5), as recom-mended [63]. Finally, chimeric sequences were removed in UCHIME [64] using the SILVA Gold reference data-base [65].
Taxonomic classification and OTU binning
RDP Multi-Classifier (v.9.0) [66] implemented in Mothur (v.31) [67] was applied to assign taxonomy from the phylum to the genus level using a 0.80 confidence threshold and 1000 iterations. Sequences classified as Archaea, unknown, or Mitochondria were removed. Afterwards, sequences were aligned to the SILVA refer-ence database. Sequrefer-ences that failed to align were ex-cluded. To avoid spurious OTUs, aligned sequences were further de-noised using the pre-cluster algorithm executed in Mothur, as recommended by Schloss et al. [68]. Prior to OTU binning, samples were rarefied to an even sequence depth of 3500, except for one sample that had 3134 reads, in order to control for varied sequen-cing depth and biases in ecological community analysis. Operational taxonomic units were binned at a 97% simi-larity threshold using the Mothur average clustering algorithm.
SNP genotyping and founder haplotype reconstruction
Genomic DNA was isolated from liver tissue and incu-bated in 500μL of 50 mM NaOH at 95 °C for 2 h. The reaction was neutralized by the posterior addition of 50μL of 1 M Tris-HCl (pH 8.0). DNA was further proc-essed with DNeasy Blood & Tissue Kit (Qiagen) accord-ing to the manufacturer’s instructions. The extracted DNA was quantified using NanoDrop and normalized to 50 ng/μL in TE buffer (10 mM Tris, 1 mM EDTA; pH = 8). We used the high-density mouse universal genotyp-ing array, MegaMuga (Illumina), which can hybridize up to 77,800 SNPs, to genotype the mice as well as the four founder individuals. Raw genotyping data were first ana-lyzed using GenomeStudio Data Analysis Software (Illu-mina). Then, using PLINK (v.1.07) [69], SNPs missing in the founder individuals and SNPs with a minor allele frequency of 10% or below were removed. We obtained 53,203 informative SNP markers distributed genome-wide, with an average spacing of 0.04 Mb and standard deviation of 0.09 Mb. The four founder haplotype prob-abilities were calculated at each SNP marker for every sample by splitting the chromosomes using the“hdesign”
function from the“HAPPY”(v.2.4) R package [70].
Core Measurable Microbiota
To determine the set of microbial traits to be included in the QTL mapping, we defined a Core Measurable Microbiota (CMM) to include only bacterial taxa (genus to phylum level) with at least five reads in at least half of the samples, and species-level OTUs with at least five reads in at least one third of the samples. These thresh-olds were applied to the DNA- and RNA-based datasets separately, whereby in total 92 taxa (genus to phylum level) and 44 OTUs were included. We added a value of 0.5 to the absolute abundances of all CMMs, and then converted the absolute abundances into relative abun-dances. In order to reduce skewness, relative abundances were log10-transformed.
SourceTracker analysis
SourceTracker [26] analysis was performed on the level of mapped genera and species-level OTUs (97% similar-ity threshold) under default parameters. The training set included the negative extraction controls for which a weak PCR product was detectable and sufficient post quality filtering read number was achieved (16 out of 28 with >1000 reads, remaining samples containing 1 to 797 (mean 99) reads or no PCR product).
Summary statistics of the CMMs and partitioning of variance
CMM (taxa and OTUs). Multivariate analysis of variance was applied on the CMMs log10-transformed relative
abundances. We tested the effects of weight, gender, age, and cage environment on the variation in the CMM relative abundances in DNA- and RNA-based datasets; the three latter factors showed a significant overall effect (p≤0.05) and were thus included in the QTL mapping model. To measure the effects of these factors on vari-ation in CMM trait abundances across samples, we built a mixed effects model in the“lme4”(v.1.1-10) R package [72] for each CMM trait (taxa and OTUs) in the DNA-and RNA-based datasets, which included gender DNA-and age as fixed factors and cage as a random term. The variance components were measured using the “VarCorr” func-tion. Marginal R2, which represents the proportion of variance explained by fixed factors [73], was calculated using the “r.squaredGLMM” function in the “MuMIn” (v.1.15.1) R package [74].
QTL mapping
Linkage mapping was performed with a mixed model approach using the “QTLRel” (v. 0.2-14) R package [75] in DOQTL (v. 1.2.0) [76]. We fit an additive model that regresses the log10-transformed relative abundances of
each CMM trait (taxa and OTUs) on the four founder haplotype contributions. To adjust for different degrees of mice relatedness, a kinship matrix was defined by cal-culating correlation coefficients between samples using the “kinship.probs” function from the DOQTL package. The kinship matrix was incorporated into the model in-stead of pedigree records, as recommended by Svenson et al. [77] and Gatti et al. [76]. Gender and age (expressed in days) were incorporated as fixed covariates and cage as a random term in the mapping model. To determine significance thresholds for the LOD scores of each marker/trait, we applied a permutation procedure described by Churchill and Doerge [78]. This procedure consists of shuffling the phenotypes (i.e., the log10
rela-tive abundances) across the genotypes and re-runs the QTL model to generate new LOD scores. We repeated this process 5000 times for each marker/trait. After-wards, using the newly generated distribution of LOD scores, we determined the 90th and 95th percentiles and used them to define the suggestive (0.1) and significant thresholds, respectively. Finally, we compared the LOD scores generated in the original QTL scan to the defined significance thresholds: suggestive (genome-wide alpha≤ 0.1) and significant (genome-wide alpha≤0.05). Only the LOD scores that met or exceeded either the suggest-ive or significant thresholds were considered to indicate the presence of a putative QTL and reported in our re-sults. We set QTL confidence intervals at 1.5 LOD drops on either side of the peak position.
Quantitative and ecological analysis
Alpha diversity indices (i.e., Shannon entropy and Chao1) were calculated in the “vegan” (v.2.3.0) R pack-age [79] on the entire dataset at both the genus and OTU levels. For each alpha diversity measure, we calcu-lated summary statistics and partitioning of variance and performed QTL mapping only for Chao1, as described above. Comparison of mean relative abundances of major phyla and genera between the standing and active communities was performed using a paired Wilcoxon test. The correlation of relative abundances between the standing and active dataset was performed using Spear-man’s correlation. Correlations between the abundances of major phyla in the standing communities of genera-tions 4 and 15 were calculated using Spearman’s correl-ation in the “Hmisc” (v.3.17-0) R package [80]. pvalues were adjusted using the Benjamini and Hochberg method [27], and correlation coefficients were visualized using the“corrplot”(v.0.73) R package [81].
Real-time quantification of bacterial traits
16S rRNA gene primers targeting Betaproteobacteria, Epsilonproteobacteria, Streptococcus, and total bacteria were used to perform real-time quantification on a ran-dom subset of 80 out of the 270 mice. The taxon-specific primers include F_AACGCGAAAAACCT-TACCTACC and R_TGCCCTTTCGTAGCAACTAGTG for Betaproteobacteria, F_TAGGCTTGACATTGATA-GAATC and R_CTTACGAAGGCAGTCTCCTTA for Epsilonproteobaceria [82], F_CTWACCAGAAAGG-GACGGCT and R_AAGGRYCYAACACCTAGC for
Streptococcus [83], and F_ACTCCTACGGGAGGCAG-CAG and R_ATTACCGCGGCTGCTGG for total bac-teria [84]. Real-time quantitative PCR was carried out in a volume of 10μL on a PikoReal Real-Time PCR System using 96-well plates and three technical replicates for each sample. Each PCR mixture consisted of 5 μL of PowerUp SYBR PCR Master Mix (Applied Biosystems), 0.5μL of each primer (10μM), 2.5μL of water, and 2μL of the original cDNA template used for 16S rRNA gene sequencing (1:20 dilution). The amplification program consisted of (i) initial step at 95 °C for 10 min, (ii) 45 cy-cles of denaturation at 95 °C for 15 s and annealing/ex-tension at 60 °C for 1 min, and (iii) 1 cycle at 60 °C for 30 s and a melt ramp from 60 to 95 °C. The relative quantification of a given bacterial trait was determined by comparing taxon-specific and total bacteriaCTvalues
as expressed 2−ðdelta‐deltaCTvaluesÞ.
Pathway and gene ontology enrichment analysis
per interval) and performed the analyses based on two categories including pathways (Biocarta) and ontologies (Biological Processes). We used the tool Enrichr [85] and sorted the results based on the combined score from the enrichment analysis.
Additional files
Additional file 1: Figure S1.Principal coordinate analysis of beta diversity indices of skin microbiota in populations G15and G4. (A)
Bray-Curtis, (B) Jaccard indices. Indices are calculated on genera abundances after normalization of sequencing depth to 2500 reads per sample in both populations G15and G4. DNA: standing, RNA: active. Goodness of fit:
Bray-Curtis,r2= 0.38,p= 1.10−5; Jaccard,r2= 0.47,p= 1.10−5, based on
1000 permutations. SD: standard deviation. (TIF 392 kb)
Additional file 2: Table S1.Summary statistics of CMM taxa and alpha diversity indices as profiled based on DNA. Means, standard deviations (STD), minimum (Min), maximum (Max), and coefficient of variation (CV) values of relative abundances in population G15(n= 270). When taxa are
redundant, only the lowest rank is shown. Un: unclassified. (XLSX 15 kb)
Additional file 3: Table S2.Summary statistics of CMM taxa and alpha diversity indices as profiled based on RNA. Means, standard deviations (STD), minimum (Min), maximum (Max), and coefficient of variation (CV) values relative abundances in population G15(n= 270). When taxa are
redundant, only the lowest rank is shown. Un: unclassified. (XLSX 15 kb)
Additional file 4: Table S3.Summary statistics of CMM OTUs and alpha diversity indices as profiled based on DNA. Means, standard deviations (STD), minimum (Min), maximum (Max), and coefficient of variation (CV) values of relative abundances in population G15(n= 270).
Un: unclassified. (XLSX 12 kb)
Additional file 5: Table S4.Summary statistics of CMM OTUs and alpha diversity indices as profiled based on RNA. Means, standard deviations (STD), minimum (Min), maximum (Max), and coefficient of variation (CV) values of relative abundances in population G15(n= 270).
Un: unclassified. (XLSX 12 kb)
Additional file 6: Table S5.Estimates of proportions of explained variance by explanatory variables for genus- to phylum-level taxa (DNA). Estimates for random components (cage and residual) and fixed terms (gender and age) are calculated for each of the CMM taxa log10-relative
abundances and alpha diversity indices as profiled based on DNA in population G15(n= 270). When taxa are redundant, only the lowest rank
is shown. Un: unclassified. (XLSX 14 kb)
Additional file 7: Table S6.Estimates of proportions of explained variance by explanatory variables for genus- to phylum-level taxa (RNA). Estimates for random components (cage and residual) and fixed terms (gender and age) are calculated for each of the CMM taxa log10-relative
abundances and alpha diversity indices as profiled based on RNA in G15
(n= 270). When taxa are redundant, only the lowest rank is shown. Un: unclassified. (XLSX 14 kb)
Additional file 8: Table S7.Estimates of proportions of explained variance by explanatory variables for OTUs (DNA). Estimates for random components (cage and residual) and fixed terms (gender and age) are calculated for each of the CMM OTUs log10-relative abundances and alpha
diversity indices as profiled based on DNA in G15(n= 270). When taxa are
redundant, only the lowest rank is shown. Un: unclassified. (XLSX 13 kb)
Additional file 9: Table S8.Estimates of proportions of explained variance by explanatory variables for OTUs (RNA). Estimates of proportions of explained variance by random components (cage and residual) and fixed terms (gender and age) are calculated for each of the CMM OTUs log10-relative abundances and alpha diversity indices as
profiled based on RNA in G15(n= 270). When taxa are redundant, only
the lowest rank is shown. Un: unclassified. (XLSX 13 kb)
Additional file 10: Table S9.Residuals of the linear mixed models for all mapped taxa and alpha diversity measures. Un: unclassified. (XLSX 1069 kb)
Additional file 11: Figure S2.Manhattan plot ofNeisseria_OTU1320
QTL mapping. Significant thresholds (p≤0.05) are shown in a continuous line; suggestive thresholds (p≤0.10) are shown in a discontinuous line. Chr: chromosome. (TIF 219 kb)
Additional file 12: Table S10.Functions of the potential candidate genes. Un: unclassified. (XLSX 15 kb)
Additional file 13: Figure S3.Pathway and biological process enrichment analysis of candidate regions. A. Pathways analysis (Biocarta). B. Biological processes. Significant enrichment results after correction for multiple testing (p≤0.1) are displayed in color; non-significant enriched terms are colorless. For the biological process analysis, only combined scores higher than 2.5 are reported. (TIF 581 kb)
Additional file 14: Table S11.Full details of pathway and biological process enrichment analyses for candidate regions. (XLSX 71 kb)
Additional file 15: Figure S4.Manhattan plot for unclassified Betaproteobacteria QTL. Significant thresholds (p≤0.05) are shown in a continuous line; suggestive thresholds (p≤0.1) are shown in a discontinuous line. Chr: chromosome, Un: unclassified. (TIF 572 kb)
Abbreviation
OTU:Operational taxonomic unit
Acknowledgements
We thank Susen Mueller and Artem Vorobyev for assisting with mouse work; Katja Cloppenborg-Schmidt for excellent technical assistance; Britt Marie Her-mes, Jun Wang, Philipp Rausch, and Marie Vallier for helpful discussion; and the International Max Planck Research School (IMPRS) for Evolutionary Biology.
Funding
This work was supported by the German Science Foundation (DFG) grants RTG 1743“Genes, Environment and Inflammation,”Excellence Cluster 306
“Inflammation at Interfaces,”and Clinical Research Unit 303“Pemphigoid Dieseases–Molecular Pathways and their Therapeutic Potential.”
Availability of data and materials
Bacterial 16S rRNA gene sequences are deposited at the European Nucleotide Archive, PRJEB15403.
Authors’contributions
SI and JB designed the study, SK performed the Miseq sequencing, YG designed the pipeline for QTL mapping, MB performed the analyses, and MB and JB wrote the manuscript. All authors read and approved the final manuscript.
Competing interests
The authors declare that they have no competing interests.
Consent for publication Not applicable
Ethics approval and consent to participate
All animal experiments were approved by the“Ministerium für Energiewende, Landwirtschaft, Umwelt und ländliche Räume des Landes Schleswig-Holstein”in Kiel, Germany (reference number: V 312–72241. 122–5 (12-2/09)).
Publisher’s Note
Springer Nature remains neutral with regard to jurisdictional claims in published maps and institutional affiliations.
Author details
1Max Planck Institute for Evolutionary Biology, August-Thienemann-Str. 2,
Received: 3 October 2016 Accepted: 15 May 2017
References
1. Human Microbiome Project Consortium. Structure, function and diversity of the healthy human microbiome. Nature. 2012;486(7402):207–14.
2. Ley RE, Turnbaugh PJ, Klein S, Gordon JI. Microbial ecology: human gut microbes associated with obesity. Nature. 2006;444(7122):1022–3. 3. McKnite AM, Perez-Munoz ME, Lu L, Williams EG, Brewer S, Andreux PA,
Bastiaansen JW, Wang X, Kachman SD, Auwerx J, Williams RW, Benson AK, Peterson DA, Ciobanu DC. Murine gut microbiota is defined by host genetics and modulates variation of metabolic traits. PLoS One. 2012;7(6):e39191. 4. Stappenbeck TS, Hooper LV, Gordon JI. Developmental regulation of
intestinal angiogenesis by indigenous microbes via Paneth cells. Proc Natl Acad Sci U S A. 2002;99(24):15451–5.
5. Linnenbrink M, Wang J, Hardouin EA, Künzel S, Metzler D, Baines JF. The role of biogeography in shaping diversity of the intestinal microbiota in house mice. Mol Ecol. 2013;22(7):1904–16.
6. Song SJ, Lauber C, Costello EK, Lozupone CA, Humphrey G, Berg-Lyons D, Caporaso JG, Knights D, Clemente JC, Nakielny S, Gordon JI, Fierer N, Knight R. Cohabiting family members share microbiota with one another and with their dogs. Elife. 2013;2:e00458.
7. Org E, Parks BW, Joo JW, Emert B, Schwartzman W, Kang EY, Mehrabian M, Pan C, Knight Gunsalus R, Drake TA, Eskin E, Lusis AJ. Genetic and environmental control of host-gut microbiota interactions. Genome Res. 2015;25(10):1558–69.
8. Xu Z, Knight R. Dietary effects on human gut microbiome diversity. Br J Nutr. 2015;113 Suppl 0:S1–5.
9. Goodrich JK, Waters JL, Poole AC, Sutter JL, Koren O, Blekhman R, Beaumont M, Van Treuren W, Knight R, Bell JT, Spector TD, Clark AG, Ley RE. Human genetics shape the gut microbiome. Cell. 2014;159(4):789–99.
10. Goodrich JK, Davenport ER, Beaumont M, Jackson MA, Knight R, Ober C, Spector TD, Bell JT, Clark AG, Ley RE. Genetic determinants of the gut microbiome in UK twins. Cell Host Microbe. 2016;19(5):731–43.
11. Kovacs A, Ben-Jacob N, Tayem H, Halperin E, Iraqi FA, Gophna U. Genotype is a stronger determinant than sex of the mouse gut microbiota. Microb Ecol. 2011;61(2):423–8.
12. Campbell JH, Foster CM, Vishnivetskaya T, Campbell AG, Yang ZK, Wymore A, Palumbo AV, Chesler EJ, Podar M. Host genetic and environmental effects on mouse intestinal microbiota. ISME J. 2012;6(11):2033–44.
13. Benson AK, Kelly SA, Legge R, Ma F, Low SJ, Kim J, Zhang M, Oh PL, Nehrenberg D, Hua K, Kachman SD, Moriyama EN, Walter J, Peterson DA, Pomp D. Individuality in gut microbiota composition is a complex polygenic trait shaped by multiple environmental and host genetic factors. Proc Natl Acad Sci U S A. 2010;107(44):18933–8.
14. Wang J, Kalyan S, Steck N, Turner LM, Harr B, Künzel S, Vallier M, Häsler R, Franke A, Oberg HH, Ibrahim SM, Grassl GA, Kabelitz D, Baines JF. Analysis of intestinal microbiota in hybrid house mice reveals evolutionary divergence in a vertebrate hologenome. Nat Commun. 2015;6:6440.
15. Davenport ER, Cusanovich DA, Michelini K, Barreiro LB, Ober C, Gilad Y. Genome-wide association studies of the human gut microbiota. PLoS One. 2015;10(11):e0140301.
16. Blekhman R, Goodrich JK, Huang K, Sun Q, Bukowski R, Bell JT, Spector TD, Keinan A, Ley RE, Gevers D, Clark AG. Host genetic variation impacts microbiome composition across human body sites. Genome Biol. 2015;16:191. 17. Bonder MJ, Kurilshikov A, Tigchelaar E, Mujagic Z, Imhann F, Vila AV, Deelen P, Vatanen T, Schirmer M, Smeekens SP, Zhernakova DV, Jankipersadsing SA, Jaeger M, Oosting M, Cenit MC, Masclee AA, Swertz MA, Li Y, Kumar V, Joosten L, Harmsen H, Weersma RK, Franke L, Hofker MH, Xavier RJ, Jonkers D, Netea MG, Wijmenga C, Fu J, Zhernakova A. The effect of host genetics on the gut microbiome. Nat Genet. 2016;48(11):1407–12.
18. Turpin W, Espin-Garcia O, Xu W, Silverberg MS, Kevans D, Smith MI, Guttman DS, Griffiths A, Panaccione R, Otley A, Xu L, Shestopaloff K, Moreno-Hagelsieb G, GEM Project Research Consortium, Paterson AD, Croitoru K. Association of host genome with intestinal microbial composition in a large healthy cohort. Nat Genet. 2016;48(11):1413–7. 19. Wang J, Thingholm LB, SkiecevičienėJ, Rausch P, Kummen M, Hov JR,
Degenhardt F, Heinsen FA, Rühlemann MC, Szymczak S, Holm K, Esko T, Sun J, Pricop-Jeckstadt M, Al-Dury S, Bohov P, Bethune J, Sommer F, Ellinghaus D, Berge RK, Hübenthal M, Koch M, Schwarz K, Rimbach G, Hübbe P, Pan WH, Sheibani-Tezerji R, Häsler R, Rosenstiel P, D’Amato M,
Cloppenborg-Schmidt K, Künzel S, Laudes M, Marschall HU, Lieb W, Nöthlings U, Karlsen TH, Baines JF, Franke A. Genome-wide association analysis identifies variation in vitamin D receptor and other host factors influencing the gut microbiota. Nat Genet. 2016;48(11):1396–406.
20. Grice EA, Kong HH, Renaud G, Young AC, NISC Comparative Sequencing Program, Bouffard GG, Blakesley RW, Wolfsberg TG, Turner ML, Segre JA. A diversity profile of the human skin microbiota. Genome Res. 2008;18(7): 1043–50.
21. Grice EA, Kong HH, Conlan S, Deming CB, Davis J, Young AC, NISC Comparative Sequencing Program, Bouffard GG, Blakesley RW, Murray PR, Green ED, Turner ML, Segre JA. Topographical and temporal diversity of the human skin microbiome. Science. 2009;324(5931):1190–2.
22. Costello EK, Lauber CL, Hamady M, Fierer N, Gordon JI, Knight R. Bacterial community variation in human body habitats across space and time. Science. 2009;326(5960):1694–7.
23. Srinivas G, Möller S, Wang J, Künzel S, Zillikens D, Baines JF, Ibrahim SM. Genome-wide mapping of gene–microbiota interactions in susceptibility to autoimmune skin blistering. Nat Commun. 2013;4:2462.
24. Kong HH, Andersson B, Clavel T, Common JE, Jackson SA, Olson ND, Segre JA, Traidl-Hoffmann C. Performing skin microbiome research: a method to the madness. J Invest Dermatol. 2017;137:561–8.
25. Salter SJ, Cox MJ, Turek EM, Calus ST, Cookson WO, Moffatt MF, Turner P, Parkhill J, Loman NJ, Walker AW. Reagent and laboratory contamination can critically impact sequence-based microbiome analyses. BMC Biol. 2014;12:87. 26. Knights D, Kuczynski J, Charlson ES, Zaneveld J, Mozer MC, Collman RG,
Bushman FD, Knight R, Kelley ST. Bayesian community-wide culture-independent microbial source tracking. Nat Methods. 2011;8(9):761–3. 27. Benjamini Y, Hochberg Y. Controlling the false discovery rate: a practical and
powerful approach to multiple testing. J R Stat Soc B Methodol. 1995;57:289–300. 28. Si J, Lee S, Park JM, Sung J, Ko G. Genetic associations and shared
environmental effects on the skin microbiome of Korean twins. BMC Genomics. 2015;16:992.
29. Fuziwara S, Inoue K, Denda M. NMDA-type glutamate receptor is associated with cutaneous barrier homeostasis. J Invest Dermatol. 2003;120(6):1023–9. 30. Hoogduijn MJ, Hitchcock IS, Smit NP, Gillbro JM, Schallreuter KU, Genever
PG. Glutamate receptors on human melanocytes regulate the expression of MiTF. Pigment Cell Res. 2006;19:58–67.
31. Cals-Grierson MM, Ormerod AD. Nitric oxide function in the skin. Nitric Oxide. 2004;10(4):179–93.
32. Chang HR, Tsao DA, Wang SR, Yu HS. Expression of nitric oxide synthases in keratinocytes after UVB irradiation. Arch Dermatol Res. 2003;295(7):293–6. 33. Ramirez CP, Fiedler D. Investigating the role of inorganic phosphate in
tumor metabolism and metastasis. Cancer Metab. 2014;2 Suppl 1:55. 34. Camalier CE, Young MR, Bobe G, Perella CM, Colburn NH, Beck Jr GR.
Elevated phosphate activates N-ras and promotes cell transformation and skin tumorigenesis. Cancer Prev Res (Phila). 2010;3(3):359–70.
35. Zhou S, Matsuyoshi N, Liang SB, Takeuchi T, Ohtsuki Y, Miyachi Y. Expression of T-cadherin in basal keratinocytes of skin. J Invest Dermatol. 2002;118(6):1080–4. 36. Mukoyama Y, Zhou S, Miyachi Y, Matsuyoshi N. T-cadherin negatively
regulates the proliferation of cutaneous squamous carcinoma cells. J Invest Dermatol. 2005;124(4):833–8.
37. Kuphal S, Martyn AC, Pedley J, Crowther LM, Bonazzi VF, Parsons PG, Bosserhoff AK, Hayward NK, Boyle GM. H-cadherin expression reduces invasion of malignant melanoma. Pigment Cell Melanoma Res. 2009;22(3):296–306. 38. Li L, Jiang M, Feng Q, Kiviat NB, Stern JE, Hawes S, Cherne S, Lu H. Aberrant
methylation changes detected in cutaneous squamous cell carcinoma of immunocompetent individuals. Cell Biochem Biophys. 2015;72(2):599–604. 39. Kamsteeg M, Bergers M, de Boer R, Zeeuwen PL, Hato SV, Schalkwijk J,
Tjabringa GS. Type 2 helper T-cell cytokines induce morphologic and molecular characteristics of atopic dermatitis in human skin equivalent. Am J Pathol. 2011;178(5):2091–9.
40. Greene CS, Penrod NM, Williams SM, Moore JH. Failure to replicate a genetic association may provide important clues about genetic architecture. PLoS One. 2009;4(6):e5639.
41. Leamy LJ, Kelly SA, Nietfeldt J, Legge RM, Ma F, Hua K, Sinha R, Peterson DA, Walter J, Benson AK, Pomp D. Host genetics and diet, but not immunoglobulin A expression, converge to shape compositional features of the gut microbiome in an advanced intercross population of mice. Genome Biol. 2014;15(12):552.
G, Mattner J, Nagel S, Pabst O, Schmidt F, Siegmund B, Strowig T, Volynets V, Wirtz S, Zeissig S, Zeissig Y, Bleich A, Baines JF. Analysis of factors contributing to variation in the C57BL/6J fecal microbiota across German animal facilities. Int J Med Microbiol. 2016;306(5):343–55.
43. Gao Z, Tseng CH, Strober BE, Pei Z, Blaser MJ. Substantial alterations of the cutaneous bacterial biota in psoriatic lesions. PLoS One. 2008;3(7):e2719. 44. Kong HH, Oh J, Deming C, Conlan S, Grice EA, Beatson MA, Nomicos E,
Polley EC, Komarow HD, NISC Comparative Sequence Program, Murray PR, Turner ML, Segre JA. Temporal shifts in the skin microbiome associated with disease flares and treatment in children with atopic dermatitis. Genome Res. 2012;22(5):850–9.
45. Campbell BJ, Yu L, Heidelberg JF, Kirchman DL. Activity of abundant and rare bacteria in a coastal ocean. Proc Natl Acad Sci U S A. 2011;108(31): 12776–81.
46. Panattoni M, Sanvito F, Basso V, Doglioni C, Casorati G, Montini E, Bender JR, Mondino A, Pardi R. Targeted inactivation of the COP9 signalosome impairs multiple stages of T cell development. J Exp Med. 2008;205(2):465–77. 47. Fyhrquist N, Ruokolainen L, Suomalainen A, Lehtimäki S, Veckman V,
Vendelin J, Karisola P, Lehto M, Savinko T, Jarva H, Kosunen TU, Corander J, Auvinen P, Paulin L, von Hertzen L, Laatikainen T, Mäkelä M, Haahtela T, Greco D, Hanski I, Alenius H. Acinetobacter species in the skin microbiota protect against allergic sensitization and inflammation. J Allergy Clin Immunol. 2014;134(6):1301-1309.e11.
48. Pan Y, Yang H, Claret FX. Emerging roles of Jab1/CSN5 in DNA damage response, DNA repair, and cancer. Cancer Biol Ther. 2014;15(3):256–62. 49. Kouvaraki MA, Rassidakis GZ, Tian L, Kumar R, Kittas C, Claret FX. Jun activation
domain-binding protein 1 expression in breast cancer inversely correlates with the cell cycle inhibitor p27(Kip1). Cancer Res. 2003;63(11):2977–81.
50. Dong Y, Sui L, Watanabe Y, Yamaguchi F, Hatano N, Tokuda M. Prognostic significance of Jab1 expression in laryngeal squamous cell carcinomas. Clin Cancer Res. 2005;11(1):259–66.
51. Harada K, Kawashima Y, Yoshida H, Sato M. High expression of Jun activation domain-binding protein 1 (Jab1) is a strong prognostic marker in oral squamous cell carcinoma patients treated by UFT in combination with radiation. Anticancer Res. 2006;26(2B):1615–9.
52. Ivan D, Diwan AH, Esteva FJ, Prieto VG. Expression of cell cycle inhibitor p27Kip1
and its inactivator Jab1 in melanocytic lesions. Mod Pathol. 2004;17:811–8. 53. Attene-Ramos MS, Wagner ED, Plewa MJ, Gaskins HR. Evidence that
hydrogen sulfide is a genotoxic agent. Mol Cancer Res. 2006;4:9–14. 54. Gibson GR, Cummings JH, Macfarlane GT. Growth and activities of
sulphate-reducing bacteria in gut contents of healthy subjects and patients with ulcerative colitis. FEMS Microbiol Lett. 1991;86:103–11.
55. Pitcher MCL, Beatty ER, Gibson GR, Cummings JH. Incidence and activities of sulphate-reducing bacteria in patients with ulcerative colitis. Gut. 1995;36:A63. 56. Christl SU, Eisner HD, Dusel G, Kasper H, Scheppach W. Antagonistic effects of
sulfide and butyrate on proliferation of colonic mucosa: a potential role for these agents in the pathogenesis of ulcerative colitis. Dig Dis Sci. 1996;41:2477–81. 57. Kutz JL, Greaney JL, Santhanam L, Alexander LM. Evidence for a functional
vasodilatatory role for hydrogen sulphide in the human cutaneous microvasculature. J Physiol. 2015;593(9):2121–9.
58. Wang Z, Yin X, Gao L, Feng S, Song K, Li L, Lu Y, Shen H. The protective effect of hydrogen sulfide on systemic sclerosis associated skin and lung fibrosis in mice model. Springerplus. 2016;5(1):1084.
59. Vervoort SJ, van Boxtel R, Coffer PJ. The role of SRY-related HMG box transcription factor 4 (SOX4) in tumorigenesis and metastasis: friend or foe? Oncogene. 2013;32(29):3397–409.
60. Foronda M, Martínez P, Schoeftner S, Gómez-López G, Schneider R, Flores JM, Pisano DG, Blasco MA. Sox4 links tumor suppression to accelerated aging in mice by modulating stem cell activation. Cell Rep. 2014;8(2):487–500. 61. Sagar S, Esau L, Holtermann K, Hikmawan T, Zhang G, Stingl U, Bajic VB,
Kaur M. Induction of apoptosis in cancer cell lines by the Red Sea brine pool bacterial extracts. BMC Complement Altern Med. 2013;13:344. 62. Edgar RC. Search and clustering orders of magnitude faster than BLAST.
Bioinformatics. 2010;26(19):2460–1.
63. Edgar RC, Flyvbjerg H. Error filtering, pair assembly, and error correction for next generation sequencing reads. Bioinformatics. 2015;31(21):3476–82. 64. Edgar RC, Haas BJ, Clemente JC, Quince C, Knight R. UCHIME improves sensitivity and speed of chimera detection. Bioinformatics. 2011;27(16): 2194–200.
65. Pruesse E, Quast C, Knittel K, Fuchs BM, Ludwig WG, Peplies J, Glöckner FO. SILVA: a comprehensive online resource for quality checked and aligned
ribosomal RNA sequence data compatible with ARB. Nucleic Acids Res. 2007;35:7188–96.
66. Wang Q, Garrity GM, Tiedje JM, Cole JR. Naive Bayesian classifier for rapid assignment of rRNA sequences into the new bacterial taxonomy. Appl Environ Microbiol. 2007;73(16):5261–7.
67. Schloss PD, Westcott SL, Ryabin T, Hall JR, Hartmann M, Hollister EB, Lesniewski RA, Oakley BB, Parks DH, Robinson CJ, Sahl JW, Stres B, Thallinger GG, Van Horn DJ, Weber CF. Introducing mothur: open-source, platform-independent, community-supported software for describing and comparing microbial communities. Appl Environ Microbiol. 2009;75(23):7537–41. 68. Schloss PD, Gevers D, Westcott SL. Reducing the effects of PCR
amplification and sequencing artifacts on 16S rRNA-based studies. PLoS One. 2011;6(12):e27310.
69. Purcell S, Neale B, Todd-Brown K, Thomas L, Ferreira MAR, Bender D, Maller J, Sklar P, de Bakker PIW, Daly MJ, Sham PC. PLINK: a tool set for whole-genome association and population-based linkage analyses. Am J Hum Genet. 2007;81(3):559–75.
70. Mott R, Flint J. Simultaneous detection and fine-mapping of quantitative trait loci in mice using heterogenous stocks. Genetics. 2002;160:1609–18. 71. R Core Team. R: a language and environment for statistical computing. Vienna:
R Foundation for Statistical Computing; 2014. http://www.R-project.org/. 72. Bates D, Maechler M, Bolker B, Walker S. Fitting linear mixed-effects models
using lme4. J Stat Softw. 2015;67(1):1–48.
73. Nakagawa S, Schielzeth H. A general and simple method for obtaining R2from generalized linear mixed-effects models. Methods Ecol Evol. 2012;4(2):133–42. 74. Barton K. MuMIn: multi-model inference, R package. 2015.
75. Cheng R, Abney M, Palmer AA, Skol AD. QTLRel: an R package for genome-wide association studies in which relatedness is a concern. BMC Genet. 2011;12:66.
76. Gatti DM, Svenson KL, Shabalin A, Wu L-Y, Valdar W, Simecek P, Goodwin N, Cheng R, Pomp D, Palmer A, Chesler EJ, Broman KW, Churchill GA. Quantitative trait locus mapping methods for diversity outbred mice. G3. 2014;4:1623–33.
77. Svenson KL, Gatti DM, Valdar W, Welsh CE, Cheng R, Chesler EJ, Palmer AA, McMillan L, Churchill GA. High-resolution genetic mapping using the mouse diversity outbred population. Genetics. 2012;190:437–47.
78. Churchill GA, Doerge RW. Empirical threshold values for quantitative trait mapping. Genetics. 1994;138(3):963–71.
79. Oksanen J, Blanchet FG, Kindt R, Legendre P, Minchin PR O’Hara RB, Simpson GL, Solymos P, Stevens MHH, Wagner H. Vegan: Community Ecology Package. 2015.
80. Harrell Jr FE. With contributions from Charles Dupont and many others. Hmisc: Harrell miscellaneous, R package. 2015.
81. Wei T. Corrplot: visualization of a correlation matrix, R package. 2013. 82. Yang YW, Chen MK, Yang BY, Huang XJ, Zhang XR, He LQ, Zhang J, Hua ZC.
Use of 16S rRNA gene-targeted group-specific primers for real-time PCR analysis of predominant bacteria in mouse feces. Appl Environ Microbiol. 2015;81(19):6749–56.
83. Hermann-Bank ML, Skovgaard K, Stockmarr A, Larsen N, Mølbak L. The gut microbiotassay: a high-throughput qPCR approach combinable with next generation sequencing to study gut microbial diversity. BMC Genomics. 2013;14:788.
84. Guo X, Xia X, Tang R, Wang K. Real-time PCR quantification of the predominant bacterial divisions in the distal gut of Meishan and Landrace pigs. Anaerobe. 2008;14(4):224–8.