Open Access
Research
Utilizing FEM-Software to quantify pre- and post-interventional
cardiac reconstruction data based on modelling data sets from
surgical ventricular repair therapy (SVRT) and cardiac
resynchronisation therapy (CRT)
Janko F Verhey*
1,2and Nadia S Nathan
3Address: 1MVIP ImagingProducts GmbH, Nörten-Hardenberg, Germany, 2Department of Medical Informatics, University Hospital Göttingen,
Göttingen, Germany and 3Department of Anesthesiology, Ohio State University, Columbus, Ohio, USA
Email: Janko F Verhey* - [email protected]; Nadia S Nathan - [email protected] * Corresponding author
Abstract
Background: Left ventricle (LV) 3D structural data can be easily obtained using standard transesophageal echocardiography (TEE) devices but quantitative pre- and intraoperative volumetry and geometry analysis of the LV is presently not feasible in the cardiac operation room (OR). Finite element method (FEM) modelling is necessary to carry out precise and individual volume analysis and in the future will form the basis for simulation of cardiac interventions.
Method: A Philips/HP Sonos 5500 ultrasound device stores volume data as time-resolved 4D volume data sets. In this prospective study TomTec LV Analysis TEE© Software was used for
semi-automatic endocardial border detection, reconstruction, and volume-rendering of the clinical 3D echocardiographic data. With the software FemCoGen© a quantification of partial volumes and
surface directions of the LV was carried out for two patients data sets. One patient underwent surgical ventricular repair therapy (SVR) and the other a cardiac resynchronisation therapy (CRT).
Results: For both patients a detailed volume and surface direction analysis is provided. Partial volumes as well as normal directions to the LV surface are pre- and post-interventionally compared.
Conclusion: The operation results for both patients are quantified. The quantification shows treatment details for both interventions (e.g. the elimination of the discontinuities for CRT intervention and the segments treated for SVR intervention). The LV quantification is feasible in the cardiac OR and it gives a detailed and immediate quantitative feedback of the quality of the intervention to the medical.
Background
The finite element method (FEM) is a powerful numerical method. It has become the prevalent technique used as an effective tool for analyzing all kinds of physical
phenom-ena in structural, solid and fluid mechanics. Moreover it is used for simulating various processes in engineering in the last four decades. The FEM has been frequently used in the field of cardiovascular mechanics (e.g.: [1,2]). A very
Published: 31 October 2006
BioMedical Engineering OnLine 2006, 5:58 doi:10.1186/1475-925X-5-58
Received: 06 September 2006 Accepted: 31 October 2006
This article is available from: http://www.biomedical-engineering-online.com/content/5/1/58 © 2006 Verhey and Nathan; licensee BioMed Central Ltd.
BioMedical Engineering OnLine 2006, 5:58 http://www.biomedical-engineering-online.com/content/5/1/58
comprehensive bibliography to the theme of finite ele-ment modelling and simulations in cardiovascular mechanics is given by J. Mackerle [3]. Because the heart muscle is a mixture of different kinds of fibre, coronary vessels, blood and interstitial fluids, the complicated sys-tem is not easy to be simulated with numerical methods.
But the present paper is not dealing with the simulation of the heart or part of this. This paper uses the step before the analysis of the clinical data. Generally, in order to simu-late cardiac mechanics, FEM models are defined. The hypothesis studied in this article is that these models can be efficiently used to carry out detailed volumetric and geometric analysis.
Cardiac FEM models can be generated either from MRI data (e.g.: [4-6]) or from echocardiographic data (e.g.: [1,7]). Intraoperative TEE is currently available in most cardiac surgical operating rooms. In some centers, intra-operative 3D echocardiography is used to evaluate geom-etry and to plan surgical interventions prior to LV remodeling surgery. However, quantitation of LV geome-try is limited to rather imprecise measures such as ejection fraction [8]. Thus, the cardiac surgeon has no sophisti-cated, immediate, quantitative analysis of the pre- and post-interventional 3D LV geometry. Intraoperative quan-titative analysis of the dynamic behavior of the LV might provide optimal information upon which to base precise patient-specific planning of the surgical intervention, as well as to assess the adequacy of the completed surgical repair. Because the LV cannot be realistically described by a symmetric mathematical model, the modern approach consists of using a FEM mesh which approximates LV geometry [9] or whole heart geometry [10].
Up to now few quantitative analysis studies were carried out with data from echocardiographic devices [11]. The present paper actually shows the possibility for immediate quantitative analysis of 4D structural pre- and post-inter-ventional models based on time-resolved 3D echocardio-graphic data of two clinical cases. One patient underwent a surgical ventricular repair therapy (SVR) and the other a cardiac resynchronisation therapy (CRT).
Surgical ventricular repair therapy
Surgical ventricular repair or restoration therapy (SVR) is a surgical procedure to treat congestive heart failure caused by myocardial infarction (heart attack) [12]. Fol-lowing a heart attack, scar or an aneurysm may develop resulting in an enlarged rounded heart. This may lead to congestive heart failure (CHF). The goal of the SVR is to restore the heart to a more normal size and shape, there-fore improving function.
Cardiac resynchronisation therapy
Patients with LV systolic dysfunction and dilatation fre-quently have ventricular conduction delays. This is usu-ally manifested in the cardiac sinus rhythm as a left bundle branch block, but it often occurs in patients with narrow QRS complex (time it takes for depolarization of the ventricles) also. This type of conduction abnormality is generally associated with delayed depolarisation and contraction of the lateral LV free wall (ventricular dyssyn-chrony). Ventricular dyssynchrony might contribute to disease progression.
CRT can resynchronise the ventricular activation pattern by acting as an electrical bypass, thus restoring a more coordinated ventricular contraction, by two main mecha-nisms: pre-exciting the LV lateral wall with atrial-synchro-nous left or biventricular pacing and shortening or optimising the atrio-ventricular interval. Pre-excitation of the LV lateral wall allows a more coordinated ventricular contraction and decreases in mitral regurgitation by early activation of the papillary muscle. The optimisation of the mitral valve interval abolishes pre-systolic mitral regurgi-tation and prolongs the diastolic filling time. Relative optimisation of ventricular loading conditions, as pro-vided by CRT, improves myocardial efficiency at no increased oxygen cost and increases the systolic function with little effect on the diastolic function. In addition to the positive hemodynamic effects mentioned above, CRT reduces sympathetic activity [13,14].
Materials and methods
For this retrospective study data sets of two patients were used. The data sets were acquired as a matter of routine during the intervention. In the first case (named herein PatSVR) the SVR procedure was performed after an heart attack in conjunction with coronary artery bypass grafting to ensure optimal blood supply to the heart. In the second case (named herein PatCRT) the patient had LV systolic dysfunction. PatCRT underwent the CRT procedure to resynchronise the contraction of the LV.
For LV geometry reconstruction, the TomTec LV-Analysis TEE© software module [15] was employed. This software
runs on a standard Dell Inspirion laptop computer with Microsoft Windows™ XP Professional operating system which imports, analyzes, reports and archives the time-resolved 3D-ultrasound data. All images were previously anonymized. The TomTec system automatically detects endocardial borders and produces a 3D shell reconstruc-tion of the LV in which a landmark-setting method is used [7]. With this landmarking procedure, a time-resolved LV geometric analysis with 20 models per heart cycle was obtained for PatCRT. For PatSVR the data sets consist of 24 time steps for the pre-interventional data set and 18 time steps for the post-interventional data set.
The rendered LV geometry resulting from the TomTec analysis tool was transferred with FemCoGen 3.0 [16] to an ABAQUS ODB file. In FemCoGen 3.0, the TomTec file structure was reformatted to an ABAQUS system (version 6.5.1) input file based on standard ABAQUS FEM ele-ments. The ABAQUS ODB file was created for visualisa-tion. Furthermore, the LV models were registered according to the positions of the apex, the center of the mitral valve and the position of the aortic valve (Figure 1). The registration process is illustrated in Figure 2. Thus, as a result even the models from two different acquisitions can be overlayed and compared in the same coordinate system.
The transfer was carried out for both, pre- and post-inter-ventional data sets of each patient. FemCoGen 3.0 quan-tifies partial volumetric and geometric informations. It calculates the partial volumes of each segment as well as two direction angles to quantify the direction of each seg-ment. For the surface of each segment it calculates an aver-age direction numbering the two angles shown in Figure 3. Endocardiac LV pressure was not known for the present data acquisitions. Therefore the length of the vector is nor-malized to one. Rotation and inclination angles were cal-culated for comparison purposes which were independent from the length of the normal vector. The quantification results for pre- and post-interventional data obtained with FemCoGen are shown for both patients in the results sec-tion.
The LV model consists of 16 segments as previously described [7]. Therein, the apex region consists of four segments (numbers: 13, 14, 15, 16). The wall is described by 12 segments: numbers 2 and 8 for the anterior wall, numbers 3 and 9 for the lateral wall, numbers 4 and 10 for the posterior wall, numbers 5 and 11 for the inferior wall, numbers 6 and 12 for the septum wall and numbers 1 and 7 for the anterior septum wall, respectively. These num-bers are used to describe and discuss the findings in the following sections.
Results
This chapter describes the results for the first quantitative comparison of pre- and post-interventional volumetric and geometric data with FemCoGen 3.0. The total LV vol-ume is shown in Figure 4 for both patients. Generally, the total LV volume decreases after the intervention. For both patients the maximum total volume of the LV at end-dias-tole (LVEDV) and the minimum at end-sysend-dias-tole (LVESV) can be compared. For PatCRT the LVEDV (LVESV) decreases from 339,5 ml (302,3 ml) pre-interventional to 299,6 ml (247,2 ml) post-interventional. For PatSVR it decreases from 307,7 ml (207,7 ml) pre-interventional to 269,8 ml (179,3 ml) post-interventional.
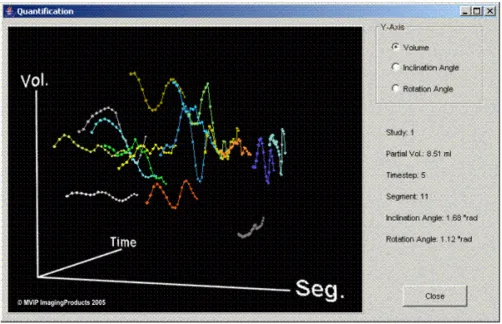
The partial volumes are calculated and plotted in 3D dis-plays (Figure 5). These 3D plots can be manipulated with the mouse and allow direct access to each of the data points. For better presentation in the present paper the display is reduced to 2D plots.
In Table 1 the time steps are correlated with points in the heart cycle.
FEM mesh of the left ventricle
Figure 1
BioMedical Engineering OnLine 2006, 5:58 http://www.biomedical-engineering-online.com/content/5/1/58
Patient PatCRT with cardiac resynchrinsation therapy
Figures 6 to 8 show the results for PatCRT. Figure 6 faces the partial volumes of PatCRT for the pre- and post-inter-ventional data acquisition. Figure 7 and Figure 8 show similar results for PatCRT for the rotation angles and for the inclination angles. Some striking changes from pre- to post-interventional partial volume results are observed for (1) volume changing (Figure 6: segments 7, 9 and 11), (2) decrease of the discrete volume changing from time step to time step (Figure 6: segments 10, 11 and 16), and (3) fraction shift of the partial volume (Figure 6: segments 3 and, 9).
Changes in the distribution of the rotation angle (Figure 7) are observed, too. Whereas there is not significant change in the segments around the anterior septum wall 1, 6, 7, 12, and 13, there are some segments with a change of approximately 0.5 rad or 30°. These are some segments on the lateral wall 3, 9, and 14.
For the inclination angle the situation is similar. The seg-ments 1, 2, 6, 7, and 12 around the anterior septum wall show few or no observable changes. Significant changes are observed in the segments 14, 15, and 16, the segments in the apex region. Segment 11 is significantly distorted after the intervention and shows a discrete curvature.
PatSVR with surgical ventricular repair therapy
Figures 9 to 11 show the results for PatSVR. For the partial volumes (Figure 9) most segments have homogeneous
Rotation angle and inclination angle
Figure 3
Rotation angle and inclination angle. For each segment the average normal vector (n0) is calculated. Two projections
of n0 – Pyz and Pxz – are used to calculate the rotation angle
(angle between Pxz and z-axis) and the inclination angle (angle
between Pyz and y-axis).
Registration process
Figure 2
curves in the range from 3 ml to 21 ml fraction contribu-tion to the total volume. The segments 10 and 15 behave aberrant from this. The partial volume of these segments is significantly higher than the partial volume of all other segments. After the intervention the partial volume of seg-ment 15 shows a decrease of 6 ml on average. The overall maximal partial volume of segment 10 in the pre-inter-ventional data is ~60 ml, with an average of ~42 ml. This is reduced and balanced after the intervention to an aver-age of 36 ml.
The rotation angle distribution in Figure 10 shows a change of the variance in most segments. Especially, for the segments 8 and 14 this means a reduction of the vari-ance of ~0.25 rad or ~15°. Segment 15 is the only one behaving antidromic with a variance increase almost in the same range. A reduction of the rotation angle on aver-age of approximately 0.30 rad or 18° is observed in the segments 6, 7, 12, and 14. A major decrease of the rotation angle is observed only in the segment 9.
The first qualitative impression of the two diagrams in Fig-ure 11 is of complete disorder due to the high variance of some curves (segments 1, 2, 8, 10), three of them belong-ing to the anterior/anterior septum wall section. Before the SVR therapy the segments 1, 8 and 10 show a high var-iance, but after the treatment the high variance changed to the segment 2 and 10. Apart from the segments with a high variance, there are two groups of segments. The first group consists of the segments 3, 5, 6, 7, 11, 12, and 16, with most belonging to the septum and inferior wall sec-tion. After the treatment this group shows an average incli-nation angle of 2 rad and the variance of the entire group decreases from 0,15 rad to 0,11 rad. The second group consists of the segments 9, 13, 14, and 15, most of them belonging to the apex region. After the treatment this group shows an average inclination angle of 0.50 rad and the variance of the entire group slightly increases from 0,11 rad to 0,13 rad.
The last figure (Figure 12), shows the qualitative visualisa-tion of pre- and post-intervenvisualisa-tional data for PatSVR using
Total LV volume
Figure 4
BioMedical Engineering OnLine 2006, 5:58 http://www.biomedical-engineering-online.com/content/5/1/58
the finite element visualisation and modelling tool ABAQUS.
Discussion
For both patients the method described quantifies the operation results post- and pre-interventional: PatCRT data show the elimination of the discontinuities of the partial volumens after the intervention; PatSVR data show the segments treated. They are clearly identified and quan-tified.
Quantitative pre- and intraoperative volumetry and geometry analysis of the LV is feasible in the cardiac oper-ation room using the technique described. The entire cal-culation process with FemCoGen takes less than 3 minutes for each data set. To the medical therefore it gives a detailed and immediate quantitative feedback of the quality of the intervention.
To ensure optimal medical treatment, medicine must meet industry-established benchmarks; this is a goal that can be attained only through the ongoing use of
appropri-3D plot of the partial volumes
Figure 5
3D plot of the partial volumes. This movable 3D plot from FemCoGen shows as an example the partial volumes of the pre-interventional data acquisition from PatCRT. The 16 segments are colour coded and the partial volume for each segment is plotted against the time. Moving the cursor and pointing to each point allows to identify immediately the values for each point in the right part of the frame.
Table 1: Correlation between time steps (frames) and selected points in the cardiac cycle.
Time step for PatCRT Pre-interventional
Time step for PatCRT Post-interventional
Time step for PatSVR Pre-interventional
Time step for PatSVR Post-interventional
endsystole 18 17 2 2
enddiastole 1 19 1 1
PatCRT partial LV volumes
Figure 6
BioMedical Engineering OnLine 2006, 5:58 http://www.biomedical-engineering-online.com/content/5/1/58
PatCRT rotation angle
Figure 7
PatCRT inclination angle
Figure 8
BioMedical Engineering OnLine 2006, 5:58 http://www.biomedical-engineering-online.com/content/5/1/58
PatSVR partial LV volumes
Figure 9
PatSVR rotation angle
Figure 10
BioMedical Engineering OnLine 2006, 5:58 http://www.biomedical-engineering-online.com/content/5/1/58
PatSVR inclination angle
Figure 11
ate quality management (QM) methods. The technique described in this paper is one step in this direction. It can be part of a QM process that closely resembles those found in industrial settings, where statistical process con-trols are used to improve quality.
Authors' contributions
JFV did the technical part analysing the FEM models. NSN acquired the data and did the medical part. Both authors read and approved the final manuscript.
References
1. Sermesant M, Forest C, Pennec X, Delingette H, Ayache N: Deform-able biomechanical models: Application to 4D cardiac image analysis. Medical Image Analysis 2003, 7:475-488.
2. Stevens C, Remme E, LeGrice I, Hunter P: Ventricular mechanics in diastole: material parameter sensitivity. Journal of Biome-chanics 2003, 36:737-748.
3. Mackerle J: Finite element modelling and simulations in cardi-ovascular mechanics and cardiology: A bibliography 1993– 2004. Computer Methods in Biomechanics & Biomedical Engineering
2005, 8:59 -581.
4. Sinusas AJ, Papademetris X, Constable RT, Dione DP, Slade MD, Shi PC, Duncan JS: Quantification of 3-D regional myocardial deformation: shape-based analysis of magnetic resonance images. American Journal of Physiology Heart & Circulatory Physiology
2001, 281:H698-H714.
5. Aelen FW, Arts T, Sanders DG, Thelissen GR, Prinzen FW, Reneman RS: Kinematic analysis of left ventricular deformation in myocardial infarction using magnetic resonance cardiac tag-ging. International Journal of Cardiac Imaging 1999, 15:241-251. 6. Wu Guo-hua, Liu Feng, Xia Ling, Wei-xue L: Construction of three
dimensional composite finite element mechanical model of
human left ventricle. Chinese Journal of Biomedical Engineering 2002,
21:404-410.
7. Verhey JF, Nathan NS: Feasibility of rapid and automated importation of 3D echocardiographic left ventricular (LV) geometry into a finite element (FEM) analysis model. BioMed-ical Engineering OnLine 2004, 3:1-15.
8. Erdmann E: Klinische Kardiologie : Krankheiten des Herzens, des Kreislaufs und der herznahen Gefäße. Heidelberg, Springer Medizin; 2006.
9. Liu F, Lu WX, Xia L, Wu GH: The construction of three-dimen-sional composite finite element mechanical model of human left ventricle. JSME International Journal Series C Mechanical Systems Machine Elements & Manufacturing 2001, 44:125-133.
10. Usyk TP, Belik ME, Michailova A, McCulloch AD: Three-dimen-sional model of cardiac electromechanics: cell to organ. Con-ference Proceedings Second Joint EMBS BMES ConCon-ference
2002:1220-1221.
11. Solomon SD, Aikawa Y, Martini MS, Rosario L, Makker G, Gerson D, Greaves S, Lee RT: Assessment of regional left ventricular wall stress after myocardial infarction by echocardiography-based structural analysis. Journal of the American Society of Echocar-diography 1998, 11:938-947.
12. Athanasuleas CL, Stanley AWH, Buckberg GD, Vincent Dor V, DiDo-nato M, Blackstone EH: Surgical anterior ventricular endocar-dial restoration (SAVER) in the dilated remodeled ventricle after anterior myocardial infarction. Journal of the American Col-lege of Cardiology 2001, 37:1199-1209.
13. Brignole M: Cardiac resynchronisation therapy: what any clini-cian should know. E-Journal of Cardiology Practice 2004, 3:(8) 1ff. 14. Auricchio A, Abraham WT: Cardiac Resynchronization
Ther-apy: Current State of the Art: Cost Versus Benefit. Circulation
2004, 109:300-307.
15. TomTec Imaging Systems GmbH: 4D LV-Analysis TEE. 1.0th edi-tion. 2002.
16. MVIP ImagingProducts LLC: FemCoGen. 3.0th edition. 2005 [http:/ /www.mvip.us]. Columbus, Ohio, USA,
Visual comparision with ABAQUS
Figure 12