* Corresponding author. Tel.: +09437282982 E-mail: [email protected] (A. K. Sahoo) © 2011 Growing Science Ltd. All rights reserved. doi: 10.5267/j.ijiec.2011.06.001
International Journal of Industrial Engineering Computations 2 (2011) 819–830
Contents lists available at GrowingScience
International Journal of Industrial Engineering Computations
homepage: www.GrowingScience.com/ijiecSurface roughness model and parametric optimization in finish turning using coated carbide insert: Response surface methodology and Taguchi approach
Ashok kumar Sahooa*and Bidyadhar Sahoob
aSchool of Mechanical Engineering, KIIT University, Bhubaneswar-24, Orissa, India bDepartment of Mechanical Engineering, IGIT, Sarang, Orissa, India
A R T I C L E I N F O A B S T R A C T
Article history: Received 1 April 2010 Received in revised form June, 5, 2011
Accepted 6 June 2011 Available online 6 June 2011
This paper presents the experimental study, development of mathematical model and parametric optimization for surface roughness in turning D2 steel using TiN coated carbide insert using Taguchi parameter design and response surface methodology. The experimental plan and analysis was based on the Taguchi L27 orthogonal array taking cutting speed (v), feed
(f) and depth of cut (d) as important cutting parameters. The influence of the machining parameters on the surface finish has also been investigated and the optimum cutting condition for minimizing the surface roughness is evaluated. The optimal parametric combination for TiN coated cutting insert is found to be v3-f1-d3. The ANOVA result shows that feed the most significant process parameter on surface roughness followed by depth of cut. The cutting speed is found to be insignificant from the study. The RSM model shows good accuracy between predicted values and experimental values with 95% confidence intervals and adequate. It is concluded that the developed RSM model can be effectively utilized to predict the surface roughness in turning D2 steel.
© 2011 Growing Science Ltd. All rights reserved
Keywords:
Taguchi Surface roughness Response surface method Optimization
Coated carbide
1. Introduction
carbonitride (TiCN) and aluminium oxide (Al2O3), deposited in a multilayer manner into cemented carbide substrates to improve the hardness and surface conditions. Seventy percentage of the cemented carbide tools used in the industry are coated (Abdullah , 1996). Since then, research in this field has expanded considerably and has brought the attention of researchers such as Klocke (1999) and Stappen et al. (1995). The outstanding performance of TiN coatings, together with the evolution of the deposition techniques, have allowed the development of more advanced ternary and multilayer coatings reported by Imbeni et al. (2008).
Quality of the machined component is an important index of machinability for evaluating the productivity. Usually, the cutting parameters are selected based on experience or a handbook (Yang & Tarng, 1998) by engineer but it does not yield the accurate results. Therefore, in turning process, it is important task to select cutting parameters for achieving high cutting performance, which greatly influences manufacturing cost. An optimum selection of cutting conditions is extremely important. In order to predict surface quality in advance, it is important to develop theoretical models. Thomas et al. (1997) used a full factorial design involving six factors to investigate the effects of cutting and tool parameters on the resulting surface roughness and on built-up-edge formation in the dry turning of carbon steel. Yang and Tarng (1998) to find the optimum cutting parameters for turning operations
used the Taguchi method. Choudhury and EI-Baradie (1997) used RSM and 23 factorial designs for
predicting surface roughness when turning high-strength steel. Nian et al. (1999) used the Taguchi method with multiple performance characteristics in the optimization of turning operations. On the other hand, Lin et al. (2001) used a network to construct a prediction model for surface roughness and cutting force.
Aggarwal et al. (2008) developed mathematical model on surface roughness and power consumption using RSM and Taguchi techniques in his work. In turning, use of greater insert radius, low feed rate and low depth of cut are recommended to obtain better surface roughness in turning AISI 1030 steel
with TiN coated carbide insert reported by Nalbant et al. (2007) utilizing Taguchi DOE. Davim
(2001) studied the influence of cutting conditions on the surface finish in turning using carbide tool based on Taguchi method and established a correlation between cutting parameters with roughness using multiple linear regression analysis. The results indicated that the cutting speed and interaction between cutting speed/feed had a greater influence on surface roughness followed by feed but depth of cut has no significance. Singh & Kumar (2007) developed mathematical models of tool life & surface roughness for turning En24 steel with TiC coated carbide and RSM model was found suitable. It is concluded from literatures that RSM can better predict the effect of parameters on response and is a better tool for optimization.
Tool steels coming under AISI group D category are widely used in the manufacture of moulds and dies for the production of automotive and electronic components (Coldwell et al., 2003). The machining of D2 steel is difficult owing to its high carbon and high chromium content and has poor machinabilty, which is of little researched area. Machinability is the ease where a work material is machined under a given set of cutting parameters and surface finish plays the vital role in the study of machinability. Most of the researchers investigated surface roughness using one-variable-at-a-time approach (Isik, 2007). The present study deals with the simultaneous variation of cutting speed, feed and depth of cut on surface roughness in machining of D2 steel using TiN coated carbide insert.
2. Materials and methods
2.1 Test specimen
The work material used for the present study is high carbon high chromium cold work D2 tool steel with a hardness of 22 ± 1 HRC and it has been full annealed. The material is known as cold work tool steel in the industry. In order to assure the necessary stiffness, cylindrical turning length (L) of 140 mm with an initial diameter 40 mm (D) is chosen which corresponds to (L/D) ratio 4. The chemical composition of D2 w/p , measured by spectral analyzer, in weight percentage is follows: C (1.55), Cr (11.8), Si (0.4), Mn (0.4), Mo (0.7), V (0.5), W (0.6), S (0.03) and P (0.03).
2.2 Taguchi method
The objective of the parameter design (Ross P.J, 1996) is to optimize the process parameter values for enhancing the utility of responses, which are insensitive to the variation of environmental conditions and other noise factors. Fisher (1925) has developed classical parameter design, which is very complex and inconvenient for application. The main drawback is that very large numbers of experiments are required as the process parameter increases. To overcome this problem, Taguchi method utilizes orthogonal arrays of experimental design with a small number of experiments to reduce time and cost. Next, Taguchi uses the loss function to measure the performance characteristic deviating from the desired value. The value of loss function is then further transformed to S/N ratio. Usually, there are three categories of the performance characteristic in the analysis of the S/N ratio, that is, the lower-the-better, the higher-the-better, and the nominal-the-better. The S/N ratio for each level of process parameters is computed based on the S/N analysis and the larger S/N ratio corresponds to the better performance characteristic. Therefore, the optimal level of the process parameter is the level with the highest S/N ratio. Next, a statistical analysis of variance (ANOVA) is performed to judge the statistical significant process parameters affecting the responses. With the S/N and ANOVA analyses, the optimal combination of the process parameters can be predicted. The steps of Taguchi parameter design is follows:
1. Selection of process parameters and identification of responses,
2. Assignment of levels to the process parameters,
3. Selection of proper orthogonal array and assignment of process parameters to the orthogonal array,
4. Experiment is to be conducted based on orthogonal array,
5. Calculation of loss function and the S/N ratio,
6. Calculation of mean S/N ratio and analyze the results,
7. Analysis of variance (ANOVA),
8. Selection of optimal combination of process parameters,
9. Verification test of optimal process parameter
2.3 Response surface methodology
The first step in RSM is to determine a suitable approximation for the true functional relationship between the response variable, y, and a set of independent variables as follows,
2 0
1 1 ,
k k
i i ii i ij i j
i i i j
y β βx β x β x x ε
= = <
= +∑ +∑ +∑ ∑ + (1)
where β are the coefficients which are calculated using an appropriate method such as the least square method and the RSM is then performed using the fitted surface. When resulted estimated surface is an adequate approximation of the true response function, the results will be approximately equivalent to analysis of the actual system. The model parameters can be approximated whenever proper experimental designs are used to collect the data.
2.4 Experimental procedure
The finish turning experiment was conducted according to Taguchi L27 orthogonal array. This
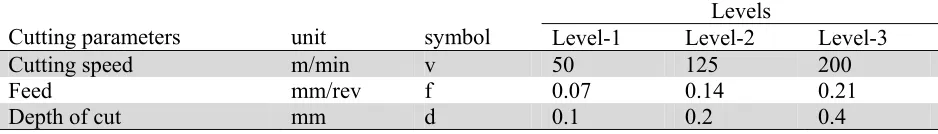
requires 27 runs and 26 degrees of freedom and can conduct three levels of parameters. The parameters selected for experimentation are cutting speed (v), feed (f) and depth of cut (d). The machining parameters and their levels are shown in Table 1.
Table 1
Cutting parameters and their levels
Cutting parameters unit symbol Level-1 Level-2 Level-3 Levels
Cutting speed m/min v 50 125 200
Feed mm/rev f 0.07 0.14 0.21
Depth of cut mm d 0.1 0.2 0.4
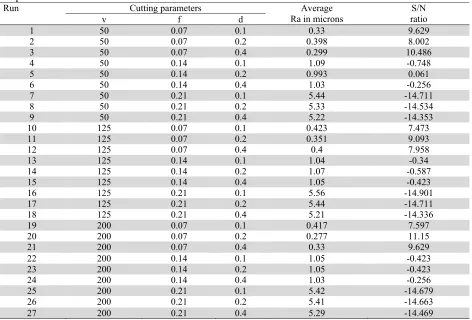
In addition, Taguchi method suggests the equation for calculating the S/N ratio for smaller-the-better characteristics (in dB) is S/NLB = -10 log10 (1/r Σ Ra2) where Rais the value of surface roughness for the ith test in that trial.
The experiments were performed on CNC lathe (Jobber XL, AMS India), maximum spindle speed of 3500 rpm, and 16KVA spindle power with sinumeric controller. The cutting insert was golden TiN coated carbide (ISO designation DNMG 15 06 04) with 0.4mm nose radius which is rigidly mounted on a right hand style tool holder designated by ISO as PDJNR2525M15. The machining length was taken as 30mm. The arithmetic average surface roughness of the turned surface was measured using a
perthometer (Perthen S6R, Germany) with traversing distance of 8mm and least count of 0.001μm.
The surfaces are cleaned and positioned using a V-block before each measurement. The surface roughness has been measured 3 times and averaged. The purpose of experiment was to assess the performance of TiN coated carbide insert in machining D2 steel and study the parametric influence on surface roughness. Typically, grinding or honing surface-finishing processes yield surfaces with a Ra in the range of 0.1–1.6µm. We used 1.6µm as the control criterion for finish hard turning (Noordin et al., 2007).
3. Experimental results and discussion
Table 2
Experimental results and S/N ratio
Run Cutting parameters Average
Ra in microns ratio S/N
v f d
1 50 0.07 0.1 0.33 9.629
2 50 0.07 0.2 0.398 8.002
3 50 0.07 0.4 0.299 10.486
4 50 0.14 0.1 1.09 -0.748
5 50 0.14 0.2 0.993 0.061
6 50 0.14 0.4 1.03 -0.256
7 50 0.21 0.1 5.44 -14.711
8 50 0.21 0.2 5.33 -14.534
9 50 0.21 0.4 5.22 -14.353
10 125 0.07 0.1 0.423 7.473
11 125 0.07 0.2 0.351 9.093
12 125 0.07 0.4 0.4 7.958
13 125 0.14 0.1 1.04 -0.34
14 125 0.14 0.2 1.07 -0.587
15 125 0.14 0.4 1.05 -0.423
16 125 0.21 0.1 5.56 -14.901
17 125 0.21 0.2 5.44 -14.711
18 125 0.21 0.4 5.21 -14.336
19 200 0.07 0.1 0.417 7.597
20 200 0.07 0.2 0.277 11.15
21 200 0.07 0.4 0.33 9.629
22 200 0.14 0.1 1.05 -0.423
23 200 0.14 0.2 1.05 -0.423
24 200 0.14 0.4 1.03 -0.256
25 200 0.21 0.1 5.42 -14.679
26 200 0.21 0.2 5.41 -14.663
27 200 0.21 0.4 5.29 -14.469
3.1 Effect of process parameters on surface roughness
Fig. 1 shows that surface roughness is low at low feed i.e. 0.07mm/rev as compared to the other levels of feed i.e. 0.14mm/rev and 0.21mm/rev. The surface roughness increases as the feed rate increases as the surface roughness being proportional to the square of the feed rate. The higher feed rate traverses the work piece too rapidly resulting in deteriorated surface quality. The increase in feed also increases the chatter, which led to higher surface roughness. The results shown prove that the roughness of the machined surface is highly influenced by feed. The values of surface roughness are within the range of finish turning (1.6µm) except at higher feed i.e. 0.21 mm/rev.
0.06 0.09 0.12 0.15 0.18 0.21 0 1 2 3 4 5 6
v = 200 m/min d = 0.4 mm
Su rf ace r oug hness (m ic ro n s) Feed (mm/rev) TiN coated carbide
25 50 75 100 125 150 175 200 0.8 0.9 1.0 1.1 1.2 1.3
f = 0.14 mm/rev d = 0.2 mm
Sur face r oug hness ( m ic rons)
Cutting speed (m/min) TiN coated carbide
0.10 0.15 0.20 0.25 0.30 0.35 0.40 0.27 0.30 0.33 0.36 0.39 0.42 0.45 0.48
v = 50 m/min f = 0.07 mm/rev
S u rf ace r o ughn ess ( m ic ro ns)
Depth of cut (mm) TiN coated carbide
Fig. 1. Feed vs surface roughness at v = 200 m/min, d = 0.4 mm
Fig. 2. Cutting speed vs surface roughness at f = 0.14 mm/rev & d = 0.2 mm
Fig. 2 shows the influence of cutting speed on the average surface roughness during turning of D2 steel. The experimental results show that the average surface roughness variation at low & high cutting speed is very marginal. The average surface roughness is higher at smaller depth of cut and lowers at higher depth of cut observed in Fig.3. Depth of cut does not impact the surface roughness in the studied range so much. It can be used to improve productivity if it would not deteriorate the surface microstructure, dimension and geometric accuracy. The surface roughness is within the recommended range of finish turning (1.6µm). From the experimental observation, it is understood that, TiN coated carbide insert have successfully performed in finish turning of D2 steel. The effectiveness of coated carbide insert can be enhanced with optimized cutting parametric combinations.
4. Determination of optimal cutting parameters
This section provides the results of S/N ratio, main effect plot and ANOVA. From the results of mean S/N ratio and ANOVA analysis, the optimal combination of cutting parameters is achieved and verification tests have been performed to predict the improvement.
4.1 Analysis of the signal-to-noise (S/N) ratio
In Taguchi method, the term signal represents the desirable value and noise represents the undesirable value. Process parameters with the highest S/N ratio always give the optimum quality with minimum variance (Phadke, 1989). The S/N ratio for each parameter level is calculated by averaging the S/N ratios at the corresponding level. Table 3shows the response table for S/N ratio of surface roughness obtained for different parameter levels.
Table 3
Response table of S/N ratio for surface roughness
Level v f d
1 -1.8718 8.8619 -1.9257
2 -2.3282 -0.3828 -2.2698
3 -1.9201 -14.5992 -1.9246
Δ (max-min) 0.4565 23.4611 0.3452
Rank 2 1 3
Total mean S/N ratio = -2.04
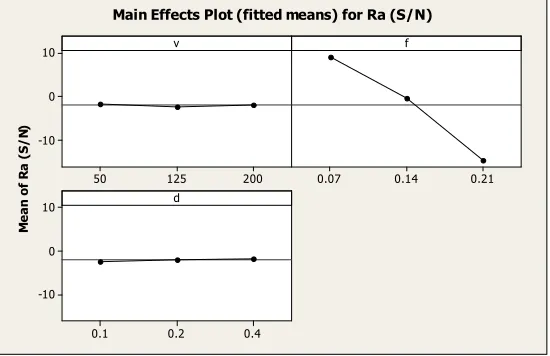
The surface roughness considered in the investigation is the lower-the better quality characteristics.
Me
a
n
o
f R
a
(
S
/
N
)
200 125
50 10
0
-10
0.21 0.14
0.07
0.4 0.2
0.1 10
0
-10
v f
d
Main Effects Plot (fitted means) for Ra (S/N)
From the Fig. 4, it is seen that the variation of mean S/N ratio at lower and higher cutting speed is very marginal (0.04). Therefore, in the present investigation, the cutting speed at high level is chosen as optimum condition to take the benefit of high speed machining & productivity reasons. The reason that at higher cutting speeds, BUE formation disappears and chip-tool contact length decreases resulting in higher machinabilty. Also at higher cutting speeds, cutting zone temperature increases and thus in turn, softens and decreases strength of BUE. Also from the Fig. 4, it is observed that, the mean S/N ratios are almost same values but little higher at high depth of cut. Therefore, high level of depth of cut is selected for optimum. The results prove that the surface roughness of the machined surface is highly influenced by the feed compared to cutting speed and depth of cut and higher S/N ratio is obtained at low feed level.
4.2 Analysis of variance
The ANOVA study is carried out to investigate the statistical significance of the process parameters affecting the response (surface roughness). This is accomplished by separating the total variability of the S/N ratios, which is measured by the sum of the squared deviations from the total mean of the S/N ratio, into contributions by each of the process parameters and the error (Nalbant et al., 2007).F-test is performed to judge the significant parameter affecting the surface roughness. The larger F-value
affects more on the performance characteristics. Table 4 shows the results of ANOVA for surface
roughness. From ANOVA Table 4, it is found that, feed is the significant parameter on surface roughness. The cutting speed and depth of cut is found to be insignificant from ANOVA study.
Table 4
Results of ANOVA using data from S/N ratio for surface roughness
Source DF SS MS F P Remarks
v 2 1.37 0.68 1.18 0.329 Insignificant
f 2 2540.83 1270.41 2187.08 0.000 Significant
d 2 1.72 0.86 1.48 0.252 Insignificant
Error 20 11.62 0.58
Total 26 2555.53
Based on the S/N and ANOVA analysis, the optimum cutting conditions for surface roughness is obtained:
Cutting speed (v) - 200 m/min Feed (f) - 0.07 mm/rev Depth of cut (d) - 0.4mm
4.3 Verification tests
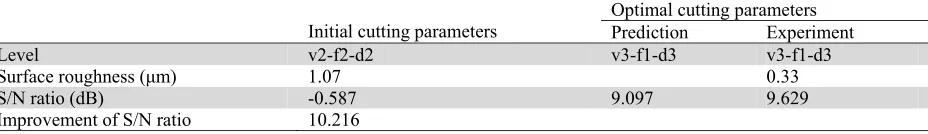
The last step of Taguchi parameter design is to verify and predict the improvement of surface roughness (response) using optimum combination of cutting parameters. The estimated S/N ratio using the optimal combination of cutting parameters has been calculated according to Nalbant (2007). Table shows the results of verification test and comparison between the predicted machining performance and actual machining performance is obtained. The increase of S/N ratio is desirable. According to Table 5, the improvement of S/N ratio from initial cutting parameters to optimal cutting parameters is 10.216dB. In addition, it is evident from verification test result that, the surface roughness is decreased 3.24 times and is greatly improved.
Table 5
Results of the verification experiment for surface roughness
Initial cutting parameters Optimal cutting parameters Prediction Experiment
Level v2-f2-d2 v3-f1-d3 v3-f1-d3
Surface roughness (μm) 1.07 0.33
S/N ratio (dB) -0.587 9.097 9.629
5. Development of surface roughness model
The relationship between the surface roughness and machining parameters such as cutting speed (v), feed (f) and depth of cut (d) for second order response surface model has been developed using RSM from the observed data in uncoded units as follows:
2 2 2
2
3.238 0.001 67.337 0.18 0.000 371.19 0.819
0.002 0.001 4.59 99.9%
a
Adj
R v f d v f d
vf vd fd R
= + − − − + +
− − − = (2)
5.1 Model adequacy checking
This analysis is carried out for a level of significance of 5% (0.05), i.e., for a level of confidence of
95%. An ANOVA Table 6 for the response function surface roughness is commonly used to
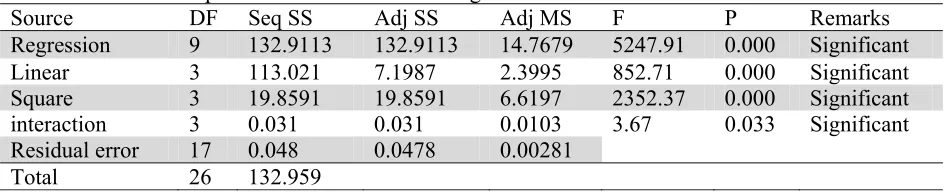
summarize the tests performed and to check the adequacy of the model. F-ratio is the ratio between the regression mean square and the mean square error. It measures the significance of model under investigation with respect to the variance of all the terms included in the error term at the desired significance level. If the calculated value of F-ratio is higher than the tabulated value of F-ratio for surface roughness, then the model is adequate at the desired significance level. In the ANOVA table, there is a P-value for each independent parameter in the model. If the P-value is less than or equal to the desired significance level, then the effect of variable is significant.
Table 6
ANOVA table for response function of surface roughness
Source DF Seq SS Adj SS Adj MS F P Remarks
Regression 9 132.9113 132.9113 14.7679 5247.91 0.000 Significant
Linear 3 113.021 7.1987 2.3995 852.71 0.000 Significant
Square 3 19.8591 19.8591 6.6197 2352.37 0.000 Significant
interaction 3 0.031 0.031 0.0103 3.67 0.033 Significant
Residual error 17 0.048 0.0478 0.00281
Total 26 132.959
Table 7
ANOVA for model coefficients for surface roughness
Source DF SS MS F P
v 2 0.0098 0.0049 1.32 0.319
f 2 132.8244 66.4122 17906.23 0.000
d 2 0.0461 0.0231 6.22 0.024
v.f 4 0.0036 0.0009 0.24 0.905
f.d 4 0.0438 0.011 2.95 0.09
v.d 4 0.0017 0.0004 0.11 0.974
Error 8 0.0297 0.0037
Total 26 132.9592
of the data for surface roughness are shown in Fig. 5, 6 and 7 respectively. From the normal probability plot of residuals (i.e error = predicted value from model – actual value) in Fig. 5, it is evident that the residuals lie reasonably close to a straight line implying that errors are distributed normally. This gives support that terms mentioned in the model are significant. In addition, Fig. 6 and 7 revealed that there is no noticeable pattern or unusual structure present in the data. Hence, the RSM model developed is significant & adequate.
Fig. 5. Normal probability plot of
residuals for surface roughness data Fig. 6.values for surface roughness Plot of residuals vs. the fitted Fig. 7.data Residuals vs the order of the
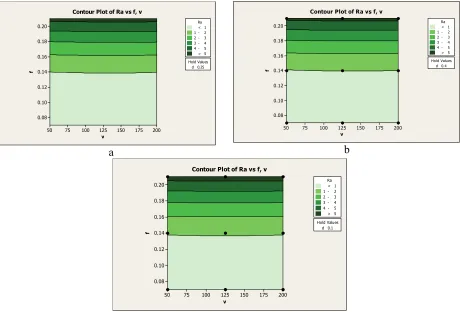
Fig. 8 shows the contours for each of the response surfaces at different depth of cuts. The contour plot predicts the surface roughness at any zone of the experimental domain. It is evident from contour figures that the surface roughness decreases with increase of cutting speed and depth of cut but their variation is very minimal. However, it increases with the elevation of feed.
v f 200 175 150 125 100 75 50 0.20 0.18 0.16 0.14 0.12 0.10 0.08 Hold Values d 0.25 Ra
2 - 3 3 - 4 4 - 5 > 5 < 1 1 - 2
Contour Plot of Ra vs f, v
a v f 200 175 150 125 100 75 50 0.20 0.18 0.16 0.14 0.12 0.10 0.08 Hold Values d 0.4 Ra
2 - 3
3 - 4
4 - 5
> 5 < 1
1 - 2
Contour Plot of Ra vs f, v
b v f 200 175 150 125 100 75 50 0.20 0.18 0.16 0.14 0.12 0.10 0.08 Hold Values d 0.1 Ra
2 - 3
3 - 4
4 - 5
> 5 < 1
1 - 2
Contour Plot of Ra vs f, v
c
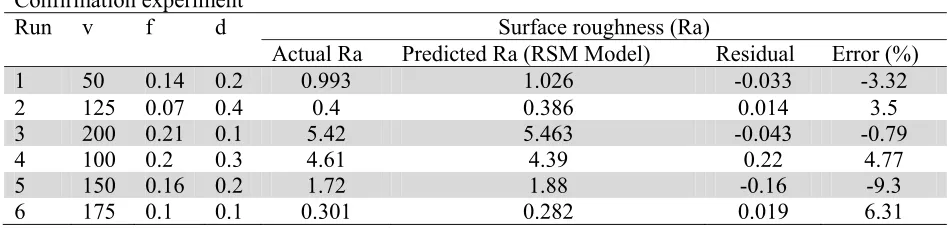
5.1 Validation of experimental results
Finally, confirmation tests are conducted (Table 8) to predict the improvement in the surface roughness for machining of cold work tool steel with respect to the chosen initial parameter setting.
Table 8
Confirmation experiment
Run v f d Surface roughness (Ra)
Actual Ra Predicted Ra (RSM Model) Residual Error (%)
1 50 0.14 0.2 0.993 1.026 -0.033 -3.32
2 125 0.07 0.4 0.4 0.386 0.014 3.5
3 200 0.21 0.1 5.42 5.463 -0.043 -0.79
4 100 0.2 0.3 4.61 4.39 0.22 4.77
5 150 0.16 0.2 1.72 1.88 -0.16 -9.3
6 175 0.1 0.1 0.301 0.282 0.019 6.31
In order to verify the adequacy of the model developed, six confirmation experiments were performed. The first three confirmation experiments are among the cutting conditions taken previously while for the remaining three confirmation experiments; separate cutting conditions have been used. The predicted values are based on the model developed, previously. The predicted value and the actual experimental value were compared and the residual and the percentage error was calculated. The percentage error range between the actual and predicted value for Ra was -9.3 to 6.31 % for response surface model. From the analysis of verification test, it can be observed that the predicted values were very close to the experimental results. This is concluded that the mathematical models developed by response surface methodology were reasonably accurate for surface roughness.
6. Conclusions
This paper presented the following conclusions of an experimental investigation of the effect of process parameters on surface roughness in finish turning of D2 steel using TiN coated carbide insert.
1. The effect of machining parameters on the surface roughness has been evaluated with the help of Taguchi orthogonal array. The optimal machining conditions to minimize the surface roughness have been determined.
2. From the experimental results, it is evident that the surface roughness increases as feed rate increases. The experimental results showed that the average surface roughness variation at low & high cutting speed was very marginal. Depth of cut did not impact the surface roughness in the studied range, significantly.
3. From S/N ratio and response table, it is observed that the feed is the most influencing parameter for surface roughness. By increasing the feed, the surfaces roughness increases. The higher feed rate led cutting tool to traverse the work piece so rapidly that deteriorates the surface quality. Cutting speed is the next influencing parameter on surface roughness while the effect of depth of cut is very minimal.
4. For achieving good surface finish on the D2 work piece using TiN coated tool, higher cutting speed, and lower feed and higher depth of cut were preferred. The optimal parametric combination for TiN coated cutting insert was reported as v3-f1-d3.
residuals generally fall on a straight line implying that errors are distributed normally. Hence, the RSM model developed is significant & adequate.
6. Surface roughness model: feed was the most significant parameter with ‘p’ value being less than 0.05 whereas cutting speed and depth of cut is found be insignificant.
7. The predicted and measured values were fairly close, which indicated that the developed RSM model could be effectively used to predict the surface roughness on the machining of tool steel with 95% confidence intervals and was greatly improved. By using this model, one can go for direct evaluation of Ra under various machining combinations during turning.
8. From the above results, it is proved that the cutting conditions are optimized and minimum surface roughness values are obtained for machining of cold work tool steel.
This research highlighted the use of Taguchi parameter design and response surface methodology for optimizing machining parameter and development of prediction model with minimum cost and time. Further study may be considered for more factors such as insert radius, rake angle, other coated tool materials, w/p materials and cutting fluids etc. In this study, a second-order polynomial model has been employed. Artificial neural network model may also be developed for effectiveness.
Acknowledgement
The author is highly grateful to Central Tool room & Training Centre (CTTC), Bhubaneswar, India and Central Mechanical Engineering Research Institute (CMERI), Durgapur, India for their support towards experimental and measurement works.
References
Abdullah, A. (1996). Machining of aluminium based metal matrix composite (MMC), Ph.D Thesis,
University of Warwick, Warwick, UK.
Aggarwal, A., Singh, H., Kumar, P., & Singh, M. (2008). Optimizing power consumption for CNC turned parts using response surface methodology and Taguchi’s technique—A comparative analysis. Journal of materials processing technology, 200, 373–384.
Choudhury, I.A., & El-Baradie, M.A. (1997). Surface roughness prediction in the turning of high-strength steel by factorial design of experiments. Journal of Materials Processing Technology, 67, 55-61.
Coldwell, H., Woods, R., Paul, M., Koshy, Ph. Dewes, R., & and Aspinwall, D. (2003). Rapid
machining of hardened AISI H13 and D2 moulds, dies and press tools. Journal of Materials
Processing Technology, 135, 301–311.
Davim, J.P. (2001). A note on the determination of optimal cutting conditions for surface finish obtained in turning using design of experiment. Journal of Materials Processing Technology, 116, 305-308.
Fisher, A. (1925). Statistical Methods for Research Worker, Oliver & Boyd, London.
Imbeni, V., Martini, C., Lanzoni, E., Poli, G. and Hutchings, I.M. (2001). Tribological behaviour of multi-layered PVD nitride coatings. Wear, 251, 997-1002.
Isakov, E. (2009). Cutting data for turning steel. Industrial press, New York, USA, 104.
Isik, Y. (2007). Investigating the machinability of tool steels in turning operations. Materials and
Design, 28, 1417–1424.
Klocke, F., & Krieg, T. (1999). Coated tools for metal cutting-features and applications. Annals of CIRP, 48(2), 1-11.
Lin, V.S., Lee, B.Y., & Wu, C.L. (2001). Modeling the surface roughness and cutting force for turning. Journal of Materials Processing Technology, 108, 286-293.
Nalbant, M., Gokkaya, H., & Sur, G. (2007). Application of Taguchi method in the optimization of cutting parameters for surface roughness in turning. Materials and Design, 28, 1379-1385.
Nian, C.Y., Yang, W.H., & Tarng, Y.S. (1999). Optimization of turning operations with multiple performance characteristics. Journal of Materials Processing Technology, 95, 90-96.
Noordin, M. Y., Tang, Y. C., & Kurniawan, D. (2007). The use of TiALN coated carbide tool when finish machining hardened stainless steel. International Journal of Precision Technology, 1(1), 21-29.
Phadke, M.S. (1989). Quality engineering using robust design, Englewood Cliffs, NJ:Prentice-Hall. Ross, P.J. (1996). Taguchi Techniques for Quality Engineering, McGraw-Hill, New York.
Sahin, Y., & Motorcu, R. A. (2005). Surface roughness model for machining mild steel with coated carbide tool. Materials and Design, 26, 321–326.
Singh, H., & Kumar, P. (2007). Mathematical models of tool life &surface roughness for turning operation through response surface methodology. Journal of scientific & industrial research, 66, 220-226.
Stappen, V.M., Stals, L.M., Kerkhofs, M. and Quaeyhaegens, C. (1995). State of the art for the industrial use of ceramic PVD coatings. Surface and Coatings Technology, 74/75, 629-633.
Thomas, M., Beauchamp, Y., Youssef, Y.A., Masounave, J. (1997). An experimental design for
surface roughness and built-up-edge formation in lathe dry turning. International Journal of
Quality Science, 2 (3), 167-180.
Wallbank, J. (1991). Development in tool materials, advanced machining for quality and
productivity, Proceedings of the second international conference on behaviour of materials in
Machining. York, UK, Nov 14-15.
Yang, W.H. and Tarng, Y.S. (1998). Design optimization of cutting parameters for turning operations based on Taguchi method. Journal of Materials Processing Technology, 84, 112-129.