Issues
ISSN: 2146-4138
available at http: www.econjournals.com
International Journal of Economics and Financial Issues, 2017, 7(5), 282-289.
The Effect of Oil Price Falling on the Jordanian Economic System
Asem Tahtamouni
1*, Fouzan Al Qaisi
2, Usama
Adnan
Fendi
31American University of Madaba, P. O. Box: 2882, Amman 11821, Jordan, 2American University of Madaba, P. O. Box: 2882,
Amman 11821, Jordan, 3American University of Madaba, P. O. Box: 2882, Amman 11821, Jordan, *E-mail: [email protected]
The publication fee of this paper was supported by the American University of Madaba - Jordan.
ABSTRACT
Because oil is one of the most important commodities, its price impacts the economy as a whole. The oil price has dropped significantly during last
years due to the growing gap between demand and supply. Jordan is a small country with a small market business and scarce natural resources, essential the government’s hefty reliance on external assistance. This paper aims to evaluate the effect of oil price falling on the Jordanian economic system. Simple regression model has been used to evaluate the relationship between dependent and independent variables. It has been examined the variables
between the period 2006 and 2015. The results show that the fall in oil prices impact on the Jordanian economy.While, Jordan is an importer of oil, and
should be one of those countries that benefit from this drop, research has proven otherwise, in fact, the disadvantages weigh more than the advantages.
Keywords: Oil Price, Jordanian Economy,Trade of Balance, Gross Domestic Product
JEL Classifications: F1, Q43
1. INTRODUCTION
In the news, we constantly hear that the world is running out of oil, leading us to think that the world supply would be smaller; therefore, the price would be higher. However, the opposite is
happening, prices have dropped significantly, making oil relatively
cheaper than it has ever been.
The price of oil, gas, and coal is formed by supply and demand,
until recently, three forces influenced this: First, the importance
of oil, monopoly positions, and the geopolitical games. These three forces have always determined the price of oil, until the
end of the 20th century, a forth force has entered the scene: Burning oil. Burning oil is one of the main sources of global warming; therefore, alternative forms of self-renewing energy
must replace oil as soon as possible (Danzuraidi, 2016).
However, for this to happen, the price of oil should be higher and therefore fairer than it currently is, which thus makes renewable sources more attractive to use. Yet, the price of oil still seems to be controlled by monopolistic positions and geopolitical games.
Who is playing these geopolitical games and keeping the price so low? There are many national and international players in the oil game. One of these players is the Organization of the Petroleum
Exporting Countries (OPEC). Forming this alliance of the 12 already influential oil-producing countries to determine world
supply and hence control the price in the past decades.
However, in recent years, other players have also become powerful, to try to swiftly defeat this competition. However, OPEC has opened its oil taps completely, greatly increasing supply; this caused the price to fall so dramatically lately. Such a low price is obviously not favorable for any oil producing country.
Oil is the world’s most essential fuel and supports our elevated standard of living. It provides contemporary accessibility and source of movement. Also, oil is pivotal to transportation systems
(APPEA, 2016). Petrol, diesel, jet fuel, and kerosene are products of the oil refining process. Any byproducts produced, as secondary product made in the synthesis of the oil refining process are also valuable. These byproducts include paraffin, lubricating oils, heavy
The production and refinery process of oil begun in 1850s. The top five countries with the highest dollar value resultant from exporting crude oil in 2015 are, from highest to lowest; Saudi Arabia, Russia, Iraq, United Arab Emirates, and Canada (Workman, 2016). The
following chart displays the fluctuations in Brent Crude oil price in US dollars per barrel, from 2000 to 2015 (Chart 1).
The fluctuations of oil prices are more volatile than the value of
any other investment, and because oil is considered to be a highly
demanded commodity universally, the fluctuations of its price impact the economy as a whole. The biggest influence on oil prices is OPEC; control 40% of the world’s oil supply, and affects the
oil price by production levels. Another factor is natural disasters;
for example, the hurricane Katrina in 2005 affected 19% of the
United States’ oil supply, causing prices to incline $3 per barrel. Also, production costs affect oil prices; extracting oil from Middle Eastern regions is considered to be relatively cheap compared to
the extractions of oil from Albert Canada (Vidal, 2008). In addition to political instability, in July of 2008, the prices had risen to $136
per barrel, due to wars and unrests in Afghanistan and Iraq stoked
consumer fears (Kosakowski, 2008).
The two factors that drive oil prices: First factor is demand and supply, and second factor is market sentiment. As demand increases or supply decreases, the prices increase and as demand decreases or supply increases, the prices decrease. The second factor is market sentiment, which is the attitude of the market, and the feeling
it bequeaths; and concludes by defining whether the market is prevailing bullish or bearish markets (Kosakowski, 2008).
Just as the price of any other commodity, the oil prices fluctuated
over the centuries, but this drop, has been the worst since the
early 1990s (Krauss, 2016). Although, Jordan is an importer of oil, and should benefit from this down fall of oil, research has
proven otherwise, in fact, that the disadvantages weigh more than the advantages.
This paper aims to evaluate the effect of oil price falling on the Jordanian economic system. This paper will examine the following hypotheses:
H1: There is no statistical effect of gross domestic product (GDP) (at market prices) on the trade balance.
H2: There is no statistical effect of GDP (at basic prices) on the
trade balance.
H3: There is no statistical effect of current account on the trade balance.
H4: There is no statistical effect of Workers’ remittances receipts on the trade balance.
It will be used the simple regression model to evaluate the relationship between the independent variables (GDP at basic and
market prices, current account, and the workers’ remittances) and dependent variable (trade of balance). The variables during 2006 to 2015 will be examined.
2. LITERATURE REVIEW
The prices of oil have fluctuated over the centuries, but this recent drop has been the worst since the early 1990s (Krauss, 2016). While, Jordan is an importer of oil, and should be one
of those countries that benefit from this drop, research has proven otherwise, in fact, the disadvantages weigh more than the
advantages. Jordan imports 96% of its energy needs, generates
almost all of its electricity from fossil fuels (Jordan Business,
2015).
Starting 2014 up until the present, Jordan has been enjoying the positive enhancements of the economy, benefiting from the lower oil prices and their current account deficit. Yet, the volatility in
Syria adds even more burden on Jordan. The Jordanian government and the International Monetary Fund have predicted growth within the economy, but for this growth to ensue, Jordan’s reliance on external remittances and funds to decrease.
A study by the Jordan Business Magazine states that:
There is the matter, too, of Jordan’s ambitious plans to wean itself off imports of fossil fuels by developing its own shale oil reserves, investing heavily in renewables like wind and solar, and even building a nuclear power plant. As each of these projects comes online in the years ahead, world oil and gas prices will become less and less important for Jordan’s economic performance. (Jordan
Business, 2015).
Bank Audi published a Jordan Economic Report on the 16th of
March of 2016 discussing “The Dual Requirement of Fiscal Adjustment and Growth Enhancement in a Tough Regional Environment” (Barakat et al., 2016). The report identified the
factors that have posed an impact on the economy, and their reasoning. Firstly, discussing the political instability within the
region, specifically within the neighboring countries, Iraq and
Syria, the aspect that have been impacted are trade, tourism,
investor confidence with investments within the country. Stating
that although, the drop of oil prices has strengthened the domestic
demand, yet weakened the external demand (Barakat et al., 2016).
Obeidat and Al-Emam in their paper state that the plunging oil
price, which reached $35 a barrel, is good news for Jordanian
consumers and some businesses, however if prices remain low in
the coming years, this may bring a significant downside for the
Chart 1: Brent Crude oil price in US dollars per barrel (2000-2015)
Kingdom’s economy (Obeidat and Al-Emam, 2015). The paper continues by expressing its title, “The good, the bad and the
ugly effects of dwindling oil prices in Jordan.” Starting with the
good, this fall of prices has a beneficial aspect on the Jordanian
economy as it means smaller energy bill, which has always been the largest expenditure payment. The cost of energy incurred by
the Kingdom, which imports nearly 96% of its energy needs, declined during the first three quarters of this year by nearly
a half to JD1.7 billion from JD3.3 billion in the same period
of 2014, the Department of Statistics has announced recently.
Moreover, NEPCO, the National Electric Power Company,
debts are almost JD5 billion due to accumulated losses over the previous 5 years, and believes that this loss is due to the
disruption of gas supplies from Egypt. Jordanian consumers are
the biggest beneficiaries from the drop in oil prices; because
it will decrease the amount they pay for energy purchases. Furthermore, producers and industrialists rely on fuel in their
production, will benefit from lower production costs therefore
enable them to better compete in the domestic and regional
markets (Obeidat and Al-Emam, 2015).
On the other hand, a contrasting view states that the downfall of the oil prices could impact the government’s domestic revenues as
fuel products carry a tax rate of nearly 40%. State revenues from fuel products dropped by JD150 million this year. Therefore to
minimize the impact on the revenue, these have different views on what should be done. It was suggested that instead of imposing a
tax on fuel products, the government could charge a fixed amount
per unit of fuel to make up for the drop in revenues. Moreover,
the economic growth target for next year, put a 3.7%, might not
be achieved due to shocks from low oil prices that could affect government revenues and may affect remittances of Jordanian
expatriates (Obeidat and Al-Emam, 2015).
The bad effects of the downfall of the oil prices on Jordan include the Saudi Arabia, the world’s largest oil producer and exporter,
could see financing strains due to lower revenues if the downtrend
in oil prices continues for the coming 2-3 years. The construction sector in the Gulf kingdom is likely to witness a severe slowdown because the government might get pushes to suspend projects there. There are many Jordanian employees that work in private construction companies in Saudi Arabia, due to the losses they are
suffering, the construction firms are said to lay off some of their employees or cut their salaries (Obeidat and Al-Emam, 2015).
Mazen Irsheid, an oil and energy expert, said that such an effect on Saudi Arabia and other Gulf countries can be seen if the current low prices stay the same or further drop for 4-6 years to come, a
matter he said is “unlikely,” he continues by adding that the Saudi sovereign wealth fund contains $700 billion, $75 billion of which
was spent since June this year, kicking off a depletion process of Saudi reserves. Irsheid criticizes the spending of Saudi Arabia, and cites International Monetary Fund expectations for the funds reserves to run out completely in 6 years’ time in light of current spending patterns. Due to the reason that oil revenue estimates
90% of Saudi Arabia’s income, Irsheid expects layoffs of guest
workers, including Jordanians, to occur in 3 years if oil prices
remain around $40 a barrel.
As mentioned, Jordan should consider alternatives of renewable
energy forms, and develop strong ambition to fulfill strategic
projects that could take time to establish, but once they start working, will be providing a substitute for oil, therefore, making Jordan an energy independent country.
However, a study by Masood Ahmed, the International Monetary Fund Director of the Middle East and Central Asia Department states that:
As you look at the impact on the budget of lower oil prices, it turns out to be more or less neutral. It’s not a big positive impact on the budget. And why is that? Well, on the one hand, there are some savings to the government from transportation and cash transfers to the population, which they are only made when oil prices are above a hundred dollars, but on the other side, they lose from some of the revenues that they get by taxing energy
products (JT, 2015).
Jordan, as an oil importing but labor exporting small open economy
which receives large inflows of external income (remittances, grants, and foreign direct investment) from oil rich countries,
and examines the importance of external income shocks (mainly
arising from oil price disturbances) in the growth dynamics of the country (Mohaddes and Raissi, 2011).
On the 9th of November, the Minister of Finance, said that
low oil prices have reduced NEPCO’s financial losses from JD1.3 billion in 2014 to JD250 million this year. Recently, the Jordanian government has been relying greatly on liquefied
natural gas for power generation; therefore it is believed that
NEPCO will reach cost break-even with no financial losses during the year 2016. Although, NEPCO blames their losses
for the extending of the country’s debt, the rising of the debt is
due to the company’s financial troubles and not the government
spending. In addition, there are considerations to exit both the electricity and water sectors to get rid of the subsidies
(Obeidat, 2015).
Until 2010, NEPCO had a balanced budget and financial status,
it was importing gas from Egypt at a below market price. After a sequence of natural gas pipeline attacks in Egypt, the import had to cease, forcing Jordan to look at alternatives which has resulted in the company’s large losses. In aiding to reduce this loss, the government has posed strategies, which include tariff
increases; a diversification of energy sources, and measures to enhance efficiency. Hence, prior to the drop in oil prices, NEPCO’s
losses to begin to decrease, now that the oil prices have dropped
significantly, the company is flourishing as it senses stability of decreasing its debt (Husain et al., 2015).
In mid of 2015, Jordan’s external debt reached JD 9390.5 million, which is 35.3% of the GDP. After 2008, the external debt kept increasing, from JD 3640.2 million in 2008, to JD 9390.5 million in 2015. In 2013, the large entry of the Syrian refugees into Jordan
has played a big role in limiting all resources within the country
Then followed the beginning of the drop in oil prices in 2014,
which reduced the foreign aid provided by the Gulf countries,
specifically Saudi Arabia. Saudi Arabia’s economy is suffering on
its own, due to their dependence on oil revenues, and is currently looking to diversify its revenue sources. Therefore, its ability to distribute funds as aid has been reduced. Jordan had always relied on the funds provided; consequently, when those funds decreased
dramatically, external public debt became an option to fill in the financial shortage gap.
3. METHODOLOGY AND FINDINGS
In this section, the methodology will test the data to endorse the study objective. It covers the data, in addition to the data analysis, and the methodology used within this paper.
3.1. Regression
In order to examine the effect of the drop of oil prices on the Jordanian economy, the run regression model with panel data was used to investigate impact throughout the years.
3.2 Data Sources
For the collection of data for this paper, the statistics were collected from the Central Bank of Jordan, using the annual reports from
the years 2006 to 2015.
3.3. Dependent Variable 3.3.1. Trade balance
The balance of trade of an economy indicates the gap between the country’s imports and its exports. Which is the goods and services exported minus imports. Therefore, under this title; the imports and exports will be analyzed.
3.4. Independent Variables 3.4.1. GDP
The Organization for Economic Co-operation and Development
(OECD) defines GDP as:
An aggregate measure of production equal to the sum of the gross values added of all resident institutional units engaged in production (plus any taxes, and minus any subsidies, on products
not included in the value of their outputs). The sum of the final uses of goods and services (all uses except intermediate consumption)
measured in purchaser’s prices, less the value of imports of goods and services, or the sum of primary incomes distributed by resident
producer units (OECD, 2001).
The Jordanian GDP growth rate as reported by the Central Bank
of Jordan, has been volatile. The first drop was just before 2008
had begun, visibly, due to the global economic instability. Then seemed like it had recovered and begun increasing until another
severe drop in 2010. Which is explicable due to the Great Recession, which was a period of severe global economic decline. Thenceforth, Jordan seemed to avoid harsh fluctuations up until January of 2015 (3.3%) when the GDP growth rate dropped to 2% right after (Trading Economics, 2016b). The Jordanian economy is led by tourism, financial services, transportation, manufacturing
and remittances. Due to the reasons that Jordan is a scarce water
country, and the absence of arable land; the agricultural sector is minimal. In addition, to the regional instability, which has affected the tourism, therefore reducing one of the biggest revenue benefactors.
The population in Jordan increased significantly due to the large influx of refugees from problematic situations in neighboring
countries. In addition to the industrial development; and investments in search of alternative energy sources, the growing
economy also led to an increase of demand of power, by 5.5%-6.5% (Abdul Rahim, 2015).
3.4.1.1. GDP at market prices
GDP at market prices is used as it reflects “the production activity
of resident producer units. It is equal to the economy’s total output of goods and services at market prices, plus taxes minus subsidies
on imports.” (Eurostat, 2015) This indicator is important, as Jordan pays subsidies on its oil imports. As of November 2012, subsidies on petroleum products were cut drastically (from 5.8% of GDP in 2006) to 2.8% of GDP, and this program has continued till the present (Atamanov et al., 2015).
3.4.1.2. GDP at basic prices
The concept of GDP at basic prices also differs from GDP at market prices, but in this case the difference concerns the taxes and subsidies on the products themselves, such as sales taxes, fuel taxes, duties and taxes on imports, excise taxes on tobacco and alcohol products and subsidies paid on agricultural commodities,
transportation services and energy (Canada and Canada, 2015).
GDP at basic prices omits taxes and subsidies on imported products; GDP at market prices includes taxes net of subsidies.
3.4.2. Current account
Calculated by adding balance of trade, net income from abroad and net current transfers. In Jordan, the Central Bank of Jordan reports the current account data. This factor determines the level of international competitiveness of Jordan. Due to the fact that Jordan is a vastly importing country, it is reasonable that its records
demonstrate a current account deficit.
3.4.3. Workers’ remittances receipts
Remittances are the sum of money that is transferred by a foreign
worker back in their home country. This is in addition to the
financial aid provided by volunteering countries, complement each other by providing the major financial inflows to developing
countries. One of Jordan’s major exports is skilled labor, mainly
working in the Gulf countries. Remittances reached over.
Remittances, in addition to the financial aid provided by
volunteering countries, complement each other by providing the major financial inflows to developing countries. One of Jordan’s major exports is skilled labor, mainly working in the Gulf countries. However, although those countries are considered wealthy countries, after the drop of oil prices had begun, the market activity decreased due to the lack of funds within the
countries. Therefore, due to unfortunate market activities and the revenue shocks in these countries, particularly Saudi Arabia. The response is to layoff employees, minimize salaries and wages, and look at alternatives to diversify their revenue sources. The
first two options affect the remittances. Rationally, if a Jordanian
employee is laid off, or their salary had cut, the remittances will
decrease. Remittances reached over $3.66 billion (JD 2.6 billion) last year, which is equivalent to 10% of Jordan’s GDP (Obeidat and Al-Emam, 2015).
3.5. Data Analysis
To further test the indicators, regression analysis was run to test whether or not there was a statistical effect of the independent variable on the dependent variable. It is used to further examine the relationship between two variables. Hence, regression analysis has been used as the tool to retrieve the results.
3.6. Findings
After studying the variances in value in the indicators reviewed, regression analysis model was used as a tool to test the variables, to
whether or not there is a relationship and the level of significance.
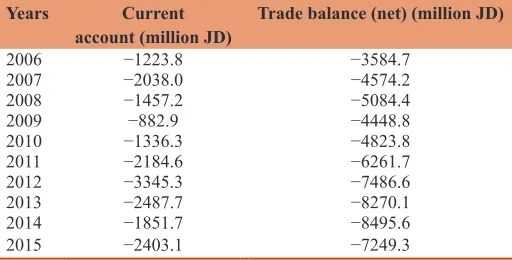
The data used was collected from the Central Bank of Jordan statistical database, and are provided in the following Tables 1-3.
3.6.1. Hypothesis 1: There is no statistical effect of GDP (at market prices) on the trade balance (Table 4-7)
In the first test that has been run, the simple linear regression has been used to test the hypothesis above. It is found that r = 0.907 is significant at 0.05 level, thus there is a high and negative
relationship between the two variables. In addition, it is also
found that t = −6.088 is significant at 0.05 level, and therefore
this indicates that there is a statistical effect of GDP (at market
prices) on the Trade Balance.
3.6.2. Hypothesis 2: There is no statistical effect of GDP (at basic prices) on the trade balance (Tables 8-11)
The second test that has been run to test the second hypothesis,
that there is no statistical effect of GDP (at basic prices) on
the trade balance, was resulted with the following. After the simple linear regression has been used to test the hypothesis,
it has been found that r = 0.907 is significant at 0.05 levels
thus there is a high and negative relationship between the two
variables. Moreover, it has also been found that t = −6.078 which is significant at 0.05 level, which hence means that there is a statistical effect of GDP (at basic prices) on the
trade balance.
3.6.3. Hypothesis 3: There is no statistical effect of current account on the trade balance (Tables 12-16)
The third test was run to test the third hypothesis, which is that there is no statistical effect of current account on the trade balance. Simple linear regression was used to test the hypothesis, it is found
that r = 0.707 is significant at 0.05 level, thus there is a high and
positive relationship between the two variables. Correspondently,
it is found that t = 2.825 which is significant at 0.05 level, which
means that there is a statistical effect of current account on the trade balance.
3.6.4. Hypothesis 4: There is no statistical effect of workers’ remittances receipts on the trade balance (Tables 17-21)
Simple linear regression is used to test the fourth hypothesis, which is that there is no statistical effect of workers’ remittances
Table 1: 2006-2015: GDP (at market prices) and GDP (basic prices)
Years GDP (at market prices) GDP (basic prices)
2006 10675.369 9362.783
2007 12131.423 10805.128
2008 15593.411 13971.201
2009 16912.209 15044.51
2010 18762.02 16417.19
2011 20476.59 17987.656
2012 21964.5 19298.2
2013 23851.6 20981.4
2014 25437.1 22365.9
2015 26637.4 23475.7
GDP: Gross domestic product
Table 2: 2006-2015: Current account and net trade balance
Years Current
account (million JD) Trade balance (net) (million JD)
2006 −1223.8 −3584.7
2007 −2038.0 −4574.2
2008 −1457.2 −5084.4
2009 −882.9 −4448.8
2010 −1336.3 −4823.8
2011 −2184.6 −6261.7
2012 −3345.3 −7486.6
2013 −2487.7 −8270.1
2014 −1851.7 −8495.6
2015 −2403.1 −7249.3
Table 3: 2006-2015: Workers’ remittances receipts
Years Workers’ remittances receipts (million JD)
2006 1782.7
2007 2122.5
2008 2242.
2009 2214.2
2010 2247.3
2011 2152.1
2012 2229.8
2013 2327.7
2014 2388.
2015 2423.3
Table 4: GDP (at market prices) and trade balance: variables
Variables entered/removedb
Model Variables entered Variables removed Method
1 GDP (at market prices) Enter
aAll requested variables entered. bDependent variable: Trade balance (net) (Million JD). GDP: Gross domestic product
Table 5: GDP (at market prices) and trade balance: model summary
Model summary
Model R R2 Adjusted R2 Standard error of the estimate
1 0.907a 0.822 0.800 784.1578
receipts on the trade balance. It is found however that r = 0.733 is significant at 0.05 level, thus there is a high and negative
relationship between the two variables. Additionally, it is found
that t = −3.048 which is significant at 0.05 level, which means
that there is a statistical effect of workers’ remittances receipts on the trade balance.
4. CONCLUSION
As Jordan is an oil importing country, it should be benefiting from
the drop in oil prices, however, research has proven otherwise. In fact, the disadvantages weigh more than the advantages. The research was conducted to evaluate the fall in oil prices effect on the Jordanian economy. Data analysis was used to test variables, and a regression analysis was run to test the relationship between them.
The International Monetary Fund in April 2015 published a
consultation stating that Jordan even through the instability that
the region had been going through due conflicts in neighboring
countries, Syria and Iraq. As the industrial and mining sectors
revive exports within the country in 2014.
In search of further alternatives to diversity the energy mix,
Jordan has held numerous contracts for liquefied natural gas, and
is currently exploring nuclear power generation, exploitation of abundant oil shale reserves and renewable technologies. The drop of oil prices are believed to help Jordan enhance its economic
consolidation by neutralizing the deficit in gas supplies, in addition
to reducing the import bill and NEPCO’s debt.
The benefits of this drop include, slimmer energy bills, which rank
as the heaviest burden on the Jordanian economy. Since Jordan had starting importing from Saudi Arabia, the cost of importing had increased; therefore, this drop of price has compensated
the importing costs. In addition to NEPCO’s debt significant
decrease. Production and the Jordanian industries will enjoy lower production costs therefore increasing their competition not only domestically, but also in regional markets.
However, the shortcomings of oil prices fall include the need for
the diversification of Jordan’s energy mix, to offset the impact.
Leading Jordan into developing energy from renewable sources such as, nuclear power, solar energy, and utilizing its mountainous topography with wind farms.
Jordan’s economic growth target for 2016 was set to be 3.7%,
which may not be achieved due to the shock, which leads to the decrease of the government revenues. As a result of the effect
that may be caused by the decrease of remittances and financial
aid. Finally, the construction sector will face a slowdown in the
gulf, therefore may lead to appending projects; which influences
the revenues of the gulf, hence the remittances and foreign aid.
The four variables that were used in the methodology to test the relationship, and whether or not they pose impacts on one another, were; GDP at market and basic prices, current account, and the workers’ remittances receipts as independent variables,
Table 6: GDP (at market prices) and trade balance: ANOVA
ANOVAb
Model Sum of squares df Mean square F Significant
1
Regression 22788138.097 1 22788138.097 37.060 0.000a
Residual 4919227.919 8 614903.490
Total 27707366.016 9
aPredictors: (Constant), GDP (at market prices). bDependent variable: Trade balance (net) (million JD). GDP: Gross domestic product
Table 7: GDP (at market prices) and trade balance: coefficients Coefficientsa
Model Unstandardized coefficients Standardized
coefficients t Significant
B Standard error Beta
1
(Constant) −397.111 957.616 −0.415 0.689
GDP (at market prices) −0.293 0.048 −0.907 −6.088 0.000
aDependent variable: Trade balance (net) (million JD). GDP: Gross domestic product
Table 8: GDP (at basic prices) and trade balance: variables
Variables entered/removedb
Model Variables entered Variables removed Method
1 GDP (at basic prices) 0.0 Enter
aAll requested variables entered. bDependent variable: Trade balance (net) (million JD). GDP: Gross domestic product
Table 9: GDP (at basic prices) and trade balance: model summary
Model summary
Model R R2 Adjusted R2 Standard error of the estimate
1 0.907a 0.822 0.800 785.1883
aPredictors: (Constant), GDP (basic prices). GDP: Gross domestic product
Table 10: GDP (at basic prices) and trade balance: ANOVA
ANOVAb
Model Sum of squares df Mean square F Significant
1
Regression 22775201.104 1 22775201.104 36.942 0.000a
Residual 4932164.912 8 616520.614
Total 27707366.016 9
aPredictors: (Constant), GDP (basic prices), bDependent variable: Trade
Table 11: GDP (at basic prices) and trade balance: coefficients Coefficientsa
Model Unstandardized coefficients Standardized
coefficients t Significant
B Standard error Beta
1
(Constant) −341.614 967.951 −0.353 0.733
GDP (basic prices) −0.335 0.055 −0.907 −6.078 0.000
aDependent variable: Trade balance (net) (million JD). GDP: Gross domestic product
Table 12: Current account and trade balance: variables
Variables entered/removedb Model Variables entered Variables
removed Method
1 Current account (million JD) 0.0 Enter
aAll requested variables entered. bDependent Variable: Trade balance (net) (million JD). GDP: Gross domestic product
Table 13: Current account and trade balance: model summary
Model summary
Model R R2 Adjusted R2 Standard error of the estimate
1 0.707a 0.499 0.437 1316.7403
aPredictors: (Constant), current account (million JD)
Table 14: Current account and trade balance: ANOVA
ANOVAb
Model Sum of
squares df Mean square F Significant 1
Regression 13836924.991 1 13836924.991 7.981 0.022a
Residual 13870441.025 8 1733805.128
Total 27707366.016 9
aPredictors: (Constant), current account (million JD). bDependent variable: Trade
balance (net) (million JD)
Table 15: Current account and trade balance:
unstandardized coefficients Coefficientsa
Model Unstandardized coefficients
B Standard error 1
(Constant) −2763.153 1228.391
Current account (million JD) 1.699 0.602
Table 16: Current Account and trade balance:
standardized coefficients
Coefficientsa
Model Standardized
coefficients t Significant
Beta 1
(Constant) −2.249 0.055
Current
account (million JD) 0.707 2.825 0.022
aDependent variable: Trade balance (net) (million JD)
Table 17: Workers’ remittances receipts and trade balance: variables
Variables entered/removedb
Model Variables entered Variables removed Method 1 Workers’ remittances
receipts (million JD) 0.0 Enter
aAll requested variables entered. bDependent variable: Trade balance (net) (million JD)
Table 18: Workers’ remittances receipts and trade balance: model summary
Model summary
Model R R2 Adjusted R2 Standard error of the estimate
1 0.733a 0.537 0.480 1265.8226
aPredictors: (Constant), workers’ remittances receipts (million JD)
Table 19: Workers’ remittances receipts and trade balance: ANOVA
ANOVAb
Model Sum of
squares df Mean square F Significant 1
Regression 14888910.274 1 14888910.274 9.292 0.016a
Residual 12818455.742 8 1602306.968
Total 27707366.016 9
aPredictors: (Constant), workers’ remittances receipts (million JD). bDependent variable:
Trade balance (net) (million JD)
Table 20: Workers’ remittances receipts and trade
balance: unstandardized coefficients Coefficientsa
Model Unstandardized coefficients
B Standard error
1
(Constant) 9901.051 5240.824
Workers’ remittances
receipts (million JD) −7.198 2.361
Table 21: Workers’ remittances receipts and trade
balance: standardized coefficients Coefficientsa
Model Standardized
coefficients t Significant
Beta 1
(Constant) 1.889 0.096
Workers’ remittances
receipts (million JD) −0.733 −3.048 0.016
and trade balance as the dependent variable. After running the regression analysis, the results were that there is a high and negative relationship between trade balance and GDP at market prices, GDP at basic prices, and workers’ remittances receipts. Whereas, a high but positive relationship between trade balance and the current account.
Thus, it is important for Jordan to continue to diversify its’ energy
mix. Therefore, reducing the impact of the oil price fluctuations
on its economy. Noting that Jordan is a heavy imported of oil. Therefore, leading Jordan into developing energy from renewable sources such as, nuclear power, solar energy, and utilizing its mountainous topography with wind farms. Which will reduce its reliance on importing oil, therefore, reduce the impact of the
price fluctuations.
REFERENCES
Abdul Rahim, N. (2015), The Energy Sector in Jordan. Beirut - Lebanon:
Brussels Invest & Export Embassy of Belgium.
APPEA. (2016), What is Oil? Available from: http://www.appea.com.au/ oil-gas-explained/oil-and-gas/what-is-oil.
Atamanov, A., Jellema, J., Serajuddin, U. (2015), Energy Subsidies Reform in Jordan Welfare Implications of Different Scenarios. Available from: http://www.documents.worldbank.org/curated/ en/595761467998814982/pdf/WPS7313.pdf.
Barakat, M.S., Sheikh, F.A., Kanjwal, M.A., Chaudhari, A.A., Jung, I.H.,
Lee, J.H. (2016), Jordan Economic Report. Available from: http://www.bankaudigroup.com/GroupWebsite/openAudiFile. aspx?id=2957.
Canada, G., Canada, S. (2015), Gross Domestic Product (GDP): Frequently Asked Questions. Available from: http://www.statcan. gc.ca/eng/nea/faq/gdp.
Danzuraidi, D. (2016), Oil Price Drop. Available from: https://www. dandanzuraidi.wordpress.com/2016/01/26/oil-price-drop.
Eurostat. (2015), In: Glossary: Gross Domestic Product (GDP) at Market Prices. Eurostat. Available from: http://www.ec.europa.eu/eurostat/ statistics-explained/index.php/Glossary: Gross_domestic_product_ (GDP)_at_market_prices.
Husain, A.M., Arezki, R., Breuer, P., Haksar, V., Helbling, T., Medas, P.,
Sommer, M., Staff Team, I.M.F. (2015), Global Implications of Lower Oil Prices. Available from: https://www.imf.org/external/ pubs/ft/sdn/2015/sdn1515.pdf.
Jordan Business. (2015), Oil Slide Fires up Jordanian Economy-for Now. Available from: http://www.jordanbusinessmagazine.com/economy/ oil-slide-fires-jordanian-economy-now.
JT. (2015), Available from: http://www.Jordantimes.Com/news/local/
impact-lower-oil-prices-jordan-neutral’-—-imf. Available from:
http://www.jordantimes.com/news/local/impact-lower-oil-prices-jordan-neutral’-imf.
Kosakowski, P. (2008), What Determines Oil Prices? Available from:
http://www.investopedia.com/articles/economics/08/determining-oil-prices.asp.
Krauss, C. (2016), Oil Prices: What’s Behind the Drop? Simple Economics. Available from: http://www.nytimes.com/interactive/2016/business/ energy-environment/oil-prices.html?_r=0.
Mohaddes, K., Raissi, M. (2011), Oil Prices, External Income, and Growth: Lessons from Jordan. Available from: https://www.imf.org/ external/pubs/ft/wp/2011/wp11291.pdf.
OECD. (2001). Available from: http://www.oecd.org.
Obeidat, O. (2015), No Rise in Electricity Tariffs Next Year. Available from:
http://www.jordantimes.com/news/local/no-rise-electricity-tariffs-next-year.
Obeidat, O., Al-Emam, D. (2015), The Good, the Bad and the Ugly Effects of Dwindling Oil Prices on Jordan. Available from: http://www.
jordantimes.com/news/local/good-bad-and-ugly-effects-dwindling-oil-prices-jordan.
OPEC. (2016), OPEC: Brief history. Available from: http://www.opec. org/opec_web/en/about_us/24.htm.
Trading Economics. (2016a), Jordan External Public Debt 1988-2016 Data
Chart Calendar. Available from: http://www.tradingeconomics.com/ jordan/external-debt. [Last accessed on 2016 Jul 15].
Trading Economics. (2016b), Jordan GDP 1965-2016 Data Chart Calendar
Forecast News. Available from: http://www.tradingeconomics.com/ jordan/gdp.
U.S Energy and Information Administration (EIA). (2013), Available from: https://www.eia.gov.
Vidal, J. (2008), Canadians Ponder Cost of Rush for Dirty Oil. Available from: https://www.theguardian.com/environment/2008/jul/11/
fossilfuels.pollution.