Issues
ISSN: 2146-4138
available at http: www.econjournals.com
International Journal of Economics and Financial Issues, 2015, 5(4), 968-978.
The Effect of Macroeconomic Variables on the Capital Structure
Decisions of Indian Firms: A Vector Error Correction Model/
Vector Autoregressive Approach
Sakshi Khanna
1, Amit Srivastava
2*, Yajulu Medury
31Department of Humanities and Social Sciences, Jaypee University of Information Technology, Waknaghat, Solan, Himachal
Pradesh, India, 2Department of Humanities and Social Sciences, Jaypee University of Information Technology, Waknaghat, Solan,
Himachal Pradesh, India, 3Bennett Coleman and Co. Ltd., New Delhi, India. *Email: [email protected]
ABSTRACT
This paper sheds light on how the macroeconomic variables affect the capital structure decisions in context to the equity market timing theory, for the
firms of an emerging economy - India. The analysis is done through analytical and causal research design using vector error correction model/vector autoregressive model. Further, the effect is also analyzed when the firms are categorized into the varied sectors of economy - Primary, secondary and tertiary. The period for the study is from the year 1992 to 2013. The results show that changes in macroeconomic environment cause changes in the firm’s choice of finance both in long-run as well as in short-run. The analysis shows that for primary sector firms, leverage is pro-cyclical; secondary sector firms imply a counter-cyclical leverage and for tertiary sector firms equity is pro-cyclical. Therefore, the managers must identify the windows of opportunity depending upon the sector to which the firms belong to.
Keywords: Capital Structure Decisions, Equity Market Timing Theory, Vector Error Correction Model/Vector Autoregressive Model,
Macroeconomic Variables
JEL Classifications: E00, G3, G10, G30, G32
1. INTRODUCTION
The capital structure of a firm is defined as the permanent financing represented by long-term debt, preferred stock and shareholder equity (Copeland and Weston, 1993). These sources of finance have different levels of risks associated with them and it is important for the managers to be aware of these risks, so that they can determine which source best suits the firms’ needs and increases the value of the firm. The capital structure that maximizes the value of a firm is considered as an optimal one. An optimal capital structure not only imparts higher returns to its shareholders, but also improves the competency of a firm. Therefore, in order to improve the performance of a firm, it is imperative for the firm to know how to obtain the financing.
Financing policy plays a significant role in achieving strong economic fundamentals for the firms in the long-run. The choice
whether to go for debt or equity is impacted by several factors: Firm specific factors such as profitability, asset tangibility, etc. (Bhayani, 2005; Pathak, 2010; Alom, 2013, etc.); external macroeconomic variables like inflation, gross domestic product, etc. (Booth et al., 2001; Bokpin, 2009; Muthama et al., 2013) and both firm specific as well as external macroeconomic variables (Korajczyk and Levy, 2001; Gajurel, 2006; Joeveer, 2006; Bas et al., 2009; Çekrezi, 2013, etc.). It is substantial for the firms to interpret these factors and how they impact the decisions of capital structure choice.
rates, etc. (Bougatef and Chichti, 2010; Chen et al., 2013). Therefore, the market timing theory proficiently explains the effect of market conditions on the capital structure decisions of the firms.
In this financially integrated world of today, no firm remains unaffected by what happens in the economy, so the better the management of a firm understands the dynamics of macroeconomic factors on capital structure, the more efficient they will be in their decision making process. So, by knowing the causal effect of the macroeconomic variables on the choice of capital structure, the management can mitigate the impact of the unexpected fluctuations in the economy and could even take advantage of them.
The present paper intends to study the capital structure decisions of Indian firms. The reason for selecting Indian market is two-fold, first - Indian economy is one of the fastest growing economies in the world and second - India has recently emerged as a global player and has invited business from across the world to invest in them (Fernando, 2009). So, in order to make their presence felt in the global arena, Indian firms need to gear themselves for global competition and for this purpose, effective sourcing of funds is very crucial. Therefore, this paper provides new evidence of the effect the macroeconomic variables have on the capital structure decisions of Indian firms, through analytical and causal research design using the vector error correction model (VECM)/vector autoregressive model (VAR), in context to the equity market timing theory. The macroeconomic variables taken in the study are India’s gross domestic product (GDP), wholesale price index as a proxy of inflation (WPI) and the stock market indicator - Bombay Stock Exchange (BSE) Sensitive Index (BSE). Further, the cause and effect relationship is also analyzed when the firms are categorized into the three sectors of the economy; namely, primary, secondary and tertiary.
The rest of this paper is structured as follows: The second section concentrates on the three primary theories of capital structure; the third section is on the relevant literature discussing the effects of the various macroeconomic variables on capital structure of firms. The fourth section focuses on the methodology-providing the definitions of the variables used and discussing the basic model used in the paper. The fifth and the sixth section present the data analysis and results and the discussion respectively. The last section concludes the main findings of the paper, brings out the implications of the results, presents the limitations of the present study and discusses the scope for future research.
2. IMPORTANT THEORIES OF CAPITAL
STRUCTURE
The three most important theories of capital structure are: Trade-off, pecking order and market timing. Let us have a look at what these theories have to articulate regarding the effect of the macroeconomic variables on the capital structure choice of firms: • Trade-off theory (Kraus and Litzenberger, 1973) states that
the debt is taken up to the level at which the tax benefits of debt are balanced against the bankruptcy costs. This theory implies that leverage is pro-cyclical (positively correlated with the economy). During expansions, the market is performing
well and the expected bankruptcy costs are lower, thus, the firms have more free cash i.e. more taxable income to shield. Therefore, in such cases, debt would be more attractive for unconstrained firms (Jensen and Meckling, 1976; Gertler and Hubbard, 1993; Zwiebel, 1996).
• Pecking order theory (Myers and Majluf, 1984) implies that the firms, finance their investments first with retained earnings, then with debt, and finally, with equity. According to this theory, leverage is counter-cyclical (negatively correlated) for financially unconstrained firms because these firms have more internal funds during expansions and they tend to use them (Korajczyk and Levy, 2001).
• Market timing theory (Baker and Wurgler, 2002) states that depending upon which market looks more favorable - debt (when treasury bill rates are low; known as debt market timing) or equity (when market to book ratio is high; known as equity market timing), managers will use that source of financing. If neither market looks favorable, then fund raising may be deferred and if current conditions look unusually favorable, the funds may be raised even if they are not currently required (Frank and Goyal, 2009). The market timing theory emphasizes on the mangers’ ability to time the market in order to raise capital cheaply.
It has been found from the literature that the market timing theory is the superior one (Huang and Ritter, 2009; Bougatef and Chichti, 2010; Khanna et al., 2014). Even Weigl and Wittenberg (2011) claims that 80% of the most significant debt factors (both firm as well as macroeconomic factors) influencing the capital structure of firms (US firms) is explained by the essence of the market timing theory. Further, in the survey done by Graham and Harvey (2001), the CFOs have admitted that they try to time the equity market and that the market timing plays an important role in their financing decisions. The study by Khanna et al. (2013) also concludes that the firms significantly time the market and at the same time strengthen their firm level characteristics.
Thus, this paper concentrates on the effect of macroeconomic variables on the capital structure decisions of Indian firms in context to equity market timing theory.
3. REVIEW OF LITERATURE
A number of studies have been done to explain the debt-equity choice of a firm’s capital structure. Some of them give consideration only to firm level characteristics and have ignored macroeconomic factors (Elliott et al., 2007; Elliott et al., 2008; Huang and Ritter, 2009) while others have shown that the country’s institutional and the macroeconomic environment plays an important role in the capital structure decisions (Choe et al., 1993; Rajan and Zingales, 1995; Deesomsak et al., 2004; Bancel and Mittoo, 2004, etc.).
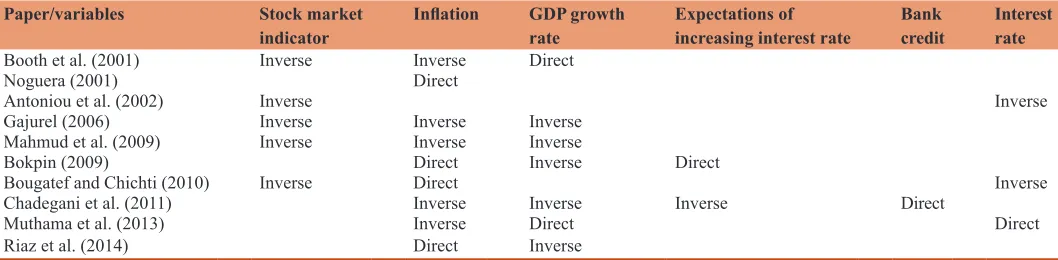
A number of macroeconomic factors have been identified that determine the capital structure of firms and are presented in the Table 1, along with a summary of the empirical results of the previous studies.
important role in the determination of capital structure decisions of firms (Table 1). However, it has been found that neither the theoretical predictions nor the empirical results are uniform and none of the above studies deals with the cause and effect relationship of macroeconomic variables on the capital structure of firms.
In this paper, the causal effect of macroeconomic conditions on the firm’s capital structure decisions is studied by the following set of macroeconomic variables. The variable selection is based on the capital structure literature.
3.1. Economic Growth
From the literature, the conclusion drawn was that a country’s economic growth influences the firms’ capital structure decisions. At the firm level, economic growth is believed to be correlated with the firm’s growth and is a proxy for the firm’s investment opportunity set and its financing needs (Smith and Watts, 1992; Demirgüç-Kunt and Maksimovic, 1998; Beck et al., 2002; Wanzenried, 2006). As the economy grows, a decline is seen in expected bankruptcy cost and an increase in the collateral values of assets, in stock prices and in free cash flow (Lemma and Negash, 2013), which affects the firm’s growth and its financing needs. With an improvement in a country’s economy, the firms are more likely to have easily available external funds in order to meet their additional financing needs. So, here according to the equity market timing theory, the economic growth is expected to be positively correlated with net equity (Korajczyk et al., 1992; Choe et al., 1993) and negatively with leverage as well as with retained earnings.
A number of indicators may represent a country’s economic growth, but the growth in GDP is a barometer of economic activities. The authors like Booth et al. (2001), Chadegani et al. (2011), Lemma and Negash (2013), etc. have supported the use of GDP for studying the effect of economic growth on the capital structure of firms. The present study uses India’s GDP as a proxy of the economic growth and expects the same relation as discussed above.
3.2. Inflation
Another important economic factor which influences the management’s decisions about firm’s financing is the inflation rate of a nation. With the rise in the price level of different commodities,
the overall costs of firms’ raw materials and other facilities like fuel and energy, transportation etc. also rises and so does the capital requirement of the firms.
According to market timing theory, the firm issue debt when the interest on the debt is low as compared to past and future expected interest rate. In general prediction about the future interest rate depends upon the inflationary trend in economy. So, when the firm expects that in future, the inflation rate will be higher or they realize that the current rate of inflation is low, the firms issue debt securities (Frank and Goyal, 2009). This shows that market timing theory suggests positive relationship between inflation and debt if it is expected that future inflation will be more.
In India, WPI and Consumer Price Index (CPI) are the two primary measures of inflation. Until 2011, there was no single CPI representative of the whole country, so WPI has been the main measure of inflation. This paper uses WPI as the proxy for inflation and expects a direct relation with leverage (Noguera, 2001; Bougatef and Chichti, 2010; Riaz et al., 2014).
3.3. Stock Market Indicator
A stock market reveals information about the listed firms to the market and affects their choice of financing. The stock market provides essential information about the listed firms and helps creditors make lending to listed firms less risky (Grossman, 1976; Grossman and Stiglitz, 1980). Well-developed stock markets provide liquidity, diversification, and information acquisition, resource mobilization for corporate finance, investment and growth opportunities. An active and liquid stock market makes it easy and relatively cheaper for firms to finance their operations through equity capital. Firms may therefore substitute long-term debt with equity and this would certainly affect their capital structure (Doku et al., 2011). Since, the sample consists of the firms listed on the BSE, so BSE Sensitive Index (BSE) is used as an indicator and a direct relation is expected with net equity.
Another factor, which cannot be ignored, is the relationship between the sector (to which a firm belongs) and its capital structure (Remmers et al., 1974; Harris and Raviv, 1991). The firms’ capital structure is systematically different across the sectors because of differences in external funds requirements based on technology differences that play a leading role in determining the variation in the capital structure (Das and Roy, Table 1: Review of selected papers
Paper/variables Stock market
indicator Inflation GDP growth rate Expectations of increasing interest rate Bank credit Interest rate
Booth et al. (2001) Inverse Inverse Direct
Noguera (2001) Direct
Antoniou et al. (2002) Inverse Inverse
Gajurel (2006) Inverse Inverse Inverse
Mahmud et al. (2009) Inverse Inverse Inverse
Bokpin (2009) Direct Inverse Direct
Bougatef and Chichti (2010) Inverse Direct Inverse
Chadegani et al. (2011) Inverse Inverse Inverse Direct
Muthama et al. (2013) Inverse Direct Direct
2007). The work done by Ramli and Nartea (2013) clearly brings out the inter-sectoral difference in capital structure choice of the firms in Indonesia. They found that the firms in primary sector preferred leverage; secondary sector firms preferred both debt as well as equity (economic growth and interest rate having a direct relation and inflation an indirect relation with leverage). In case of tertiary sector firms, it was found that profitability, stock and bond market development are all negatively correlated with leverage.
The examination of the different sectors for the choice of capital structure is important because the firms belonging to different sectors might have different strategies of capital choice to generate more profit. It is found that comparatively less work has been done on the inter-sectoral variation in the capital structure choice of the firms. Therefore, it will be meaningful to analyze the variation in the capital structure decisions of the firms, when they are categorized into the three classes of the economy.
From the existing literature, the authors find that no work has been done so far which explains the cause and effect relationship of the macroeconomic variables on the capital structure choice of the firms in context to equity market timing (using the VECM/ VAR procedure); moreover as per authors’ knowledge, there is no study which explores the causal effect when the firms are classified into the three sectors of the economy-primary, secondary and tertiary. Most the studies done in this area as mentioned in Table 1, use simple ordinary least squares regression model, do not test for stationarity of the series (Mahmud et al., 2009; Bougatef and Chichti, 2010, etc.) or assume that the series are stationary (Gajurel, 2006; Muthama et al., 2013, etc.). If a time series is not stationary then its behavior can only be studied for the time period under consideration and could not be generalized to other periods (Gujarati, 2011). Therefore, to address these research gaps, this paper studies the cause and effect relationship of macroeconomic variables on the capital structure decisions of Indian firms.
4. METHODOLOGY
This study primarily analyzes the effect of macroeconomic variables viz., GDP, WPI and BSE Sensitivity Index on the capital structure decisions of Indian firms using a VECM/VAR method. This method is a way to guard against spurious regression by establishing linear combinations among the vector of variables, all which are stationary in nature.
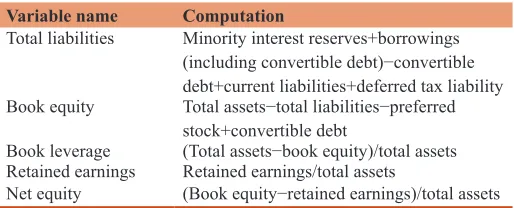
Table 2 shows the variables used and how they are computed using the definition of variables from COMPUSTAT.
The sample consists of annual (audited) data of the firms listed on the BSE and the period of the study is from the financial year 1992 to 2013. The raw data of the firms are taken from the database CMIE PROWESS; of the macroeconomic variables (i.e., GDP, BSE sensitivity index and WPI) from RBI’s website.
For a particular year, all the firms with missing information on firm variables like total assets, net equity, etc. were removed for
that year. In addition, to avoid the effect of outliers, all those firms which have their book leverage values >1 have been dropped for that particular year because those firms have their book equity negative for that year. Academics and practitioners argue that the firms with negative book equity stocks have high default risk (Brown et al., 2008).
In the study, the dependent variables are the average values of book leverage, net equity (or share capital) and retained earnings separately, for a particular year and the independent variables are the macroeconomic variables.
Further, to linearize the trend of the time series, the macroeconomic data is transformed to its natural logarithm.
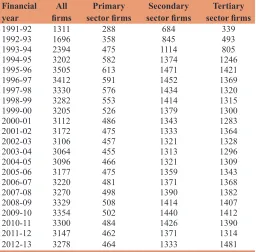
The present study focuses on two objectives – First, to study the effect of macroeconomic variables on the capital structure decisions of the Indian firms, and second, to study the same effect when the firms are categorized into the three sectors of the Indian economy – Primary, secondary and tertiary. The first objective uses the full data set and for the second objective, the firms are first categorized into the different sectors of the Indian Economy and then the effect is analyzed for the respective sector. In particular, the possible relationship between the macroeconomic variables and the capital structure of firms is investigated by using VECM/VAR method. Table 3 shows the number of firms used in the study.
4.1. Model
Explanatory variables (like GDP, WPI and BSE Sensitivity Index) may have significant impact on the capital structure decisions of a firm, not only with their current values but also with their lagged values. Therefore, it is pertinent to know that how many lags of these variables are significant for our study, hence, Akaike’s information criterion (AIC) is used to determine the lag length of these explanatory variables. In time-series analysis, the first step is to ensure the stationarity of the variables, for which augmented Dicky–Fuller unit root test is applied. The second step is to test for the co-integration among the variables, for which Johansen co-integration test is applied. A co-integration among the variables means that they have a long-term or an equilibrium relationship. Next step would be to know that whether the variables are having short-term relationship or not, therefore, VECM or VAR models are applied. VECM is applied when the variables are co-integrated and VAR otherwise. In VECM, if the error correction term is negative and significant,
Table 2: Variables and their computations Variable name Computation
Total liabilities Minority interest reserves+borrowings
(including convertible debt)−convertible
debt+current liabilities+deferred tax liability Book equity Total assets−total liabilities−preferred
stock+convertible debt
Book leverage (Total assets−book equity)/total assets
Retained earnings Retained earnings/total assets
then it indicates that any short-term fluctuations between the dependent and independent variables will give rise to a stable long-run relationship.
To check the reliability of the VECM/VAR models, three residual tests are done for normality, heteroskedasticity and serial correlation using Jarque–Bera, autoregressive conditional heteroskedasticity and Breusch–Godfrey serial correlation tests respectively. Accordingly, the residuals should be normally distributed, homoskedastic and serially uncorrelated.
For all the tests, 5% is taken as the level of significance.
The above model is used for the all firms’ data and also when they are categorized into the three sectors of the economy for all the three dependent variables i.e., book leverage, net equity and retained earnings.
The expected sign of the independent variables with the dependent variables, according to the equity market timing theory is shown in the Table 4.
4.2. Hypotheses
The empirical evidence obtained by several studies (Booth et al., 2001; Antoniou et al., 2002; Bokpin, 2009, etc.) indicates that the macroeconomic environment influences the capital structure decisions of the firms. It is also evident from the literature that the market timing theory provides a better explanation for the variation in the financing decisions of the firms. This paper explores the cause and effect relationship of the macroeconomic variables for corporate financing decisions in context to the equity market timing theory. It studies the long-term as well as the short-term effects of the macroeconomic variables on the capital structure decisions for Indian
firms and also when the firms are categorized into the three sectors.
For the analysis, the following hypotheses have been formulated and are applicable for all the three dependent variables, i.e., book leverage, net equity and retained earnings respectively.
In the first hypothesis, the authors’ expect a significant long-term relationship of the macroeconomic variables on the firm’s capital structure choice.
First hypothesis:
H1: The macroeconomic variables (BSE, GDP and WPI) have a significant long-term effect on the choice of capital.
For the second hypothesis, it is expected that the individual variables (like BSE, GDP and WPI) in the short-run, affect the capital structure choice of the firms as per the equity market timing theory, as shown in Table 4.
Second hypothesis (for individual variables):
H2: The variable (like BSE, GDP and WPI) has a significant short-term effect on the choice of capital structure as per the equity market timing theory.
The above two hypotheses are tested for the all firms’ data as well as when they are categorized into the three sectors.
Further, in the third hypothesis, the authors are interested in exploring the inter-sectoral variations in the capital structure choice.
Third hypothesis (for sectoral classification):
H3: There is an inter-sectoral variation in the capital structure choice.
All the three hypotheses have been evaluated against their null hypothesis, which assumes that there is no relation between dependent and independent variables.
Significance level, for all the hypotheses has been taken at 5%.
5. DATA ANALYSIS AND RESULTS
This section discusses the results of the analysis for all firms’ data and for primary, secondary and tertiary sector firms.
All the tests are performed at lag1, based on AIC, for all the four cases. Table 3: Number of firms
Financial
year firmsAll sector firmsPrimary sector firmsSecondary sector firmsTertiary
1991-92 1311 288 684 339
1992-93 1696 358 845 493
1993-94 2394 475 1114 805
1994-95 3202 582 1374 1246
1995-96 3505 613 1471 1421
1996-97 3412 591 1452 1369
1997-98 3330 576 1434 1320
1998-99 3282 553 1414 1315
1999-00 3205 526 1379 1300 2000-01 3112 486 1343 1283
2001-02 3172 475 1333 1364
2002-03 3106 457 1321 1328
2003-04 3064 455 1313 1296
2004-05 3096 466 1321 1309 2005-06 3177 475 1359 1343
2006-07 3220 481 1371 1368
2007-08 3270 498 1390 1382
2008-09 3329 508 1414 1407 2009-10 3354 502 1440 1412
2010-11 3300 484 1426 1390 2011-12 3147 462 1371 1314
2012-13 3278 464 1333 1481 Source: Authors’ compilation (the number of firms here is after dropping the firms with
missing values and applying the outliers)
Table 4: The expected sign of coefficients of different variables
Dependent variable/ independent variable
Expected signs Book
leverage Net equity Retained earnings BSE sensitivity index Negative Positive Negative
GDP Negative Positive Negative
WPI Positive Negative Positive/negative Source: Authors’ compilation based on different studies. GDP: Gross domestic product,
The first step is the stationarity test and all the variables are found stationary in their first difference (i.e., they are integrated of order 1).
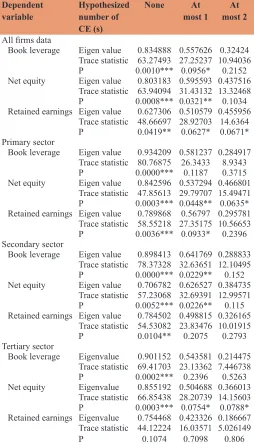
Next comes the Johansen’s co-integration test and the results are shown in Table 5.
The short-term relationship for all firms’ data, primary sector firms, secondary sector firms and tertiary sector firms have been displayed below in the Tables 6-8 respectively. VECM is run for all the three dependent variables in case of all the four cases, except for retained earnings of tertiary sector, for which VAR is run.
From all firms’ data (Table 6), it is seen that a long-run relationship of macroeconomic variables exists with book leverage and retained earnings respectively, thus rejecting the null hypothesis of H1. In the short-run, one could say that with an increase in WPI, the firms move towards book leverage
(according to equity market timing theory); thereby the null hypothesis of H2 is rejected.
In a similar way, one could interpret the results from the sectoral classification of the firms (Tables 7-9). For the primary sector firms (Table 7), the long-run effect of the macroeconomic variables exists with book leverage (rejecting null hypothesis of H1); in case of the secondary and tertiary sector firms (Tables 8 and 9) with book leverage and net equity both (null hypothesis of H1 is rejected) and no long-term relationship exists with the retained earnings of all the three cases (failing to reject the null hypothesis of H1).
Now, let us discuss about the short-term effect of the individual macroeconomic variables on the capital structure choice. In case of primary sector (Table 7), the firms move towards leverage with an increase in BSE (not as expected; failing to reject the null hypothesis of H2). Further, an increase in GDP makes the firms move towards leverage (opposite to theory; failing to reject the null hypothesis of H2) whereas a decrease in GDP makes them move towards retained earnings (as expected; rejecting the null hypothesis of H2). Further, for the secondary sector firms (Table 8), it is seen that the firms preferred retained earnings with an increase in BSE and/or GDP (not according to theory; the null hypothesis of H2 is rejected). Talking about the tertiary sector firms (Table 9), an increase in BSE makes them move towards net equity (according to theory; rejecting the null hypothesis of H2). Also, with an increase in GDP, the firms’ preferred net equity (as expected; the null hypothesis of H2 is rejected) as well as retained earnings (opposite to theory; failing to reject the null hypothesis of H2).
Regardless of the sectors to which the firms belong to, it is found WPI has a direct relation with leverage (as expected; rejecting the null hypothesis of H2).
Here, it is seen that an inter-sectoral variation exists in the capital structure decisions of the firms (the null hypothesis of H3 is rejected). During the periods of high GDP the primary sector firms prefer leverage; the secondary sector firms favor retained earnings and the tertiary sector firms have inclination for net equity. Only the results of tertiary sector firms are compatible with the equity market timing theory.
5.1. Residual Tests
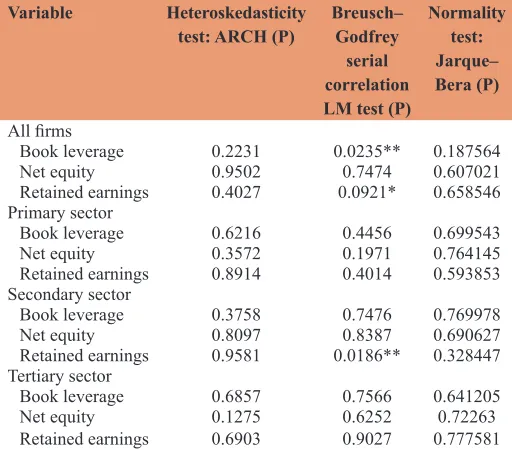
Table 10 shows the residual test of normality, heteroskedasticity and serial correlation.
From the Table 10, it is found that the residuals are homoskedastic and normally distributed for all the cases and serially uncorrelated for almost all the cases.
The F-test is significant (at the 5% level) for all the cases, indicating that the models are significant.
6. DISCUSSION
The results from the above section are summarized in the Table 11.
The analysis shows that the improvement in general economy, in the long-run, drives the firms to the external sources of financing Table 5: Johansen system co-integration test
Dependent
variable Hypothesized number of CE (s)
None At
most 1 most 2At
All firms data
Book leverage Eigen value 0.834888 0.557626 0.32424
Trace statistic 63.27493 27.25237 10.94036
P 0.0010*** 0.0956* 0.2152
Net equity Eigen value 0.803183 0.595593 0.437516
Trace statistic 63.94094 31.43132 13.32468 P 0.0008*** 0.0321** 0.1034
Retained earnings Eigen value 0.627306 0.510579 0.455956
Trace statistic 48.66697 28.92703 14.6364 P 0.0419** 0.0627* 0.0671*
Primary sector
Book leverage Eigen value 0.934209 0.581237 0.284917
Trace statistic 80.76875 26.3433 8.9343 P 0.0000*** 0.1187 0.3715
Net equity Eigen value 0.842596 0.537294 0.466801
Trace statistic 47.85613 29.79707 15.49471
P 0.0003*** 0.0448** 0.0635*
Retained earnings Eigen value 0.789868 0.56797 0.295781
Trace statistic 58.55218 27.35175 10.56653
P 0.0036*** 0.0933* 0.2396
Secondary sector
Book leverage Eigen value 0.898413 0.641769 0.288833
Trace statistic 78.37328 32.63651 12.10495
P 0.0000*** 0.0229** 0.152
Net equity Eigen value 0.706782 0.626527 0.384735
Trace statistic 57.23068 32.69391 12.99571
P 0.0052*** 0.0226** 0.115
Retained earnings Eigen value 0.784502 0.498815 0.326165
Trace statistic 54.53082 23.83476 10.01915
P 0.0104** 0.2075 0.2793
Tertiary sector
Book leverage Eigenvalue 0.901152 0.543581 0.214475
Trace statistic 69.41703 23.13362 7.446738
P 0.0002*** 0.2396 0.5263
Net equity Eigenvalue 0.855192 0.504688 0.366013
Trace statistic 66.85438 28.20739 14.15603
P 0.0003*** 0.0754* 0.0788*
Retained earnings Eigenvalue 0.754468 0.423326 0.186667
Trace statistic 44.12224 16.03571 5.026149
P 0.1074 0.7098 0.806 Source: Authors’ calculation (*,**,*** means the values are significant at 10%, 5% and
(i.e., debt or equity). From the works of various authors like that of Atkin and Glen (1992) and Singh and Hamid (1992), it has been seen that for the firms in developing countries, externally generated funds, i.e., bank loans and equity, are more important in comparison to the internally generated funds i.e., retained earnings.
Variation in a firm’s debt-equity mix depends upon the macroeconomic environment, government controls and intervention in the domestic and international capital markets. The beginning of liberalization process in India, since 1991, not only fostered the development of domestic capital markets, but also made the access to international markets easy. Liberalization
Table 6: VECM and VAR model for all firms
Independent variable Dependent variable
Book leverage (VECM) Net equity (VAR) Retained earnings (VAR)
Coefficient P Coefficient P Coefficient P
EC (1) −0.953897 0.0000*** −0.158607 0.4674 −0.272543 0.0104**
EC (2) - - −0.032019 0.2325 -
-Dependent variable (−1) 0.646075 0.0000*** 0.161594 0.6318 0.039392 0.8605 BSE (−1) 0.017352 0.3066 −0.004478 0.9042 0.030405 0.1693 GDP (−1) −0.116514 0.4223 0.005712 0.9861 −0.341342 0.11 WPI (−1) 0.320456 0.0096*** 0.279728 0.2231 −0.171625 0.1227
Constant −0.016007 0.1252 −0.009813 0.6502 0.028805 0.0728*
Source: Authors’ calculation (*,**,***means the values are significant at 10%, 5% and 1% respectively). “-” represents absence of the variable. GDP: Gross domestic product,
WPI: Wholesale price index, BSE: Bombay stock exchange, VECM: Vector error correction model, VAR: Vector autoregressive
Table 7: VECM and VAR model for primary sector firms
Independent variable Dependent variable
Book leverage (VECM) Net equity (VECM) Retained earnings (VECM)
Coefficient P Coefficient P Coefficient P
EC (1) −1.210607 0.0000*** 0.011113 0.9506 −0.122592 0.4299
EC (2) - - 0.023341 0.8812 -
-Dependent variable (−1) 0.511654 0.0002*** −0.483724 0.0304** −0.024171 0.9314 BSE (−1) 0.045908 0.0380** 8.68E-05 0.9974 0.013384 0.6303 GDP (−1) 0.526165 0.0094** −0.071363 0.7039 −0.375595 0.0107** WPI (−1) 0.089811 0.3656 −0.383919 0.0183** −0.182443 0.2161
Constant 0.035419 0.0128** −0.012723 0.3282 0.033851 0.0660
Source: Authors’ calculation (**,***means the values are significant at 10%, 5% and 1% respectively). “-” represents absence of the variable. GDP: Gross domestic product,
WPI: Wholesale price index, BSE: Bombay stock exchange, VECM: Vector error correction model, VAR: Vector autoregressive
Table 8: VECM and VAR model for secondary sector firms
Independent variable Dependent variable
Book leverage (VECM) Net equity (VECM) Retained earnings (VECM)
Coefficient P Coefficient P Coefficient P
EC (1) −0.55013 0.0016*** −0.287611 0.0182** −0.117302 0.2169
EC (2) −0.038847 0.0002*** −0.067112 0.0089*** -
-Dependent variable (−1) 0.423585 0.0022*** −0.156691 0.6827 0.148862 0.4173 BSE (−1) 0.016851 0.3326 −0.041396 0.148 0.046332 0.0076*** GDP (−1) −0.000876 0.9957 0.210392 0.3763 0.561969 0.0006*** WPI (−1) 0.154576 0.0477** −0.001556 0.9945 −0.078294 0.3599
Constant −0.012695 0.2571 −0.003553 0.8278 0.036628 0.0025***
Source: Authors’ calculation (**,***means the values are significant at 10%, 5% and 1% respectively). “-” represents absence of the variable. GDP: Gross domestic product,
WPI: Wholesale price index, BSE: Bombay stock exchange, VECM: Vector error correction model, VAR: Vector autoregressive
Table 9: VECM and VAR model for tertiary sector firms
Independent variable Dependent variable
Book leverage (VECM) Net equity (VECM) Retained earnings (VAR)
Coefficient P Coefficient P Coefficient P EC −0.668541 0.0001*** −0.990659 0.0433** -
-Dependent variable (−1) 1.049444 0.0000*** 0.551857 0.1644 0.54422 0.1291 BSE (−1) −0.023058 0.3146 0.057911 0.0312** −0.003045 0.9318 GDP (−1) 0.324953 0.1016 0.862468 0.0479** 0.119418 0.0376** WPI (−1) 0.706598 0.0039*** −0.219702 0.6793 −0.139512 0.2725
Constant −0.062138 0.0020*** −0.031653 0.3396 −1.399337 0.3822
Source: Authors’ calculation (*,**,***means the values are significant at 10%, 5% and 1% respectively). “-” represents absence of the variable. GDP: Gross domestic product,
measures like abolishment of the office of the controller of capital issues, free pricing of primary issues for all types of securities, statuary powers given to SEBI, taping offshore markets directly, deregulation of interest rates, freedom to fix coupon rates according to the market’s yield requirements, establishment of credit rating agencies which increased the availability of information in market, entry of FIIs and many more, constitute the core of the new corporate finance in India and makes external sources accessible easily (Glen and Pinto, 1994; Barua et al., 1994). So, one could say that as the economy grows, the firms also grow and so does their requirement for funds. Therefore, depending upon which market is favorable, the firms opt for that source of finance.
In case of all firms’ data, a clear picture of the choice of capital is not visible, because here, the firms belonging to different sectors of the economy have been clubbed together. Firms in different sectors
have different business environments and risks, due to which their capital structure requirements are different. Therefore, one must study the capital structure of the firms when they are categorized into the three sectors of the economy.
The primary sector firms prefer debt over equity finance or retained earnings (both in the long-run as well as in the short-run). The primarysector firms make direct use of natural resources and most of the products from this sector provide raw materials for other industries. Major businesses in this sector are agriculture, agribusiness, fishing, forestry, mining and quarrying industries. These firms neither have an easy access to the equity market nor do they have sufficient retained earnings, so the only option they have is of debt. In long-run, these firms prefer debt financing because the long-term debt has an extended payback period of more than 1 year, and it is often up to 20-30 years. Long-term financing is usually used to purchase major assets such as buildings and equipment, and these assets often serve as collateral on the loan. So, as the economy grows these firms move towards leverage (a direct relation of leverage with GDP as well as with BSE is seen) which is not in accordance with the equity market timing theory, but in accordance to trade-off theory.
Talking about the secondary sector firms, it is found that the macroeconomic variables have a long-term relationship with book leverage and net equity, both. The firms which belong to this sector are the most capital intensive in nature. These firms require huge long-term investments in the form of plant and machinery and are physically spread over many acres of land. So, for the long-run, they time the market and whichever source is easily available, they opt for that source of finance. However, in the short-run, during the periods of economic growth (high GDP), the firms preferred retained earnings, opposite to equity market timing theory (but according to pecking order theory). As discussed above, the secondary sector firms require huge amount of capital, so funding through retained earnings is a powerful strategy. It doesn’t add to the debt profile nor does it sap the profits with interest payments. It also gives the management full control over the firm. This option strengthens the financial position of the firm and thereby gives financial stability to the firm.
Table 10: Residual tests
Variable Heteroskedasticity
test: ARCH (P) Breusch–Godfrey serial correlation LM test (P)
Normality test: Jarque– Bera (P)
All firms
Book leverage 0.2231 0.0235** 0.187564
Net equity 0.9502 0.7474 0.607021
Retained earnings 0.4027 0.0921* 0.658546
Primary sector
Book leverage 0.6216 0.4456 0.699543
Net equity 0.3572 0.1971 0.764145
Retained earnings 0.8914 0.4014 0.593853
Secondary sector
Book leverage 0.3758 0.7476 0.769978
Net equity 0.8097 0.8387 0.690627
Retained earnings 0.9581 0.0186** 0.328447
Tertiary sector
Book leverage 0.6857 0.7566 0.641205
Net equity 0.1275 0.6252 0.72263
Retained earnings 0.6903 0.9027 0.777581 Source: Authors’ calculation (*,**means the values are significant at 10%, 5% and 1%
respectively). ARCH: Autoregressive conditional heteroskedasticity, LM: Lagrange
multiplier
Table 11: Summary of the results
Sectors Dependent
variable Long-term effect BSE Independent variableGDP WPI
Short-term effect Short-term effect Short-term effect Relation According
to theory Relation According to theory Relation According to theory
All Book leverage Yes Positive - Negative - Positive* Yes
Net equity No Negative - Positive - Positive
-Retained earnings Yes Positive - Negative - Negative
-Primary sector Book leverage Yes Positive* No Positive* No Positive
-Net equity No Positive - Negative - Negative* Yes
Retained earnings No Positive - Negative* Yes Negative
-Secondary sector Book leverage Yes Positive - Negative - Positive* Yes
Net equity Yes Negative - Positive - Negative
-Retained earnings No Positive* No Positive* No Negative
-Tertiary sector Book leverage Yes Negative - Positive - Positive* Yes
Net equity Yes Positive* Yes Positive* Yes Negative
-Retained earnings No Negative - Positive* No Negative
On the other hand, for the firms belonging to the tertiary sector, a long-term relation exists with debt as well as with equity. In the short-run, with improvement in the economic conditions (i.e., during the periods of high GDP), firms preferred equity (according to the equity market timing theory) or retained earnings. The tertiary sector firms are relatively high-risk firms because they have high intangible assets and low tangible assets, thereby, making it difficult for them to borrow from banks and financial institutions. Hence, for short-run, the only option available with them is either to go for equity or for retained earnings. So, they time the market and which so ever is favorable, they opt for that source of finance.
From the results, it is also seen that regardless of the sectors to which the firms belong to, the firms move towards debt during the periods of high inflation. Corcoran (1977) and Zwick (1977) theoretically explain that inflation leads to more debt since it lowers the real cost of debt and thus, increases the demand for corporate bonds during inflationary periods. On the other hand, in future when inflation decreases, bond returns will become higher relative to stocks return. Further, from the works of Harvey et al. (2004) and Barry et al. (2008) it is seen that decision of issuing debt is affected by the time in which the interest rate is low as compared to its historical level of debt. Therefore, if a firm expects that due to rising inflation, the interest will increase in future in comparison to the existing interest rate, then it will be profitable for the firm to issue debt now because if the firm’s expectation appears to be true yet the firm will pay low interest on debt capital.
7. CONCLUSION
This research revealed an incredible complexity of explaining the firms’ behavior of capital structure choice by using the equity market timing theory. The results indicate that changes in macroeconomic environment have a significant impact on the firm’s choice of finance both in the long-run as well as in the short-run. Here an inter-sectoral variation is seen in the capital structure decisions of the firms. From the analysis, it has been found that for primary sector firms, leverage is pro-cyclical (as per the tradeoff theory) i.e., as the economy grows the firms move towards debt; secondary sector firms implies a counter-cyclical leverage i.e., preferring retained earnings (according to the pecking order theory) and for tertiary sector firms equity is pro-cyclical i.e., preference is towards equity, as per the equity market timing theory. This research enhances the understanding of capital structure decisions for emerging nations like India. Such a research can help the firms in designing their capital structure in a judicious manner, so that they can make their presence in the global arena.
7.1. Implications
Today’s competitive environment has made the managers to be cautious and more aware about how to finance their business activities and manage capital structure. The managers must bear in mind that for improving the performance of the firm, the choice of capital is a critical decision as it affect both the financial risk and the cost of capital, finally affecting the value of the firm.
The market timing theory implies that the managers constantly watch about the movements in the markets and issue the securities only when the market conditions are favorable. So, by timing the markets, the managers can improve the financial performance of the firm. Here it is found that an inter-sectoral variation exists in the firms’ capital structure choice. Therefore, depending upon the sector to which the firms belong to, the managers must identify the windows of opportunity during which the security issuance is less costly. This would not only contribute towards the improvement of the current financial performance but also towards the future viability of the firm.
The research reveals that there exists a causal effect of macroeconomic variables on the capital structure decisions of the firm, therefore, while timing the capital structure targets, the managers should not only consider the firm level characteristics, but due consideration should also be given to the state of the economy.
7.2. Limitations and Scope for Future
The major limitation of the study is the data set is for a specific nation, i.e., India, thus, the generalization of these findings for other emerging nations (with different legal structure) remains an open empirical question. A study that compares the effect of the macroeconomic variables on the capital structure decisions of the firms belonging to different nations through analytical and causal research design, would add additional insights to the extant literature.
This study concentrates on the causal effect of macroeconomic variables for the sectoral classification of the firms; however, the scope of research can be extended for industrial classification also which may bring out a different perspective, as the firms in different industries behave differently with respect to the market timing. In addition to this, a research that contemplates the causal effect of macroeconomic variables on the capital structure and financial performance of the firms, depending upon the age and/or size of the firms, would also enrich the knowledge base.
REFERENCES
Alom, K. (2013), Capital structure choice of Bangladeshi firms: An empirical ınvestigation. Asian Journal of Finance & Accounting, 5(1), 320-333.
Antoniou, A., Guney, Y., Paudyal, K. (2002), Determinants of corporate capital structure: Evidence from European countries. Available from: http://www.webkuliah.unimedia.ac.id/ebook/files/GMM(capstru). pdf. [Last retrieved on 2014 Jan 26].
Atkin, M., Glen, J. (1992), Comparing corporate capital structures around the globe. The International Executive, 34(5), 369-387.
Baker, M., Wurgler, J. (2002), Market timing and capital structure. Journal
of Finance, LVII(1), 1-32.
Bancel, F., Mittoo, U.R. (2004), Cross-country determinants of capital structure choice: A survey of European firms. Financial Management, 33(4), 103-132.
Barry, C., Mann, S., Mihov, V., Rodríguez, M. (2008), Corporate
debt issuance and the historical level of interest rates. Financial
Management, 37(3), 413-430.
Analysis of the Indian securities industry: Market for debt. Journal
of the Indian Institute of Management, 19(3), 3-22.
Bas, T., Muradoglu, G., Phylaktis, K. (2009), Determinants of Capital
Structure in Developing Countries. Research Paper Series. Cass Business School, London, UK.
Beck, T., Demirgüç-Kunt, A., Maksimovic, V. (2002), Financing Patterns around the World: The Role of İnstitutions. World Bank Policy Research, Working Paper No. 2905. Washington, DC: World Bank. Bhayani, S.J. (2005), Determinants of capital structure: An empirical
analysis of Indian private corporate sector. Asia-Pacific Business
Review, 1(2), 13-23.
Bokpin, G.A. (2009), Macroeconomic development and capital structure decisions of firms: Evidence from emerging market economies.
Studies in Economics and Finance, 26(2), 129-142.
Booth, L., Aivazian, V., Kunt, A.D., Maksimovic, V. (2001), Capital
structures in developing countries. The Journal of Finance, 56(1),
87-130.
Bougatef, K., Chichti, J. (2010), Equity market timing and capital
structure: Evidence from Tunisia and France. International Journal
of Business and Management, 5(10), 167-177.
Brown, S., Lajbcygier, P., Li, B. (2008), Going negative: What to do with negative book equity stocks. Available from: http://www.ssrn.com/ abstract=1142649. [Last retrieved on 2012 Jul 15].
Chadegani, A.A., Nadem, M., Noroozi, M., Madine, S.M. (2011), The
effect of economic and accounting variables on capital structure: Empirical evidence from Iranian companies. International Research
Journal of Finance and Economics, 71, 105-111.
Chen, D.H., Chen, C.D., Chen, J., Huang, Y.F. (2013), Panel data analyses
of the pecking order theory and the market timing theory of capital
structure in Taiwan. International Review of Economics & Finance, 27(C), 1-13.
Choe, H., Masulis, R.W., Nanda, V.K. (1993), Common stock offerings across the business cycle. Journal of Empirical Finance, 1(1), 3-31. Copeland, T.E., Weston, J.F. (1993), Financial Theory and Corporate
Policy. 3rd ed. New York: Addison Wesley.
Çekrezi, A. (2013), Analyzing the ımpact of firm’s specific factors and macroeconomic factors on capital structure: A case of small non-listed firms in Albania. Research Journal of Finance and Accounting, 4(8), 90-95.
Corcoran, P. (1977), Inflation, taxes and corporate investment incentives.
Federal Reserve Bank of New York. Quarterly Review, 2, 1-9.
Das, S., Roy, M. (2007), Inter-ındustry differences in capital structure: Evidence from India. Finance India, 21(2), 517-532.
Deesomsak, R., Paudyal, K., Pesce, G. (2004), The determinants of capital structure: Evidence from the Asia Pacific region. Journal of Multinational Financial Management, 14(4-5), 387-405.
Demirgüç-Kunt, A., Maksimovic, V. (1998), Law, finance, and firm growth. The Journal of Finance, 53(6), 2107-2137.
Doku, J.N., Adjasi, C.K., Sarpong-Kumankuma, E. (2011), Financial market development and capital structure of listed firms - Empirical evidence from Ghana. Serbian Journal of Management, 6(2),
155-168.
Elliott, W.B., Koëter-Kant, J., Warr, R.S. (2007), A valuation-based test
of market timing. Journal of Corporate Finance, 13(1), 112-128.
Elliott, W.B., Koëter-Kant, J., Warr, R.S. (2008), Market timing and the debt-equity choice. Journal of Financial Intermediation, 17(2), 175-197.
Fernando, A.C. (2009), Business Ethics: An Indian Perspective. India:
Pearson Education.
Frank, M.Z., Goyal, V.K. (2009), Capital structure decisions: Which factors are reliably ımportant? Financial Management, 38(1), 1-37. Gajurel, D.P. (2006), Macroeconomic ınfluences on corporate capital
structure. Available from: http://www.ssrn.com/abstract=899049. [Last retrieved on 2013 Dec 20].
Gertler, M., Hubbard, R.G. (1993), Corporate financial policy, taxation and macroeconomic risk. RAND Journal of Economics, 24(2), 286-303. Glen, J., Pinto, B. (1994), Debt or equity? How firms in developing
countries choose. International Finance Corporation, The World
Bank, Discussion Paper No. 22, 01 January, Washington, D.C. Graham, J.R., Harvey, C.R. (2011), The theory and practice of corporate
finance: Evidence from the field. Journal of Financial Economics, 60(2-3), 187-243.
Grossman, S.J. (1976), On the efficiency of competitive stock markets
where traders have diverse information. Journal of Finance, 31(2),
573-585.
Grossman, S., Stiglitz, J. (1980), On the ımpossibility of ınformationally efficient markets. American Economic Review, 70(3), 393-408. Gujarati, D.N. (2011), Econometrics by Example. New York:
McGraw-Hill.
Harris, M., Raviv, A. (1991), The theory of capital structure. The Journal of Finance, 46(1), 297-355.
Harvey, C.R., Lins, K.V., Roper, A.H. (2004), The effect of capital
structure when expected agency costs are extreme. Journal of
Financial Economics, 74(1), 3-30.
Huang, R., Ritter, J.R. (2009), Testing the market timing theory of capital structure. Journal of Financial and Quantitative Analysis, 44(2), 237-271.
Jensen, M.C., Meckling, W.H. (1976), Theory of the firm: Managerial
behavior, agency costs and ownership structure. Journal of Financial
Economics, 3(4), 305-360.
Joeveer, K. (2006), Sources of Capital Structure: Evidence from Transition Countries. Center for Economic Research and Graduate Education, Academy of Sciences of the Czech Republic Economics Institute, Working Paper. Available from: http://www.ssrn.com/ abstract=1130306. [Last retrieved on 2012 Jun 30].
Khanna, S., Srivastava, A., Medury, Y. (2013), Testing the market timing
theory of capital structure for Indian firms. JBIMS Spectrum,
1(1), 9-20.
Khanna, S., Srivastava, A., Medury, Y. (2014), Revisiting the capital
structure theories with special reference to India. The International Journal of Business and Management, 2(8), 132-138.
Korajczyk, R., Lucas, D., McDonald, R.L. (1992), Equity issues with time-varying asymmetric information. Journal of Financial and
Quantitative Analysis, 27(3), 397-417.
Korajczyk, R.A., Levy, A. (2001), Capital structure choice: Macroeconomic conditions and financial constraints. Journal of Financial Economics, 68(1), 75-109.
Kraus, A., Litzenberger, R.H. (1973), A state-preference model of optimal financial leverage. The Journal of Finance, 28(4), 911-922. Lemma, T.T., Negash, M. (2013), Institutional, macroeconomic and
firm-specific determinants of capital structure. Management Research Review, 36(11), 1081-1122.
Mahmud, M., Herani, G.M., Rajar, A.W., Farooqi, W. (2009), Economic factors ınfluencing corporate capital structure in three Asian
countries: Evidence from Japan, Malaysia and Pakistan. Indus
Journal of Management & Social Sciences, 3(1), 9-17.
Muthama, C., Mbaluka, P., Kalunda, E. (2013), An empirical analysis of macro-economic ınfluences on corporate capital structure of listed companies in Kenya. Journal of Finance and Investment Analysis,
2(2), 41-62.
Myers, S.C., Majluf, N.S. (1984), Corporate financing and investment decisions when firms have information that investors do not have. Journal of Financial Economics, 13(2), 187-221.
Noguera, J.J. (2001), Inflation and capital structure. CERGE-EI Working Paper No. 180. Available from: http://www.ssrn.com/ abstract=289546. [Last retrieved on 2013 May 18].
Available from: http://www.ssrn.com/abstract=1561145. [Last retrieved on 2012 Apr 02].
Rajan, R.G., Zingales, L. (1995), What do we know about capital structure? Some evidence from ınternational data. The Journal of Finance, L(5), 1421-1460.
Ramli, N.A., Nartea, G. (2013), Interrelation between capital structure, economy sectors, and a firm’s financial performance in Indonesia:
Partial lease squares-structural equation modelling (PLS-SEM).
World Finance & Banking Symposium, Beijing.
Remmers, L., Stonehill, A., Wright, R., Beekhuisen, T. (1974), Industry and size as debt ratio determinants in manufacturing ınternationally.
Financial Management, 3(2), 24-32.
Riaz, F., Bhatti, K.K., Uddin, S. (2014), Macroeconomic conditions and firm’s choices of capital structure: Evidence from Pakistan’s manufacturing sectors. Middle-East Journal of Scientific Research,
19(4), 521-531.
Singh, A., Hamid, J. (1992), Corporate Financial Structures in Developing
Countries. International Finance Corporation Technical Paper, No. 1. Washington, DC: World Bank.
Smith, C, Jr., Watts, R. (1992), The investment 5921opportunity set and
corporate financing, dividend, and compensation policies. Journal
of Financial Economics, 32(3), 263-292.
Wanzenried, G. (2006), Capital structure dynamics in the UK and continental Europe. The European Journal of Finance, 12(8), 693-716. Weigl, J., Wittenberg, L. (2011), Market-timing of capital structure and
factors ınfluencing the leverage decision of firms. Available from: http://www.qucosa.de/fileadmin/data/qucosa/documents/8108/ Dissertation_Johannes_Weigl.pdf. [Last retrieved on 2014 Mar 05]. Zwick, B. (1977), The market for corporate bonds. Federal Reserve Bank
of New York Quarterly Review, 2, 10.