Comprehensive immune transcriptomic analysis in bladder cancer
reveals subtype specific immune gene expression patterns of
prognostic relevance
Runhan Ren1,2, Kathrin Tyryshkin3, Charles H. Graham1,2, Madhuri Koti2,4,5 and D. Robert Siemens1,2
1Department of Urology, Queen’s University, Kingston, ON, Canada
2Department of Biomedical and Molecular Sciences, Queen’s University, Kingston, ON, Canada 3Department of Pathology and Molecular Medicine, Queen’s University, Kingston, ON, Canada
4Cancer Biology and Genetics Division, Queen’s Cancer Research Institute, Queen’s University, Kingston, ON, Canada 5Department of Obstetrics and Gynecology, Queen’s University, Kingston, ON, Canada
Correspondence to: D. Robert Siemens, email: [email protected] Keywords: MIBC, immune biomarkers, immunotherapy, TCGA, interferon
Received: December 14, 2016 Accepted: May 21, 2017 Published: August 09, 2017
Copyright: Ren et al. This is an open-access article distributed under the terms of the Creative Commons Attribution License 3.0 (CC BY 3.0), which permits unrestricted use, distribution, and reproduction in any medium, provided the original author and source are credited.
ABSTRACT
Recent efforts on genome wide profiling of muscle invasive bladder cancer (MIBC) have led to its classification into distinct genomic and transcriptomic molecular subtypes that exhibit variability in prognosis. Evolving evidence from recent immunotherapy trials has demonstrated the significance of pre-existing tumour immune profiles that could guide treatment decisions. To identify immune gene expression patterns associated with the molecular subtypes, we performed a comprehensive in silico immune transcriptomic profiling, utilizing transcriptomic data from 347 MIBC cases from The Cancer Genome Atlas (TCGA). To investigate subtype-associated immune gene expression patterns, we assembled 924 immune response genes and specifically those involved in T-cell cytotoxicity and the Type I/II interferon pathways. A set of 157 ranked genes was able to distinguish the four subtypes in an unsupervised analysis in an original training cohort (n=122) and an expanded, validation cohort (n=225). The most common overrepresented pathways distinguishing the four molecular subtypes, included JAK/STAT signaling, Toll-like receptor signaling, interleukin signaling, and T-cell activation. Some of the most enriched biological processes were responses to IFN-γ, antigen processing and presentation, cytokine mediated signaling, hemopoeisis, cell proliferation and cellular defense response in the TCGA cluster IV. Our novel findings provide further insights into the association between genomic subtypes and immune activation in MIBC and may open novel opportunities for their exploitation towards precise treatment with immunotherapy.
INTRODUCTION
Urothelial bladder cancer (UBC) is the fifth most common cancer worldwide [1] and is one of the most management intensive cancers in North America [2]. Although the majority of incident cases of UBC are non-invasive at presentation, muscle invasive bladder
cancer (MIBC) represents very aggressive disease with rapid progression to metastases [3] and poor overall survival despite intensive local and systemic therapy. Current standards for localized MIBC include radical cystectomy with or without perioperative cisplatin-based chemotherapy [3]. Unfortunately, many suffer early disease recurrence and, despite palliative chemotherapy,
www.impactjournals.com/oncotarget/ Oncotarget, 2017, Vol. 8, (No. 41), pp: 70982-71001
median survival rates are generally less than one year [4]. The optimal management of patients with higher risk UBC is ambiguous with a significant need for better prediction tools and enhanced therapeutics [5].
MIBCs are highly heterogeneous tumours. Recent investigations based on molecular profiling of specimens from large UBC cohorts have led to their classification into molecular subtypes that display distinct genomic and transcriptomic features, resembling those seen in breast cancer [3], [6–8]. Interestingly, these subtypes may exhibit distinct associations with treatment response and survival [8, 9]. Although different groups have classified UBC into two [8], three [3], four [6], or five [7] subtypes, there is a consensus that the top separation occurs as the basal and luminal subtypes [10]. Basal tumours, enriched with EGFR and hypoxia-inducible factor 1 expression, are often metastatic at presentation, possess squamous and sarcomatoid histological features, and have epithelial-to-mesenchymal transition cell biomarkers [11]. In comparison, luminal cancers have papillary features and commonly FGFR3, ERBB2, and ERBB3 activating mutations [11]. The Cancer Genome Atlas Network (TCGA) bladder analysis working group classified bladder tumours into four clusters named I, II, III, and IV [6]. Clusters I and II correspond to the luminal subtype, while III and IV represent the basal subtype [12]. Tumours in Cluster I are enriched in FGFR3 overexpression due to mutations and amplification and show better overall survival, whereas those in cluster II, designated “p53-like” tumours, express active p53 gene signatures and are resistant to neoadjuvant cisplatin-based combination chemotherapy [3]. Cluster IV shares features with the claudin-low subtype of breast cancer, express immune checkpoint molecules, and were actively immunosuppressed, despite having an enriched immune gene signature [13]. In particular, Kardos et al. [13] demonstrated that immune infiltration was not correlated with predicted neoantigen burden, but from unopposed NF-kB activity from downregulated PPARγ signaling.
Given the urgent need of alternative approaches in MIBC treatment, there has been a growing interest in immunotherapies, such as those targeting the immune checkpoints: CTLA-4, PD-L1, and PD-1 [14]. Atezolizumab, a PD-L1 inhibitor, has been recently approved by the FDA for bladder cancer that progressed during or following chemotherapy [15]. Evolving evidence based on the success of immune checkpoint blockade therapies in melanoma and non-small cell lung cancer has confirmed the significance of the pre-treatment tumour immune state as a strong prognostic and response predictive indicator [14, 16]. An important feature, key to the success of immunotherapy, is the spatial organization of cytotoxic CD8+ tumour infiltrating lymphocytes (TILs)
in the epithelial and stromal compartments and their activation status [17]. Higher density of CD3+ and CD8+
TILs have been associated with increased disease-free and overall survival in melanoma, head and neck, breast,
bladder, urothelial, ovarian, colorectal, prostatic, and lung cancer; however, their activation status determines their prognostic significance in most cancers [18, 19]. In particular the expression of interferons (IFNs), which play a central role in anti-tumour immune responses, are emerging as prognostic and predictive biomarkers of both chemotherapy and immunotherapy [20]. Higher infiltration with CD4+ and regulatory subsets of TILs
and higher CD68 to CD3 ratios are associated with poor prognosis in bladder cancer [21–23]. In particular PD-L1, IDO, FOXP3, TIM3, and LAG3 are expressed in T-cell-inflamed, and β-catenin, PPAR-γ, and FGFR3 in non-T-cell-inflamed urothelial tumours [17]. Although the pre-treatment expression of PD-1/PD-L1 initially showed some predictive value, it has recently failed to perform as a good biomarker in the recent clinical trials due to their transient nature of expression [23–25].
As reported in other cancers sites, it is likely that the pre-existing tumour immune landscape in UBC could be an additive determinant of response to chemotherapy as well as immune-based therapies leading to more precise prognostication, patient stratification, and informed treatment decisions [26]. To our knowledge there are no previous studies in MIBC that have evaluated the association between immune transcriptomic alterations, specifically those mediated by IFNs and cytotoxic pathway genes, and their potential associations with their distinct molecular sub-populations. In the current study, we performed a comprehensive in silico immune transcriptomic profiling of MIBC using the publicly available TCGA global transcriptomic datasets in order to determine whether the known molecular subtypes of MIBC are associated with specific immune gene signatures. The findings from our study may not only provide insights into the association between genomic subtypes and immune activation, but may also open novel opportunities for improving the management of MIBC.
RESULTS
We aimed to determine whether the previously defined four TCGA MIBC clusters exhibit differences in their immune gene expression patterns that could be of potential significance in informing treatment decisions for immunotherapies and other combinatorial treatment approaches.
Clinicopathological features of TCGA MIBC cohort
The TCGA cohort as reported earlier, consisted of chemotherapy-naïve, muscle-invasive, high-grade urothelial tumors (T2-T4a, Nx, Mx) [6]. Inclusion criteria reviewed by five expert genitourinary pathologists involved: tumour nuclei ≥ 60% of total, ≤20% tumour necrosis in the specimen, and variant histology ≤50% [6].
Immune gene expression patterns across MIBC clusters
First, the 122 samples previously used to identify the four clusters by TCGA [6] were treated as a discovery group to determine immune gene expression profiles across clusters. A total of 377 genes derived from the NanoStringTM panel discriminating among the clusters
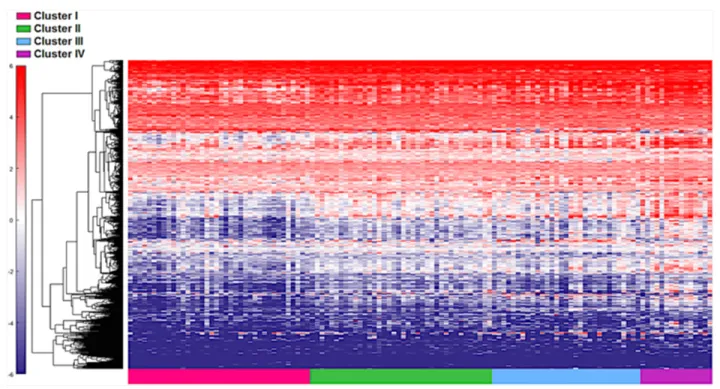
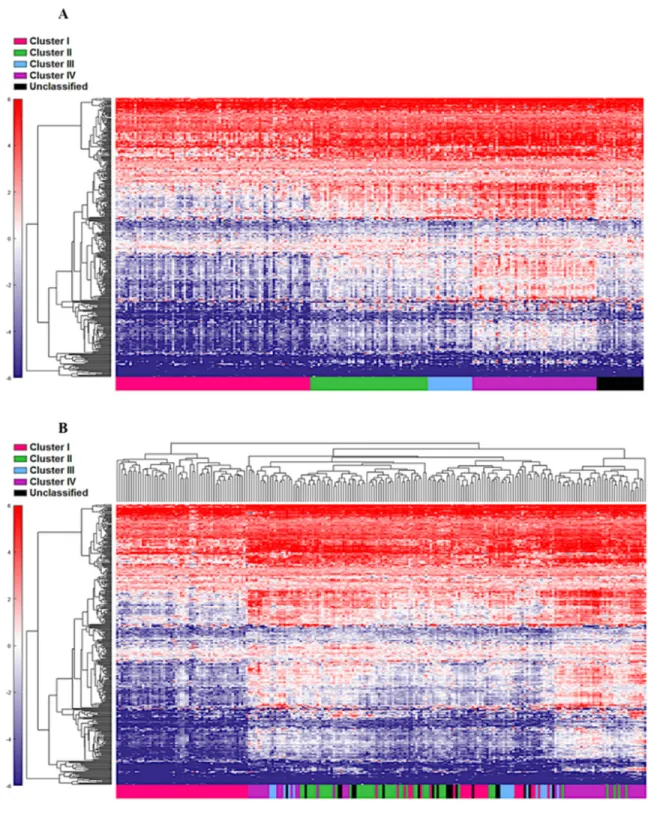
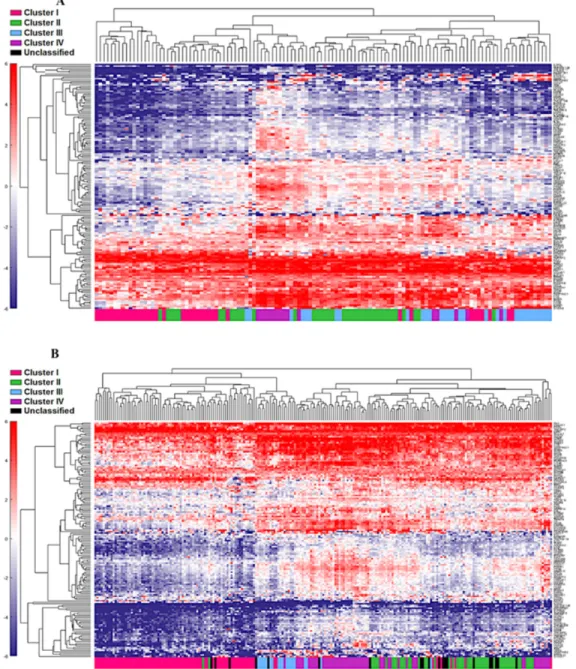
were identified using a feature selection technique (Supplementary Table 1). The performance of these genes to accurately distinguish the four TCGA clusters was evaluated by clustering of cohort 1 (Figure 1). This set of genes was then used to assign samples in the validation set to the four clusters. Similar to cohort 1, the genes were able to distinguish the four clusters in cohort 2 by supervised and unsupervised analysis (Figure 2A and 2B). Similar unsupervised analysis was done using the top 5% of genes derived from all immune panels (n=157) (Supplementary Table 2) on both cohorts (Figure 3A and 3B). A recent updated analysis of the current TCGA bladder tumour cohort shows that clusters I-IV remained stable [28], supporting our classification approach in cohorts 1 and 2.
Differential pre-existing expression patterns of interferon associated genes
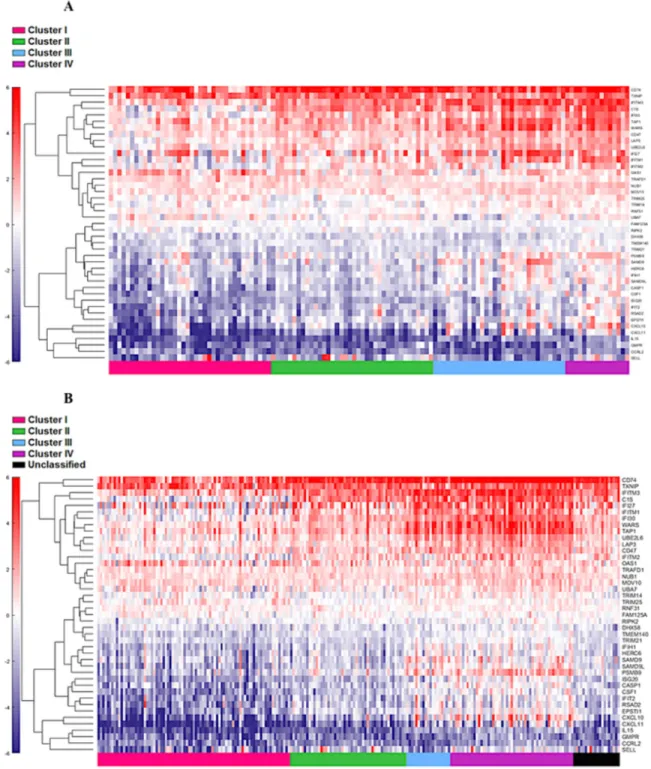
The four cluster patterns were also noted for the top 20% ranking IFN-γ associated genes upon hierarchical clustering analysis in both training and validation cohorts
(Figure 4A and 4B). A gradient of under-expression of IFN-γ associated genes in cluster I to overexpression in cluster IV is observed in both. A similar pattern was also noted in the top 20% ranking IFN-α (Figure 5A and 5B) and cytotoxic genes (Figure 6A and 6B). Most importantly, key IFN response genes and downstream T-cell recruiting target chemokine genes, CXCL9, CXCL10, and CXCL11, and their common receptor CXCR3, showed increased expression in clusters III and IV. Similarly, others in the list included the key players in IFN response such as IFITM2, CCL5, IRF4 and others.
Antigen processing pathways are
overrepresented in T-cell inflamed MIBC clusters
We determined the Gene Ontology functional annotations of the differentially expressed genes that distinguished the four clusters, using both the 377 and 157 genes as input gene lists. Using the overrepresentation statistic in PANTHER, we calculated the probability of highly populated protein classes and gene ontology classes among the two gene lists (Table 2a and 2b). The most enriched GO biological processes in the 377-gene list were response to IFN-γ, antigen processing and presentation, cytokine mediated signaling, hemopoeisis, cell proliferation and cellular defense response (Supplementary Table 3). The top five overrepresented pathways included JAK/STAT signaling pathway, Toll-like receptor signaling pathway, interleukin signalling pathway, and T-cell activation
Figure 1: Distinct immune gene expression levels in cohort 1 (n=122) between the four TCGA bladder cancer subtypes based on the top 20% (377 NanosString panel genes) using the feature selection algorithm. Red indicates high expression, and blue indicates low expression.
(Figure 7). Interestingly, similar analysis using the top ranking 157 genes as input list, revealed only the B-cell activation, T-cell activation, and inflammation mediated by chemokine and cytokine signaling pathways as the only three overrepresented pathways. Response to IFN-γ, hemopoiesis, macrophage activation and cell proliferation were the most overrepresented GO biological processes in the top ranked 157 genes (Supplementary Table 4).
DISCUSSION
Evolving research from correlative studies as well as clinical trials, including those for UBC, have emphasized the value of the pre-existing tumour immune state as a predictor of response to treatment and survival [29, 30]. Furthermore, UBC is associated with a comparatively high mutational burden [31], which could potentially contribute
Figure 2: Cohort 2 (n=225) assigned to clusters based on Euclidian distance to the cluster centroids generated from the cohort 1 (n=122). Supervised (A) and unsupervised (B) analysis based on the samples and 377 NanoStringTM panel genes.
to increased immunogenicity making them more susceptible to novel immunotherapy-based approaches. In order to gain a better understanding of the pre-existing tumour immune landscape in UBC, we conducted a comprehensive in silico immune transcriptomic profiling of the MIBC tumours from the TCGA database.
Four distinct molecular subtypes in MIBC were defined recently based on the TCGA MIBC genome wide profiling datasets [6]. Indeed, variability in subtype nomenclature has been reported [10], which could be attributed to heterogeneity in tissue samples in addition to several other factors such as inclusion of NMIBC cases in classification schemes. However, since the TCGA bladder cohort is enriched for MIBC and gene expression based
clusters have been well defined, we specifically used this cohort to address our question on immune gene expression patterns associated with genomic alterations. Based on the distinct immune signature between clusters in cohort 1 (n=122), we were able to assign cohort 2 (n=225) into the associated TCGA clusters using the top 20% of ranked immune genes from the training cohort. Further analysis on the IFN-γ, IFN-α, and cytotoxic genes were then compared in both cohorts. All of these analyses revealed an increased expression of immune-associated genes in Cluster IV and underactive immune environment in Cluster I. Given that specific genetic alterations associate with these molecular subtypes, it seems that anti-tumour immune responses could be partly driven by oncogenic drivers.
Figure 3: Unsupervised analysis of both the cohort 1(A) and cohort 2 (B) using the top 5% (n=157) genes. Unsupervised grouping shows
Cluster I has been previously reported to show higher expression of FGFR3 via mutations, amplifications, and other mechanisms [3]. Interestingly this cluster showed a distinct underactive tumour immune state with reduced expression of IFN genes and genes associated with T-helper type-1 response. It is indeed intriguing that tumours with FGFR3 mutations or overexpression as per previous classification [6], show an increased overall survival, which contradicts the underactive immune state observed here. In contrast, cases in cluster
IV showed the most dominant immune response amongst all four clusters. Tumours in this cluster show decreased expression of PPAR-γ and GATA3, and significantly increased expression of IFN and antigen presentation pathway genes, in addition to MHC class II genes and those involved in T-cell cytolytic activity. Previous reports have shown that based on broader classifications, cases in cluster IV belong to the basal subtype, which shows poor overall survival [8], [9]. One potential contributor to these associations is the increased expression of immune
checkpoint molecules such as CD274 (PD-L1), IDO1 and the immunosuppressive IL6 in clusters III and IV that potentially lead to increased resistance to cytotoxic killing and poor response to treatment and ultimately poor survival. As previously shown, this cluster also shows higher levels of EMT related genes, indicating more aggressive tumour phenotype [33]. Our recent report demonstrating that higher PD-L1 expression in cancer cells leads to increased drug resistance upon activation
by IFN-γ or PD-1 [32] supports this notion. It could thus be speculated that the IFN-γ secreted by activated T-cells, reflected by the increased expression of GZMA in these clusters, could be inducing PD-L1 on the cancer cells with further interaction between these leading to T-cell dysfunction. However, the mechanistic basis of these significant associations needs to be explored further. In other cancers such as melanoma, colorectal, and ovarian, higher expression of IFN pathway genes and of those
representing an active immune response is associated with a favourable treatment outcome and overall survival. Furthermore, it is also possible that factors other than anti-tumour immune responses contribute to increased survival rates in tumours with FGFR3 mutations in MIBC.
Increased expression of MHC class II genes CD74, HLA-DMB, and HLA-DQA1 indicate higher tumour antigen processing by the antigen presenting cells in clusters III and IV. This was also confirmed by gene
ontology-based analysis, which reflected a dominance of response to IFN-γ, antigen processing and presentation, cytokine mediated signaling, and cell proliferation, NK cell and macrophage activation, and B cell mediated immunity. These enrichments not only confirm the increased active anti-tumour immune response in clusters IV and some of cluster III but also indicate the immunogenic nature of these clusters that could be potentially be driven by higher mutational burden and recognition of immune cells.
Overall, our findings based on comprehensive immune transcriptomic analysis have significant implications in informing treatment decisions based on immune gene expression patterns. Specifically, since immune checkpoint blockade therapy has shown some promise in bladder cancer [15], near future biomarker driven clinical trials will benefit from these findings that emphasize appropriate patient stratification for treatment. Although recent reports have described the presence of T-cell inflamed and non-inflamed MIBC tumours [17, 33], no previous reports have identified associations between immune response and IFN-associated genes with the four molecular MIBC subtypes. Our study is limited by the fact that the TCGA dataset is enriched for MIBC and thus further validations in other cohorts need to be performed;
however, these associations are timely and complement the ongoing and future clinical trials based on immune-based therapies. Clinical translation of our findings will most appropriately be addressed by validation of the most significant differentially expressed genes at both transcriptional and proteomic levels in retrospective and prospective pre-treatment bladder tumour specimens. Future investigations by integration of genomic alterations determined by exome and transcriptome sequencing data are key to identifying the genomic determinants of variability in immune response. Finally our study provides an improved understanding of the bladder cancer molecular subtype associated immune gene expression patterns and will significantly impact the design of novel immune based therapies.
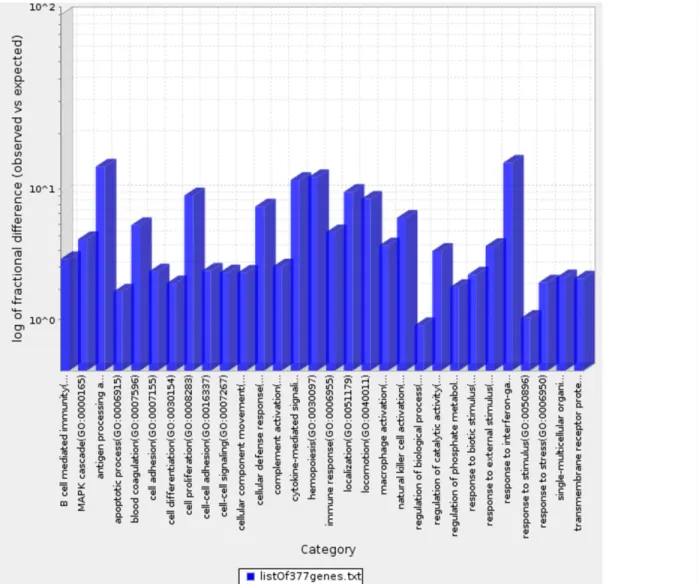
Figure 7: Bar graph depicting distribution of fold enrichment levels of biological pathways defined by PANTHER based analysis in the 377 genes that show differential expression patterns in the four TCGA MIBC clusters. The enriched categories were obtained upon analysis using the statistical overrepresentation test defined by PANTHER tool [27].
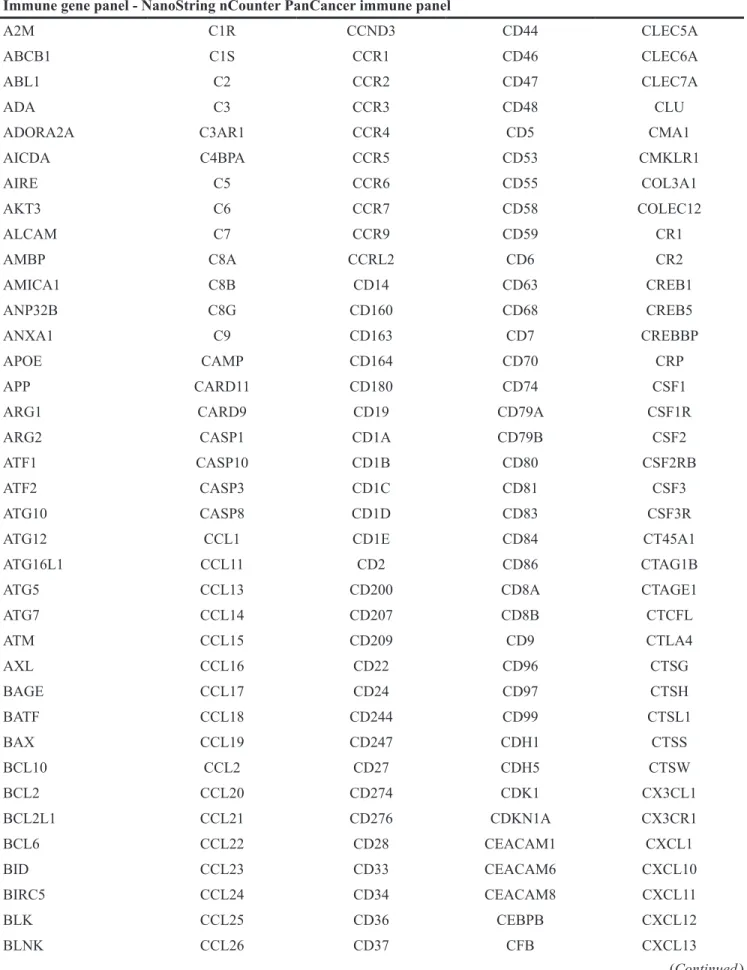
Table 1: Custom designed immune gene panel of 924 genes, consisting of IFN-α and IFN-γ pathway genes from GSEA and immune response genes defined by the NanoString nCounter PanCancer immune Pathways Panel
Immune gene panel - NanoString nCounter PanCancer immune panel
A2M C1R CCND3 CD44 CLEC5A
ABCB1 C1S CCR1 CD46 CLEC6A
ABL1 C2 CCR2 CD47 CLEC7A
ADA C3 CCR3 CD48 CLU
ADORA2A C3AR1 CCR4 CD5 CMA1
AICDA C4BPA CCR5 CD53 CMKLR1 AIRE C5 CCR6 CD55 COL3A1 AKT3 C6 CCR7 CD58 COLEC12 ALCAM C7 CCR9 CD59 CR1 AMBP C8A CCRL2 CD6 CR2 AMICA1 C8B CD14 CD63 CREB1 ANP32B C8G CD160 CD68 CREB5 ANXA1 C9 CD163 CD7 CREBBP APOE CAMP CD164 CD70 CRP APP CARD11 CD180 CD74 CSF1
ARG1 CARD9 CD19 CD79A CSF1R
ARG2 CASP1 CD1A CD79B CSF2
ATF1 CASP10 CD1B CD80 CSF2RB
ATF2 CASP3 CD1C CD81 CSF3
ATG10 CASP8 CD1D CD83 CSF3R
ATG12 CCL1 CD1E CD84 CT45A1
ATG16L1 CCL11 CD2 CD86 CTAG1B
ATG5 CCL13 CD200 CD8A CTAGE1
ATG7 CCL14 CD207 CD8B CTCFL ATM CCL15 CD209 CD9 CTLA4 AXL CCL16 CD22 CD96 CTSG BAGE CCL17 CD24 CD97 CTSH BATF CCL18 CD244 CD99 CTSL1 BAX CCL19 CD247 CDH1 CTSS BCL10 CCL2 CD27 CDH5 CTSW BCL2 CCL20 CD274 CDK1 CX3CL1 BCL2L1 CCL21 CD276 CDKN1A CX3CR1 BCL6 CCL22 CD28 CEACAM1 CXCL1 BID CCL23 CD33 CEACAM6 CXCL10 BIRC5 CCL24 CD34 CEACAM8 CXCL11 BLK CCL25 CD36 CEBPB CXCL12 BLNK CCL26 CD37 CFB CXCL13 (Continued )
BMI1 CCL27 CD38 CFD CXCL14 BST1 CCL28 CD3D CFI CXCL16 BST2 CCL3 CD3E CFP CXCL2 BTK CCL3L1 CD3EAP CHIT1 CXCL3 BTLA CCL4 CD3G CHUK CXCL5 C1QA CCL5 CD4 CKLF CXCL6 C1QB CCL7 CD40 CLEC4A CXCL9 C1QBP CCL8 CD40LG CLEC4C CXCR1
CXCR2 FOS IFI27 IL19 IRAK4
CXCR3 FOXJ1 IFI35 IL1A IRF1
CXCR4 FOXP3 IFIH1 IL1B IRF2
CXCR5 FPR2 IFIT1 IL1R1 IRF3
CXCR6 FUT5 IFIT2 IL1R2 IRF4
CYBB FUT7 IFITM1 IL1RAP IRF5
CYFIP2 FYN IFITM2 IL1RAPL2 IRF7
CYLD GAGE1 IFNA1 IL1RL1 IRF8
DDX43 GATA3 IFNA17 IL1RL2 IRGM
DDX58 GNLY IFNA2 IL1RN ISG15
DEFB1 GPI IFNA7 IL2 ISG20
DMBT1 GPR44 IFNA8 IL21 ITCH
DOCK9 GTF3C1 IFNAR1 IL21R ITGA1
DPP4 GZMA IFNAR2 IL22 ITGA2
DUSP4 GZMB IFNB1 IL22RA1 ITGA2B
DUSP6 GZMH IFNG IL22RA2 ITGA4
EBI3 GZMK IFNGR1 IL23A ITGA5
ECSIT GZMM IGF1R IL23R ITGA6
EGR1 HAMP IGF2R IL24 ITGAE
EGR2 HAVCR2 IGLL1 IL25 ITGAL
ELANE HCK IKBKB IL26 ITGAM
ELK1 HLA-A IKBKE IL27 ITGAX
ENG HLA-B IKBKG IL28A ITGB1
ENTPD1 HLA-C IL10 IL29 ITGB2
EOMES HLA-DMA IL10RA IL2RA ITGB3
EP300 HLA-DMB IL11 IL2RB ITGB4
EPCAM HLA-DOB IL11RA IL2RG ITK
ETS1 HLA-DPA1 IL12A IL3 JAK1
EWSR1 HLA-DPB1 IL12B IL32 JAK2
F12 HLA-DQA1 IL12RB1 IL34 JAK3
F13A1 HLA-DQB1 IL12RB2 IL3RA JAM3
F2RL1 HLA-DRA IL13 IL4 KIR2DL1
FADD HLA-E IL13RA1 IL4R KIR2DL3
FAS HLA-G IL13RA2 IL5 KIR3DL1
FCER1A HMGB1 IL15 IL5RA KIR3DL2
FCER1G HRAS IL15RA IL6 KIR3DL3
FCER2 HSD11B1 IL16 IL6R KIT
FCGR1A ICAM1 IL17A IL6ST KLRB1
FCGR2A ICAM2 IL17B IL7 KLRC1
FCGR2B ICAM3 IL17F IL7R KLRC2
FCGR3A ICAM4 IL17RA IL9 KLRD1
FEZ1 ICOS IL17RB ILF3 KLRF1
FLT3 ICOSLG IL18 INPP5D KLRG1
FLT3LG IDO1 IL18R1 IRAK1 KLRK1
FN1 IFI16 IL18RAP IRAK2 LAG3
LAIR2 MAPK3 NT5E RELB STAT2
LAMP1 MAPK8 NUP107 REPS1 STAT3
LAMP2 MAPKAPK2 OAS3 RIPK2 STAT4
LAMP3 MARCO OSM ROPN1 STAT5B
LBP MASP1 PASD1 RORA STAT6
LCK MASP2 PAX5 RORC SYCP1
LCN2 MAVS PBK RPS6 SYK
LCP1 MBL2 PDCD1 RRAD SYT17
LGALS3 MCAM PDCD1LG2 RUNX1 TAB1
LIF MEF2C PDGFC RUNX3 TAL1
LILRA1 MEFV PDGFRB S100A12 TANK
LILRA4 MERTK PECAM1 S100A7 TAP1
LILRA5 MFGE8 PIK3CD S100A8 TAP2
LILRB1 MICA PIK3CG S100B TAPBP
LILRB2 MICB PIN1 SAA1 TARP
LILRB3 MIF PLA2G1B SBNO2 TBK1
LRP1 MME PLA2G6 SELE TBX21
LRRN3 MNX1 PLAU SELL TCF7
LTA MPPED1 PLAUR SELPLG TFE3
LTB MR1 PMCH SEMG1 TFEB
LTBR MRC1 PNMA1 SERPINB2 TFRC
LTF MS4A1 POU2AF1 SERPING1 TGFB1
LTK MS4A2 POU2F2 SH2B2 TGFB2
LY86 MSR1 PPARG SH2D1A THBD
LY9 MST1R PPBP SH2D1B THBS1
LY96 MUC1 PRAME SIGIRR THY1
LYN MX1 PRF1 SIGLEC1 TICAM1
MAF MYD88 PRG2 SLAMF1 TICAM2
MAGEA1 NCAM1 PRKCD SLAMF6 TIGIT
MAGEA12 NCF4 PRKCE SLAMF7 TIRAP
MAGEA3 NCR1 PRM1 SLC11A1 TLR1
MAGEA4 NEFL PSEN1 SMAD2 TLR10
MAGEB2 NFATC1 PSEN2 SMAD3 TLR2
MAGEC1 NFATC2 PSMB10 SMPD3 TLR3
MAGEC2 NFATC3 PSMB7 SOCS1 TLR4
MAP2K1 NFATC4 PSMB8 SPA17 TLR5
MAP2K2 NFKB1 PSMB9 SPACA3 TLR6
MAP2K4 NFKB2 PSMD7 SPINK5 TLR7
MAP3K1 NFKBIA PTGS2 SPN TLR8
MAP3K5 NLRC5 PTPRC SPO11 TLR9
MAP3K7 NLRP3 PVR SPP1 TMEFF2
MAP4K2 NOD1 PYCARD SSX1 TNF
MAPK1 NOD2 RAG1 SSX4 TNFAIP3
MAPK11 NOTCH1 REL ST6GAL1 TNFRSF10B
MAPK14 NRP1 RELA STAT1 TNFRSF10C
TNFRSF11A TNFRSF4 TNFSF18 TREM1 VEGFA
TNFRSF11B TNFRSF8 TNFSF4 TREM2 VEGFC
TNFRSF12A TNFRSF9 TNFSF8 TTK XCL2
TNFRSF13B TNFSF10 TOLLIP TXK XCR1
TNFRSF13C TNFSF11 TP53 TXNIP YTHDF2
TNFRSF14 TNFSF12 TPSAB1 TYK2 ZAP70
TNFRSF17 TNFSF13 TPTE UBC ZNF205
TNFRSF18 TNFSF13B TRAF2 ULBP2
TNFRSF1A TNFSF14 TRAF3 USP9Y
TNFRSF1B TNFSF15 TRAF6 VCAM1
Immune gene panel – IFN-γ associated genes
ADAR CSF2RB IFI44 LGALS3BP PNP
APOL6 CXCL10 IFI44L LY6E PNPT1
ARID5B CXCL11 IFIH1 LYSMD2 PRIC285
ARL4A CXCL9 IFIT1 MAR-01 PSMA2
AUTS2 DDX58 IFIT2 METTL7B PSMA3
B2M DDX60 IFIT3 MT2A PSMB10
BANK1 DHX58 IFITM2 MTHFD2 PSMB2
BATF2 EIF2AK2 IFITM3 MVP PSMB8
BPGM EIF4E3 IFNAR2 MX1 PSMB9
BST2 EPSTI1 IL10RA MX2 PSME1
BTG1 FAS IL15 MYD88 PSME2
C1R FCGR1A IL15RA NAMPT PTGS2
C1S FGL2 IL18BP NCOA3 PTPN1
CASP1 FPR1 IL2RB NFKB1 PTPN2
CASP3 FTSJD2 IL4R NFKBIA PTPN6
CASP4 GBP4 IL6 NLRC5 RAPGEF6
CASP7 GBP6 IL7 NMI RBCK1
CASP8 GCH1 IRF1 NOD1 RIPK1
CCL2 GPR18 IRF2 NUP93 RIPK2
CCL5 GZMA IRF4 OAS2 RNF213
CCL7 HERC6 IRF5 OAS3 RNF31
CD274 HIF1A IRF7 OASL RSAD2
CD38 HLA-A IRF8 OGFR RTP4
CD40 HLA-B IRF9 P2RY14 SAMD9L
CD69 HLA-DMA ISG15 PARP12 SAMHD1
CD74 HLA-DQA1 ISG20 PARP14 SECTM1
CD86 HLA-DRB1 ISOC1 PDE4B SELP
CDKN1A HLA-G ITGB7 PELI1 SERPING1
CFB ICAM1 JAK2 PFKP SLAMF7
CFH IDO1 KLRK1 PIM1 SLC25A28
CIITA IFI27 LAP3 PLA2G4A SOCS1
CMKLR1 IFI30 LATS2 PLSCR1 SOCS3
CMPK2 IFI35 LCP2 PML SOD2
SP110 STAT2 TNFAIP3 TRIM25 VAMP8
SPPL2A STAT3 TNFAIP6 TRIM26 VCAM1
SRI STAT4 TNFSF10 TXNIP WARS
SSPN TAP1 TOR1B UBE2L6 XAF1
ST3GAL5 TAPBP TRAFD1 UPP1 XCL1
ST8SIA4 TDRD7 TRIM14 USP18 ZBP1
STAT1 TNFAIP2 TRIM21 VAMP5 ZNFX1
Immune gene panel – IFN-α associated genes
ADAR FAM125A IL4R OGFR SLC25A28
B2M FAM46A IL7 PARP12 SP110
BATF2 FTSJD2 IRF1 PARP14 STAT2
BST2 GBP2 IRF2 PARP9 TAP1
C1S GBP4 IRF7 PLSCR1 TDRD7
CASP1 GMPR IRF9 PNPT1 TMEM140
CASP8 HERC6 ISG15 PRIC285 TRAFD1
CCRL2 HLA-C ISG20 PROCR TRIM14
CD47 IFI27 LAMP3 PSMA3 TRIM21
CD74 IFI30 LAP3 PSMB8 TRIM25
CMPK2 IFI35 LGALS3BP PSMB9 TRIM26
CNP IFI44 LPAR6 PSME1 TRIM5
CSF1 IFI44L LY6E PSME2 TXNIP
CXCL10 IFIH1 MOV10 RIPK2 UBA7
CXCL11 IFIT2 MX1 RNF31 UBE2L6
DDX60 IFIT3 NCOA7 RSAD2 USP18
DHX58 IFITM1 NMI RTP4 WARS
EIF2AK2 IFITM2 NUB1 SAMD9
ELF1 IFITM3 OAS1 SAMD9L
EPSTI1 IL15 OASL SELL
Immune gene panel – cytotoxic associated genes
ABCB1 CCL8 CTLA4 FFAR3 HERC6
ADAM19 CCR5 CXCL10 FUT2 HESX1
ADAM3A CD163L1 CXCL11 GAS6 HS3ST3B1
ADORA3 CD28 CXCL9 GBP6 IDO1
ANKRD22 CD300E DNA2 GIMAP4 IFNB1
APOL3 CD38 DPCD GIMAP5 IFNG
ARNT2 CD5 ENPP2 GIMAP7 IL10
ATF5 CD8A F13A1 GIMAP8 IL12RB2
BATF2 CDC7 F2R GNLY IL15
BCL2 CDK6 FAM20A GPR171 IL15RA
BCL2L14 CH25H FAM26F GZMB IL21
C5orf39 CMKLR1 FAM40B GZMK IL2RA
CASC5 CMPK2 FBXO39 HAMP IL4I1
CCL7 CRABP1 FCGR2B HAPLN3 IRF4
ISG15 MYBL1 PRKCQ SDS TMEM229B
ITGA9 NKG7 PTGER2 SH2D1A TNFSF18
KIAA1199 OR2A5 RGL1 SLA2 TRAT1
KLHDC1 OR5D14 RHBDF2 SLAMF1 TSHZ3
KLRD1 OR6K6 RNASE2 SMOX TXK
LILRB5 P2RX5 RRM2 SOCS1 TYMS
MERTK PLEKHO1 RTP4 SSTR2 USP18
MKI67 PRF1 RUNX3 STAB1
Table 2: Gene Ontology classes enriched in the overall 377 genes (a) and 157 top ranked genes (b) GO categories defined by PANTHER pathway tool [27, 33]
Table 2a
Analysis Type: PANTHER Overrepresentation Test (release 20160715) Annotation Version and
Release Date: PANTHER version 11.1 Released 2016-10-24 Analyzed List: 377genes (Homo sapiens)
Reference List: Homo sapiens (all genes in database) Bonferroni correction: TRUE
Bonferroni count: 158
PANTHER Pathways Homo sapiens - REFLIST (20972)
377genes
(385) (expected)377genes 377genes (over/under) 377 genes (fold Enrichment) 377genes (P-value) JAK/STAT signaling
pathway (P00038) 17 6 0.31 + 19.23 1.50E-04
Toll receptor signaling
pathway (P00054) 60 21 1.1 + 19.07 5.00E-18 Interleukin signaling pathway (P00036) 98 23 1.8 + 12.78 4.53E-16 T cell activation (P00053) 96 22 1.76 + 12.48 4.03E-15 B cell activation (P00010) 72 15 1.32 + 11.35 1.83E-09 p38 MAPK pathway (P05918) 42 7 0.77 + 9.08 2.49E-03 Apoptosis signaling pathway (P00006) 122 20 2.24 + 8.93 5.24E-11 Inflammation mediated by chemokine and cytokine signaling pathway (P00031) 261 36 4.79 + 7.51 3.53E-18 Blood coagulation (P00011) 47 6 0.86 + 6.95 4.23E-02
VEGF signaling pathway
(P00056) 72 8 1.32 + 6.05 1.08E-02
Ras Pathway (P04393) 76 8 1.4 + 5.73 1.56E-02
CCKR signaling map (P06959) 173 17 3.18 + 5.35 6.02E-06 p53 pathway (P00059) 88 8 1.62 + 4.95 4.19E-02 Angiogenesis (P00005) 176 16 3.23 + 4.95 4.23E-05 Integrin signalling pathway (P00034) 192 17 3.52 + 4.82 2.59E-05
EGF receptor signaling
pathway (P00018) 139 11 2.55 + 4.31 1.07E-02 Gonadotropin-releasing hormone receptor pathway (P06664) 235 15 4.31 + 3.48 6.36E-03 Unclassified (UNCLASSIFIED) 18333 232 336.55 - 0.69 0.00E+00
Table 2b
Analysis Type: PANTHER Overrepresentation Test (release 20160715) Annotation
Version and
Release Date: PANTHER version 11.1 Released 2016-10-24 Analyzed List: 157 genes (Homo sapiens)
Reference List: Homo sapiens (all genes in database) Bonferroni
correction: TRUE
Bonferroni count: 158
PANTHER
Pathways REFLIST (20972)Homo sapiens -
157 genes Input (158) 157 genes Input (expected) 157 genes Input (over/under) 157 genes Input (fold Enrichment) 157 genes Input (P-value) JAK/STAT signaling pathway (P00038) 17 3 0.13 + 23.42 4.94E-02 Interleukin signaling pathway (P00036) 98 9 0.74 + 12.19 1.20E-05 B cell activation (P00010) 72 6 0.54 + 11.06 3.25E-03 Toll receptor signaling pathway (P00054) 60 5 0.45 + 11.06 1.62E-02 T cell activation (P00053) 96 7 0.72 + 9.68 1.55E-03 Inflammation mediated by chemokine and cytokine signaling pathway (P00031) 261 12 1.97 + 6.1 1.34E-04 Integrin signalling pathway (P00034) 192 8 1.45 + 5.53 1.86E-02 Unclassified (UNCLASSIFIED) 18333 96 138.12 - 0.7 0.00E+00
MATERIALS AND METHODS
Patient tumour samples
The publicly available global transcriptomic sequencing (RNA-Seq) data from 412 MIBC cases, with the corresponding clinical information was downloaded from TCGA data portal (https://gdc-portal.nci.nih.gov/), now part of the National Cancer Institute’s Genetic Data Commons. The cohort was further divided into two cohorts for downstream analysis. For our training cohort (cohort 1) we used data from the previously defined 129 cases from TCGA that were divided into four clusters based on their integrated
analysis of mRNA, miRNA, and protein data [6]. Since our objective was to define immune gene expression patterns in treatment naïve tumours, we excluded patients with any previous therapy. Thus a cohort of 122 MIBC cases, divided into four molecular clusters, was used for in silico immune profiling. The remaining 283 cases constituted the validation cohort (cohort 2) of which 225 had no prior therapy.
Design of immune pathway gene panel for in
silico immune profiling
To investigate the presence of subtype associated immune signatures, we assembled a defined set of 924
immune related genes. This curated list (Table 1) primarily consisted of genes involved in IFN-α (97 genes), IFN-γ (200 genes), and cytotoxic (115 genes) pathways as defined by Gene Set Enrichment Analysis (GSEA) in combination with other immune genes. The nCounter PanCancer Immune profiling panel (722 genes), (http:// www.nanostring.com/products/pancancer_immune/) was used to derive the immune response related genes.
Bioinformatics analysis of RNA-Seq data
We used the upper quartile-normalized RNA-seq data by expectation maximization (RSEM) available for all selected cases at the TCGA data portal. No additional normalization was performed and the expression data were log2 transformed. All downstream data analysis was performed in MATLAB (Mathworks, Inc., Natick, Massachusetts, USA). Focusing on the first set of 122 samples, where clustering information is known, we performed separate analyses of the genes in each of the four immune panels (NanoStringTM, IFN-α, IFN-γ, and T
cell cytotoxicity associated genes). Using a feature selection algorithm, genes were ranked based on their ability to discriminate samples belonging to one cluster from the remaining. The feature selection algorithm uses an ensemble of five different machine-learning techniques (unpublished). The analysis resulted in 16 ranking tables, four tables for each immune panel, where each table ranked genes on their ability to discriminate samples in one cluster from the rest.
In the hierarchical clustering analysis, the top 20% of genes in each ranking group were assembled to represent each immune panel, resulting in 377 genes (Nanostring), 44 genes (IFN-α), 91 genes (IFN-γ), and 62 genes (T cell cytotoxicity). A final feature selection ranking was performed where the combined unique set of 924 genes was used. The top 5% of genes in each of the four ranking groups were then merged, resulting in 157 unique genes.
Gene ontology analysis using PANTHER
We used the Protein Analysis Through Evolutionary Relationships (PANTHER), version 11.0, classification system (http://www.pantherdb.org/) [27] to determine dominant and enriched pathways in the top ranking 377 genes (NanoString panel) that were ranked based on their ability to discriminate samples across the four clusters. We then applied the statistical binomial overrepresentation test, as previously described in PANTHER [27], to derive the most dominant enriched pathways and gene ontology (GO) biological processes in our lists compared to the reference human genome. We performed these tests using both the 377 top ranking NanoStringTM genes and
157 top ranked genes from all immune panels combined. The p-values were corrected for multiple testing using Bonferroni correction.
Validation of immune gene signature
The remaining 298 cases, not included in cohort 1, were treated as a validation group. From this cohort, patients with previous BCG therapy were excluded, leaving 225 cases. In order to assign samples in this set to each of the four clusters, only the top ranked 377 genes from the NanoString panel were used. First, for each cluster, two cluster centroids were computed using the expression data from cohort 1 (n=122; total of 8 cluster centroids). The cluster centroids were computed by taking the mean expression of samples in a given cluster (main cluster) and the mean expression of samples that do not belong to that cluster (alternative cluster). Then, for each sample in cohort 2, the Euclidean distance was computed to each of the 8 cluster centroids. A sample was assigned to a cluster with the smallest distance to the main cluster, but only if the distance to the main cluster was smaller than the distance to the alternative cluster. Alternatively, the sample was assigned to the ‘unclassified’ cluster. Using the newly assigned clustering information and ranked list of genes, unsupervised hierarchical clustering was performed.
ACKNOWLEDGMENTS
This study was supported by a South Eastern Ontario Academic Medical Organization Innovation grant awarded to D. Robert Siemens.
CONFLICTS OF INTEREST
All authors have no potential conflicts of interest.
REFERENCES
1. Canadian Cancer Society’s Advisory Committee on Cancer Statistics. Canadian Cancer Statistics 2015. Toronto, Can Cancer Soc. 2015.
2. Mertens LS, Neuzillet Y, Horenblas S, van Rhijn BW. Landmarks in non-muscle-invasive bladder cancer. Nat Rev Urol. 2014; 11:476–80. https://doi.org/10.1038/ nrurol.2014.130.
3. Choi W, Porten S, Kim S, Willis D, Plimack ER, Hoffman-Censits J, Roth B, Cheng T, Tran M, Lee IL, Melquist J, Bondaruk J, Majewski T, et al. Identification of distinct basal and luminal subtypes of muscle-invasive bladder cancer with different sensitivities to frontline chemotherapy. Cancer Cell. 2014; 25:152–65. https://doi.org/10.1016/j. ccr.2014.01.009.
4. Mitra AP, Quinn DI, Dorff TB, Skinner EC, Schuckman AK, Miranda G, Gill IS, Daneshmand S. Factors influencing post-recurrence survival in bladder cancer following
radical cystectomy. BJU Int. 2012; 109:846–54. https://doi. org/10.1111/j.1464-410X.2011.10455.x.
5. McConkey DJ, Choi W, Dinney CP. New insights into subtypes of invasive bladder cancer: considerations of the clinician. Eur Urol. 2014; 66:609–10. https://doi. org/10.1016/j.eururo.2014.05.006.
6. The Cancer Genome Atlas Research Network. Comprehensive molecular characterization of urothelial bladder carcinoma. Nature. 2014; 507:315–22. https://doi. org/10.1038/nature12965.
7. Sjodahl G, Lauss M, Lovgren K, Chebil G, Gudjonsson S, Veerla S, Patschan O, Aine M, Fernö M, Ringnér M, Månsson W, Liedberg F, Lindgren D, Höglund M. A molecular taxonomy for urothelial carcinoma. Clin Cancer Res. 2012; 18:3377–86. https://doi.org/10.1158/1078-0432. CCR-12-0077-T.
8. Damrauer JS, Hoadley KA, Chism DD, Fan C, Tiganelli CJ, Wobker SE, Yeh JJ, Milowsky MI, Iyer G, Parker JS, Kim WY. Intrinsic subtypes of high-grade bladder cancer reflect the hallmarks of breast cancer biology. Proc Natl Acad Sci U S A. 2014; 111:3110–5. https://doi.org/10.1073/ pnas.1318376111.
9. Knowles MA, Hurst CD. Molecular biology of bladder cancer: new insights into pathogenesis and clinical diversity. Nat Rev Cancer. 2015; 15:25–41.
10. Dadhania V, Zhang M, Zhang L, Bondaruk J, Majewski T, Siefker-Radtke A, Guo C, Dinney C, Cogdell DE, Zhang S, Lee S, Lee JG, Weinstein JN, et al. Meta-analysis of the luminal and basal subtypes of bladder cancer and the identification of signature immunohistochemical markers for clinical use. EBioMedicine. 2016; 12:105–17. https:// doi.org/10.1016/j.ebiom.2016.08.036.
11. Kamat AM, Hahn NM, Efstathiou JA, Lerner SP, Malmström PU, Choi W, Guo CC, Lotan Y, Kassouf W. Bladder cancer. Lancet. 2016; 6736:1–15. https://doi. org/10.1016/S0140-6736(16)30512-8.
12. McConkey DJ, Choi W, Dinney CP. Genetic subtypes of invasive bladder cancer. Curr Opin Urol. 2015; 25:449–58. https://doi.org/10.1097/MOU.0000000000000200. 13. Kardos J, Chai S, Mose LE, Selitsky SR, Krishnan B, Saito
R, Iglesia MD, Milowsky MI, Parker JS, Kim WY, Vincent BG. Claudin-low bladder tumors are immune infiltrated and actively immune suppressed. JCI Insight. 2016; 1:e85902. https://doi.org/10.1172/jci.insight.85902.
14. Pardoll DM. The blockade of immune checkpoints in cancer immunotherapy. Nat Rev Cancer. 2012; 12:252–64. 15. Rosenberg JE, Hoffman-Censits J, Powles T, van der
Heijden MS, Balar AV, Necchi A, Dawsonon N, O'Donnell PH, Balmanoukian A, Loriot Y, Srinivas S, Retz MM, Grivas P, et al. Atezolizumab in patients with locally advanced and metastatic urothelial carcinoma who have progressed following treatment with platinum-based chemotherapy: a single-arm, multicentre, phase 2 trial.
Lancet. 2016; 387:1909–20. https://doi.org/10.1016/ S0140-6736(16)00561-4.
16. El-Osta H, Shahid K, Mills GM, Peddi P. Immune checkpoint inhibitors: the new frontier in non-small-cell lung cancer treatment. Onco Targets Ther. 2016; 9:5101–16. https://doi.org/10.2147/OTT.S111209.
17. Sweis RF, Spranger S, Bao R, Paner GP, Stadler WM, Steinberg GD, Gajewski TF. Molecular drivers of the non-T cell-inflamed tumor microenvironment in urothelial bladder cancer. Cancer Immunol Res. 2016:1–7. https://doi. org/10.1158/2326-6066.CIR-15-0274.
18. Fridman WH, Pagès F, Sautès-Fridman C, Galon J. The immune contexture in human tumours: impact on clinical outcome. Nat Rev Cancer. 2012; 12:298–306.
19. Sharma P, Shen Y, Wen S, Yamada S, Jungbluth AA, Gnjatic S, Bajorin DF, Reuter VE, Herr H, Old LJ, Sato E. CD8 tumor-infiltrating lymphocytes are predictive of survival in muscle-invasive urothelial carcinoma. Proc Natl Acad Sci U S A. 2007; 104:3967–72. https://doi.org/10.1073/ pnas.0611618104.
20. Yuan J, Hegde PS, Clynes R, Foukas PG, Harari A, Kleen TO, Kvistborg P, Maccalli C, Maecker HT, Page DB, Robins H, Song W, Stack EC, et al. Novel technologies and emerging biomarkers for personalized cancer immunotherapy. J Immunother Cancer. 2016; 4:3. https:// doi.org/10.1186/s40425-016-0107-3.
21. Sjödahl G, Lövgren K, Lauss M, Chebil G, Patschan O, Gudjonsson S, Månsson W, Fernö M, Leandersson K, Lindgren D, Liedberg F, Höglund M. Infiltration of CD3+ and CD68+ cells in bladder cancer is subtype specific and affects the outcome of patients with muscle-invasive tumors. Urol Oncol. 2016; 32:791–7. https://doi. org/10.1016/j.urolonc.2014.02.007.
22. Zhang Q, Hao C, Cheng G, Wang L, Wang X, Li C, Qiu J, Ding K. High CD4(+) T cell density is associated with poor prognosis in patients with non-muscle-invasive bladder cancer. Int J Clin Exp Pathol. 2015; 8:11510–6.
23. Meng X, Huang Z, Teng F, Xing L, Yu J. Predictive biomarkers in PD-1/PD-L1 checkpoint blockade immunotherapy. Cancer Treat Rev. 2015; 41:868–76. https://doi.org/10.1016/j.ctrv.2015.11.001.
24. Spranger S, Sivan A, Corrales L, Gajewski TF. Tumor and host factors controlling antitumor immunity and efficacy of cancer immunotherapy. Adv Immunol. 2016; 130:1–17. https://doi.org/10.1016/bs.ai.2015.12.003.
25. Pitt JM, Vetizou M, Daillere R, Roberti MP, Yamazaki T, Routy B, Lepage P, Boneca IG, Chamaillard M, Kroemer G, Zitvogel L. Resistance mechanisms to immune-checkpoint blockade in cancer: tumor-intrinsic and -extrinsic factors. Immunity. 2016; 44:1255–69. https://doi.org/10.1016/j. immuni.2016.06.001.
26. Au KK, Le Page C, Ren R, Meunier L, Clément I, Tryshkin K, Peterson N, Kendall-Dupont J, Childs T, Francis JA, Graham CH, Craig AW, Squire JA, et al. STAT1-associated
intratumoural TH1 immunity predicts chemotherapy resistance in high-grade serous ovarian cancer. J Pathol Clin Res. 2016; 2:259–70. https://doi.org/10.1002/cjp2.55. 27. Mi H, Muruganujan A, Casagrande JT, Thomas PD.
Large-scale gene function analysis with the PANTHER classification system. Nat Protoc. 2013; 8:1551–66. https:// doi.org/10.1038/nprot.2013.092.
28. Weinstein JN, Kim J, Creighton CJ, Akbani R, Hoadley KA, Kim WY, Morgan MB, Hinoue T, Cherniack A, Su X, Mungall AJ, Ryan MC, Bajorin DF, et al. Progress in The Cancer Genome Atlas bladder cancer project. Cancer Res. 2015; 75:2969.
29. Santarpia M, Karachaliou N. Tumor immune microenvironment characterization and response to anti-PD-1 therapy. Cancer Biol Med. 2015; 12:74–8. https:// doi.org/10.7497/j.issn.2095-3941.2015.0022.
30. Farkona S, Diamandis EP, Blasutig IM. Cancer immunotherapy: the beginning of the end of cancer? BMC Med. 2016; 14:73. https://doi.org/10.1186/ s12916-016-0623-5.
31. Cazier JB, Rao SR, McLean CM, Walker AK, Wright BJ, Jaeger EE, Kartsonaki C, Marsden L, Yau C, Camps C, Kaisaki P, Taylor J, Catto JW, et al; Oxford-Illumina WGS500 Consortium. Whole-genome sequencing of bladder cancers reveals somatic CDKN1A mutations and clinicopathological associations with mutation burden. Nat Commun. 2014; 5:3756. https://doi.org/10.1038/ ncomms4756.
32. Black M, Barsoum IB, Truesdell P, Cotechini T, Macdonald-Goodfellow SK, Petroff M, Siemens DR, Koti M, Craig AW, Graham CH. Activation of the PD-1/PD-L1 immune checkpoint confers tumor cell chemoresistance associated with increased metastasis. Oncotarget. 2016; 7:10557–67. https://doi.org/10.18632/oncotarget.7235.
33. Seiler R, Hussam Ashab HA, Erho N, van Rhijn BW, Winters B, Douglas J, Van Kessel KE, Fransen van de Putte EE, Sommerlad M, Wang NQ, Choeurng V, Gibb EA, Palmer-Aronsten B, et al. Impact of molecular subtypes in muscle-invasive bladder cancer on predicting response and survival after neoadjuvant chemotherapy. Eur Urol. 2017. http://dx.doi.org/10.1016/j.eururo.2017.03.030.


![Table 2: Gene Ontology classes enriched in the overall 377 genes (a) and 157 top ranked genes (b) GO categories defined by PANTHER pathway tool [27, 33]](https://thumb-us.123doks.com/thumbv2/123dok_us/9859976.487184/16.918.92.830.126.1097/ontology-classes-enriched-overall-categories-defined-panther-pathway.webp)
