449
© 2018 by the Serbian Biological Society How to cite this article: Zhang B, Shen Z, Ma R, Yan J, Yu M. Grey relational analysis and fuzzy synthetic discrimination of antioxidant components in peach fruit. Arch Biol Sci. 2018;70(3):449-58.
Grey relational analysis and fuzzy synthetic discrimination of antioxidant
components in peach fruit
Binbin Zhang1,2,3, Zhijun Shen2,3, Ruijuan Ma2,3, Juan Yan2,3 and Mingliang Yu1,2,3,*
1College of Landscape Architecture, Nanjing Forestry University, Nanjing 210037, P.R. China 2Institute of Pomology, Jiangsu Academy of Agricultural Sciences, Nanjing 210014, P.R. China 3Jiangsu Key Laboratory for Horticultural Crop Genetic Improvement, Nanjing 210014, P.R. China
*Corresponding author: [email protected]
Received: December 9, 2017; Revised: January 19, 2018; Accepted: January 30, 2018; Published online: February 9, 2018
Abstract: Free phenolic compounds and total phenolic content were quantified using four stages of four blood-flesh and four non-blood-flesh peach fruits. Data were used to assess the oxidation resistance using grey relational analysis and fuzzy synthetic discrimination methods. Data from equal-weight and weighted evaluations calculated using both grey relational analysis and fuzzy synthetic discrimination were very similar. The weighted relational grade and weighted evaluation value of the overall resistance to fruit oxidation were ordered according to the weight coefficient method, which demonstrated that there were discrepancies in the ranking of oxidation resistance of the tested varieties between early and late fruit develop-mental stages. During fruit development, the blood-flesh varieties showed a relatively high overall resistance to oxidation, with the highest observed in Beijingyixianhong. The results suggest that both grey relational analysis and fuzzy synthetic discrimination have high applicability in assessing the resistance to oxidation of peach varieties.
Key words: blood-flesh peach; resistance to oxidation; grey relational analysis; fuzzy synthetic discrimination; fruit ripening
INTRODUCTION
Public awareness of current improved concepts in nu-trition is increasing and leading to an informed choice of healthier diets. Fruits and vegetables are attractive nutrient sources because of their rich content of phe-nolic compounds with antioxidant activity [1-5]. Phy-tochemicals such as flavonoids and other phenolics in fruits or vegetables may contribute to the prevention of some diseases, and those with antioxidant activity can reduce the incidence of oxidative damage caused by free radicals [6]. Tremendous efforts have been made in the application of phenols and other bioactive substances for the prevention of cancer, cardiovascular and other chronic diseases [7-10]. Fruit polyphenols include a wide range of compounds with antioxidant activity, such as hydroxycinnamates, flavan-3-ols, gal-lic acid derivatives, flavonols and anthocyanins [6]. In fruits, blueberries are widely recognized as having a high resistance to oxidation [11,12].
Research into the antioxidative activity of blood-fleshed fruit has increased in recent years. Hpvasantha
et al. [13] reported that the antioxidant capacity varies between red-fleshed apples and other commercial cul-tivars. Vizzotto et al. [14] showed that the anthocyanin content, phenolic content and antioxidant activities in blood-flesh peaches were higher than in light-colored flesh varieties. In addition, a strong correla-tion was found between the total content of phenolic compounds and antioxidant activity in blood-flesh peaches [15]. Mature fruits were often used as ma-terials for testing fruit oxidant resistance, however, only a few studies focused on fruit antioxidant activ-ity changes during fruit growth and development. In addition, because various substrates, system composi-tions and analytical methods have been employed to evaluate the antioxidant capacities of fruits, it remains difficult to directly compare and interpret data from different studies [16].
It is closer to a scientific method to synthetically eval-uate fruit characteristics using multiple quality indices of different varieties based on mathematical methods than to evaluate a single index. However, grey rela-tional analysis has seldom been used to evaluate the overall oxidation resistance in fruits. In the present study, grey relational analysis and fuzzy synthetic dis-crimination were used to select peach varieties with high oxidation resistance by combining the indicators of individual phenolic content and the total content of phenols during fruit development in three types of peach with different flesh color. This approach pro-vided a new avenue for the study of overall resistance of fruits to oxidation.
MATERIALS AND METHODS
Plant material
Experiments were performed at the National Fruit Germplasm Repository of Nanjing (32°2’ N, 118°52’ E, altitude 11 m) in 2016. The region has a subtropical monsoon climate characterized by an annual average temperature of 15.7°C (and an annual accumulated temperature around 4800°C), an annual precipitation of 1000-1100 mm, an average of 1900 h of sunlight per year, and an annual frost-free period of 220-240 days. Adult trees of four blood-flesh peach varieties (Heiyoutao, Tianjinshuimi, Yejihong and Beijingy-ixianhong) and four non-blood-flesh varieties (Bai-huashuimi, Xiacui, Galaxy and Ruiguang 18), the rootstock of which were all wild peach, were used for the plant materials. The trees were in an open center with a 3.5 m×5 m planting space and were managed according to normal cultivation practices. The fruits were collected from each variety at four stages of de-velopment, designated as S1-S4, and the flesh types and sampling dates are shown in Supplementary Table S1. Ten fruits of each variety of comparable size, ripe-ness and no sign of insect or pathogen infection were randomly collected from the orchard between 7:00 and 8:00 am to maintain a lower respiratory inten-sity, and were cooled to 4°C in an ice box. For each developmental stage of each peach variety, 30 fruits were collected and used for all analyses with three replicates. From each peeled fruit, adaxial flesh on both sides of the suture was collected, minced,
ho-mogenized, frozen in liquid nitrogen and stored at -80°C until analysis.
Determination of the free phenol content
Extraction buffer (5 mL) containing 0.1% (v/v) H3PO4 (Sigma-Aldrich, St. Louis, USA) in methanol (Sig-ma-Aldrich, St. Louis, USA) (both chromatographic grade) was added to the ground pulp sample of 1.0 g. Samples were then subject to ultrasonic treatment (XO-5200DT, Atpio corporation, Nanjing, China) in the dark for 10 min before centrifugation at 13000xg
for 5 min at 4°C (Centrifuge 5810 R, Eppendorf AG, Hamburg, Germany) and filtration of the superna-tant. The content of individual phenolics (chlorogenic acid, neochlorogenic acid, catechin, epicatechin, feru-lic acid, rutin, quercetin) in peach-flesh extracts was determined by chromatography using an Agilent 1100 HPLC system (Agilent Technology, USA) equipped with a VWD UV detector and an Agilent ZORBAX SB-C18 column (4.6 mm×250 mm, 5 μm) (Agilent Technology, USA). The detection wavelength was 280 nm and the injection volume was 5 μL. The sample contents of individual phenolic compounds were de-termined from the standard curves of each, and the total phenolic content was calculated as the sum of the individual phenols. The standard curves were all cre-ated from chromatographically pure chemicals pur-chased from Sigma-Aldrich Corporation (St. Louis, USA), which were dissolved in extraction buffer to concentrations of 1000, 500, 100, 50, 10, 5, 1, 0.5, 0.1, 0.05 and 0.01 mg/L and subjected to chromatography. Linear regression was carried out between the peak areas and the amount of each standard chemical to create the standard curves [21].
Data processing and analysis
Correlation analysis and determination of the weight coefficient
Grey relational analysis
The eight tested peach varieties were considered as one grey system and each variety as one factor in the system. To comparatively evaluate the antioxidant capacities of the peach varieties, the best values of individual indicators in S1 and S4 stages were com-bined to create an ideal, virtual variety [17], which was designated as X0, and the individual indicators in the eight varieties constituted the comparison sequence Xi
(i = 1, 2, … n, where n is the number of tested variet-ies). After the initialization of all the data, the corre-lation coefficient between the comparison sequence and reference sequence was obtained using equation (1) [17] and the equal-weight relational grade and weighted evaluation value were then calculated us-ing equations (2) and (3), respectively.
(1)
(2)
(3)
where n is the number of indicators, εi(k) represents the correlation coefficient of Xi to X0, and ρ is the resolution coefficient, generally between 0 and 1, but as is usual in analyses of agricultural systems [22], this was set to 0.5; xi(k) indicates the value of k indicators of the ith variety after data initialization, and |x0(k
)-xi(k)| represents the absolute difference between the k
indicator of the ith variety and the reference indicator;
ri is the equal-weight relational grade, riʹ indicates the weighted relational grade and wj represents the weight coefficients for each indicator.
Fuzzy synthetic discrimination
The membership grade of each indicator of the tested varieties was determined using equation (4) to ob-tain the fuzzy transition matrix [23]. In addition, the equal-weight comprehensive evaluation set (B) and
the weighted comprehensive evaluation set (Bʹ) were calculated using equations (5) and (6), respectively,
(i=1,2,…m; j=1,2,…n) (4)
R=(rij) (5)
R=(rij) (6)
where n is the number of indicators, m indicates the number of tested varieties, Xij represents the value of the jth indicator of the ith variety, and max (Xij) and min (Xij) are the maximal and minimal value of the
jth indicator of the mth variety, respectively.
Spearman’s rank correlation analysis
Spearman’s rank correlation analysis was carried out between the equal-weight relational grade and weight-ed relational grade, and equal-weight comprehensive evaluation set (B) and the weighted comprehensive evaluation set (Bʹ) [24,25] using equation (7),
(7)
where di represents the ranking difference between the equal-weight relational grade and weighted relational grade, or between the equal-weight and weighted eval-uation values, rs indicates the spearman rank correla-tion coefficient and m is the number of tested varieties.
RESULTS
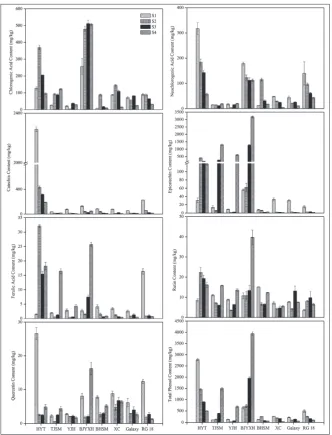
Changes in the content of phenolic compounds during fruit development in different peach varieties
and rutin was relatively low in S1 but increased in S2 and decreased in the later stages. Neochlorogenic acid, catechin, quercetin and total phenol showed different patterns, with the highest content in S1 and with the exception of quercetin, which decreased to the lowest values in S4.
In Tianjinshuimi, Yejihong and Beijingyixian-hong, the chlorogenic acid content was relatively high in the later stage, and the highest content of epicatechin, ferulic acid, rutin and total phenols was observed in S4. The catechin content in S1 was
higher than that in S4 in three varieties. The content of quercetin in Tianjinshuimi and Beijingyixianhong decreased and was followed by an increase to the high-est level in S4, while in Yejihong, quercetin was high in S1 and lowest in S4. This indicated that there were capacity differences in the accumulating phenolics of blood-flesh peach varieties.
Neochlorogenic acid, chlorogenic acid, catechin, epicatechin, ferulic acid and the total phenolic con-tent in non-blood-flesh peach varieties exhibited a general trend of reduction during fruit development.
The highest quercetin levels were found in S1 in all four varieties, followed by a significant reduction in S2. Differences among these four varieties, however, were observed during the mid-late stages, where Bai-huashuimi quercetin levels were highest in S4, while the other three varieties demonstrated higher levels in S3. This indicated that most phenolics of non-blood-flesh peach varieties had the same tendency during the process of fruit development.
When comparing the eight different varieties, the phenolic indicators of Beijingyixianhong were all significantly higher than those of the other varieties, except for catechin at fruit maturity (S4), indicating its high resistance to oxidation. In addition, the catechin content in Heiyoutao was higher than in the other varieties. It can be judged that flesh color differences of the various peach varieties might be the main rea-son for the different contents of phenolic compounds (Fig. 2).
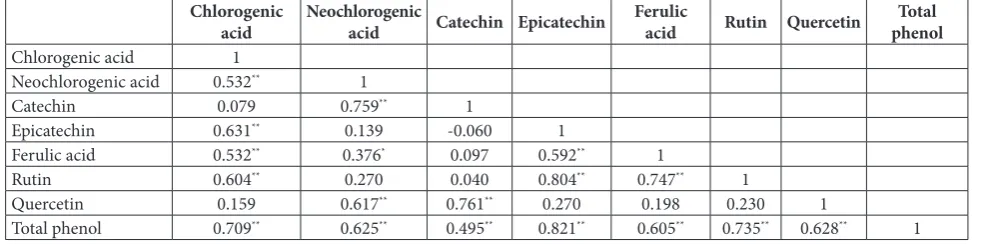
Correlation analysis of the contents of individual phenolic compounds with total phenols
Correlation analysis was performed based on the eight indicators in eight varieties (Table 1). The content of the seven individual indicators all showed a signifi-cantly positive correlation with the total phenol con-tent, suggesting that the variation in total phenolic content in peach fruit is closely related to the accu-mulation of individual phenols.
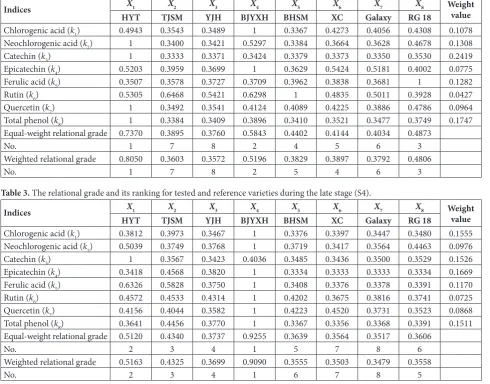
Grey relational analysis
To evaluate the different peach varieties for phenolic content and potential resistance to oxidation, the best values of the individual indicators at S1 and S4 stages were determined and used as the reference variety,
X0, and a grey relational analysis to X0was performed for the eight tested varieties. The order of the result-ing correlativity for each indicator and overall oxida-tion resistance in peach varieties (Tables 2 and 3) indicates that the relational grade of the 8 varieties to the reference variety varied. Similar differences in the oxidation resistance of peach varieties at S1 and S4 were observed regardless of whether equal-weight or weighted relational grades were applied. In S1, the top three varieties were Heiyoutao, Beijingyixianhong and Ruiguang 18, whereas Gal-axy, Tianjinshuimi and Yejihong ranked bottom. In S4, the top four varieties were Beijingyixianhong,
Fig. 2. Flesh appearance of different peach varieties during fruit development stages.
Table 1. Correlation coefficients of individual phenolic compounds with total phenols in the tested varieties.
Chlorogenic
acid Neochlorogenic acid Catechin Epicatechin Ferulic acid Rutin Quercetin phenolTotal
Chlorogenic acid 1
Neochlorogenic acid 0.532** 1
Catechin 0.079 0.759** 1
Epicatechin 0.631** 0.139 -0.060 1
Ferulic acid 0.532** 0.376* 0.097 0.592** 1
Rutin 0.604** 0.270 0.040 0.804** 0.747** 1
Quercetin 0.159 0.617** 0.761** 0.270 0.198 0.230 1
Total phenol 0.709** 0.625** 0.495** 0.821** 0.605** 0.735** 0.628** 1
Heiyoutao, Tianjinshuimi and Yejihong, while Xi-acui and Galaxy ranked the lowest. Differences be-tween the equal-weight or weighted methods were only observed in mid-ranking varieties: the ranking of Baihuashuimi and Xiacui varieties in S1 and Bai-huashuimi and Ruiguang 18 in S4 were interchange-able, depending on the method used.
The Spearman rank correlation coefficients, rs,of S1 and S4, calculated by the equal-weight or weighted method were both 0.98, indicating agreement between the two methods and that such a ranking could char-acterize the order of overall resistance to oxidation in the eight peach varieties. These results demonstrated that the antioxidative capacities of the various peach varieties during early development were
significant-ly different from that of mature fruits. In addition, blood-flesh peaches possessed a stronger resistance to fruit oxidation at maturity.
Fuzzy synthetic discrimination
The results of fuzzy synthetic discrimination for the overall resistance to oxidation of the peach varieties in S1 and S4 are shown in Tables 4 and 5. The rankings calculated from equal-weight and weighted methods of the peach varieties were identical. In S1, the antioxi-dative capacities of the peach varieties were ranked by fuzzy synthetic discrimination as Heiyoutao, Beijingy-ixianhong, Ruiguang 18, Xiacui, Galaxy, Baihuashuimi, Tianjinshuimi and Yejihong, while in S4 the order was
Table 2. The relational grade and its ranking for tested and reference varieties during the early stage (S1).
Indices X1 X2 X3 X4 X5 X6 X7 X8 Weight
value
HYT TJSM YJH BJYXH BHSM XC Galaxy RG 18
Chlorogenic acid (k1) 0.4943 0.3543 0.3489 1 0.3367 0.4273 0.4056 0.4308 0.1078 Neochlorogenic acid (k2) 1 0.3400 0.3421 0.5297 0.3384 0.3664 0.3628 0.4678 0.1308 Catechin (k3) 1 0.3333 0.3371 0.3424 0.3379 0.3373 0.3350 0.3530 0.2419 Epicatechin (k4) 0.5203 0.3959 0.3699 1 0.3629 0.5424 0.5181 0.4002 0.0775 Ferulic acid (k5) 0.3507 0.3578 0.3727 0.3709 0.3962 0.3838 0.3681 1 0.1282 Rutin (k6) 0.5305 0.6468 0.5421 0.6298 1 0.4835 0.5011 0.3928 0.0427 Quercetin (k7) 1 0.3492 0.3541 0.4124 0.4089 0.4225 0.3886 0.4786 0.0964 Total phenol (k8) 1 0.3384 0.3409 0.3896 0.3410 0.3521 0.3477 0.3749 0.1747 Equal-weight relational grade 0.7370 0.3895 0.3760 0.5843 0.4402 0.4144 0.4034 0.4873
No. 1 7 8 2 4 5 6 3
Weighted relational grade 0.8050 0.3603 0.3572 0.5196 0.3829 0.3897 0.3792 0.4806
No. 1 7 8 2 5 4 6 3
Table 3. The relational grade and its ranking for tested and reference varieties during the late stage (S4).
Indices X1 X2 X3 X4 X5 X6 X7 X8 Weight
value
HYT TJSM YJH BJYXH BHSM XC Galaxy RG 18
Chlorogenic acid (k1) 0.3812 0.3973 0.3467 1 0.3376 0.3397 0.3447 0.3480 0.1555 Neochlorogenic acid (k2) 0.5039 0.3749 0.3768 1 0.3719 0.3417 0.3564 0.4463 0.0976 Catechin (k3) 1 0.3567 0.3423 0.4036 0.3485 0.3436 0.3500 0.3529 0.1526 Epicatechin (k4) 0.3418 0.4568 0.3820 1 0.3334 0.3333 0.3333 0.3334 0.1669 Ferulic acid (k5) 0.6326 0.5828 0.3750 1 0.3408 0.3376 0.3378 0.3391 0.1170 Rutin (k6) 0.4572 0.4533 0.4314 1 0.4202 0.3675 0.3816 0.3741 0.0725 Quercetin (k7) 0.4156 0.4044 0.3582 1 0.4223 0.4520 0.3731 0.3523 0.0868 Total phenol (k8) 0.3641 0.4456 0.3770 1 0.3367 0.3356 0.3368 0.3391 0.1511 Equal-weight relational grade 0.5120 0.4340 0.3737 0.9255 0.3639 0.3564 0.3517 0.3606
No. 2 3 4 1 5 7 8 6
Weighted relational grade 0.5163 0.4325 0.3699 0.9090 0.3555 0.3503 0.3479 0.3558
Beijingyixianhong, Heiyoutao, Tianjinshuimi, Yeji-hong, Baihuashuimi, Ruiguang 18, Xiacui and Galaxy. It was shown that the rankings of the peach vari-eties obtained by equal-weight and weighted evalua-tion in fuzzy synthetic discriminaevalua-tion were consistent. Both rank correlation coefficients, rs,of S1 and S4 were 1 according to the Spearman rank correlation analysis, indicating that this approach is useful for grading the antioxidative capacity of the eight peach varieties. In agreement with the rankings observed with grey re-lational analysis, Beijingyixianhong and Heiyoutao exhibited a relatively high resistance to oxidation at both early and late stages of development, and the resistance of both Tianjinshuimi and Yejihong was weak during S1 but higher in mature fruit (S4).
DISCUSSION
A relational grade is a measure of the relatedness be-tween two systems or factors and describes the relative changes in the process of system development. Sig-nificant relational grades tend to occur when changes are consistent, whereas inconsistent changes promote insignificant grades. Relational grading also compen-sates for the shortcoming caused by the systematic analysis of mathematical statistics [17,26,27]. Based on this concept, the present study created the refer-ence variety with the overall desired traits to perform a grey relational analysis of the antioxidant capacities of different peach varieties. Zadeh [23] proposed the concept of fuzzy sets and provided the definition of membership function, which served as a mathematical
Table 4. Fuzzy synthetic discrimination of peach varieties during the early stage (S1).
Indices X1 X2 X3 X4 X5 X6 X7 X8 Weight
value
HYT TJSM YJH BJYXH BHSM XC Galaxy RG 18
Chlorogenic acid (k1) 0.4806 0.0750 0.0529 1 0 0.3198 0.2560 0.3293 0.1078 Neochlorogenic acid (k2) 1 0.0075 0.0165 0.5459 0 0.1158 0.1018 0.4181 0.1308 Catechin (k3) 1 0 0.0167 0.0398 0.0203 0.0178 0.0073 0.0836 0.2419 Epicatechin (k4) 0.4747 0.1307 0.0295 1 0 0.5195 0.4702 0.1463 0.0775 Ferulic acid (k5) 0 0.0308 0.0912 0.0838 0.1769 0.1327 0.0731 1 0.1282 Rutin (k6) 0.4273 0.6466 0.4534 0.6197 1 0.3090 0.3560 0 0.0427 Quercetin (k7) 1 0 0.0213 0.2357 0.2246 0.2668 0.1561 0.4156 0.0964 Total phenol (k8) 1 0 0.0108 0.1985 0.0112 0.0585 0.0402 0.1469 0.1747 Equal-weight evaluation values 0.6728 0.1113 0.0865 0.4654 0.1791 0.2175 0.1826 0.3175
No. 1 7 8 2 6 4 5 3
Weighted evaluation values 0.7507 0.0508 0.0492 0.3609 0.0939 0.1603 0.1258 0.3157
No. 1 7 8 2 6 4 5 3
Table 5. Fuzzy synthetic discrimination of peach varieties during the late stage (S4).
Indices X1 X2 X3 X4 X5 X6 X7 X8 Weight
value
HYT TJSM YJH BJYXH BHSM XC Galaxy RG 18
Chlorogenic acid (k1) 0.1727 0.2271 0.0398 1 0 0.0098 0.0312 0.0454 0.1555 Neochlorogenic acid (k2) 0.4890 0.1348 0.1414 1 0.1235 0 0.0627 0.3561 0.0976 Catechin (k3) 1 0.0613 0 0.2310 0.0271 0.0055 0.0335 0.0455 0.1526 Epicatechin (k4) 0.0371 0.4053 0.1909 1 0.0005 0.0001 0 0.0003 0.1669 Ferulic acid (k5) 0.7040 0.6353 0.1506 1 0.0143 0 0.0012 0.0068 0.1170 Rutin (k6) 0.3101 0.2990 0.2342 1 0.1980 0 0.0581 0.0277 0.0725 Quercetin (k7) 0.2352 0.1989 0.0255 1 0.2560 0.3407 0.0860 0 0.0868 Total phenol (k8) 0.1179 0.3716 0.1654 1 0.0051 0 0.0053 0.0155 0.1511 Equal-weight evaluation values 0.3832 0.2917 0.1185 0.9039 0.0781 0.0445 0.0347 0.0621
No. 2 3 4 1 5 7 8 6
Weighted evaluation values 0.3765 0.2949 0.1137 0.8826 0.0553 0.0319 0.0287 0.0539
model to describe the intermediate transition of dif-ferences in fuzzy examples. In recent years, the mem-bership function has been continuously improved and is widely used [28,29]. In the present study, we utilized fuzzy synthetic discrimination to evaluate oxidation resistance in peach varieties, which provides a new approach to the study of overall resistance to oxida-tion in peach fruit.
The application of grey relational analysis and fuzzy synthetic discrimination in the screening of crop germ-plasm has increased in recent years. Ma et al. [30] used 20 traits related to fruit quality of Ziziphus jujube Dong-zao to comprehensively evaluate 20 germplasms, and 5 germplasms with a high overall quality were selected by combining grey relational analysis with weighted values for the creation of an ideal reference variety. Hou et al. [31] compared the advantages and disadvantages of the methods of fuzzy comprehensive evaluation, the ana-lytic hierarchy process and grey correlation degree anal-ysis in the evaluation of fruit quality. They identified the main factors affecting the comprehensive quality of fruit and showed that the comprehensive evaluation of fruit quality by data mining simplified the evaluation procedure and enabled the rapid determination of fruit quality. In the present study, the proportion of differ-ent indicators in the comprehensive evaluation of an-tioxidant capacity of peach fruit varied, so it was more logical and practical to evaluate the comprehensive trait from weighted values than with equal-weight values. The weight coefficients of the different indicators need to be determined when calculating the weighted rela-tional grades and evaluation values. Determining the weight coefficient by a subjective weighting method is influenced by the knowledge structure and preferences of the evaluators, which is highly subjective. Therefore, in the present study, the coefficient of variation was used to determine the weight coefficient and thereby avoid subjective judgment of the results. The data ob-tained demonstrated that the weighted relational grades and weighted evaluation values of fruit traits in peach varieties at stage S4 were ranked as Beijingyixianhong, Heiyoutao, Tianjinshuimi and Yejihong, followed by white- or yellow-flesh-type varieties. This suggested that overall oxidation resistance of mature blood-flesh peaches was stronger than that of white- and yellow-colored flesh varieties, and that Beijingyixianhong ex-hibited the highest resistance to oxidation of the four blood-flesh peach varieties tested.
It has been demonstrated that the antioxidative ca-pacity of fruit is closely related to its phenolic content [32-36]. In the present study, we have shown that the total phenolic content of Tianjinshuimi, Yejihong and Beijingyixianhong gradually increased with fruit de-velopment, revealing that their antioxidative capacity is greatly dependent on fruit maturation. This trend was opposite in Heiyoutao, Baihuashuimi, Xiacui, Galaxy and Ruiguang 18, suggesting that the main phenolic compounds were rapidly synthesized in the early stage of fruit development, but less so during later stages, or were degraded at a faster rate [37]. In addition, although the total phenolic content of Heiy-outao at S4 was lower than at other stages, its average level was significantly higher than that of white- and yellow-flesh varieties, pointing to its relatively high resistance to oxidation at fruit maturity and giving it a ranking in second place.
CONCLUSIONS
The selection of evaluation methods and evaluation in-dicators forms the basis for the evaluation of fruit char-acteristics by a scientific method. Indicators associated with the antioxidative capacity of peach fruit, namely individual phenolic compounds and total phenolic con-tent, were selected in the current study. In addition, grey relational analysis and fuzzy synthetic discrimina-tion were employed to evaluate and rank the oxidadiscrimina-tion resistance of eight peach varieties during early and later stages of fruit development. The results obtained us-ing weighted relational grades and weighted evaluation values were consistent, indicating that the combination of grey relational analysis and fuzzy synthetic discrimi-nation is highly applicable in the assessment of fruit quality, and can be widely used in the breeding of peach varieties possessing desirable traits.
Funding: This study was financially supported by the program of National Natural Science Foundation of China (No. 31471848) and Chinese Agricultural Research System (No. CARS-30).
Author contributions: Binbin Zhang and Mingliang Yu conceived and designed the study; Binbin Zhang performed the experiments; Juan Yan performed the data analysis; Binbin Zhang and Mingliang Yu wrote the paper; Zhijun Shen and Ruijuan Ma revised the paper. All authors read and approved the final manuscript.
REFERENCES
1. Carbone K, Giannini B, Picchi V, Lo Scalzo R, Cecchini F. Phenolic composition and free radical scavenging activity of different apple varieties in relation to the cultivar, tissue type and storage. Food Chem. 2011;127(2):493-500.
2. Joshi APK, Rupasinghe HPV, Khanizadeh S. Impact of dry-ing processes on bioactive phenolics, vitamin c and antioxi-dant capacity of red-fleshed apple slices. J Food Process Pres. 2011;35(4):453-7.
3. Scordino M, Sabatino L, Muratore A, Belligno A, Gagliano G. Phenolic characterization of Sicilian yellow flesh peach (Prunus persica L.) cultivars at different ripening stages. J Food Quality. 2012;35(4):255-62.
4. Agourram A, Ghirardello D, Rantsiou K, Zeppa G, Belviso S, Romane A, Oufdou K, Giordano M. Phenolic content, antioxi-dant potential, and antimicrobial activities of fruit and vegeta-ble by-product extracts. Int J Food Pro. 2013;16(5):1092-104. 5. Kim SY. Fluctuations in phenolic content and antioxidant
capacity of green vegetable juices during refrigerated stor-age. Prev Nutr Food Sci. 2015;20(3):169-75.
6. Gil MI, Tomás-Barberán FA, Hess-Pierce B, Kader AA. Anti-oxidant capacities, phenolic compounds, carotenoids, and vitamin C contents of nectarine, peach, and plum cultivars from California. J Agr Food Chem. 2002;50(17):4976-82. 7. Ames BN, Shigenaga MK, Hagen TM. Oxidants, antioxidants,
and the degenerative diseases of aging. P Nat Acad Sci U S A. 1993;90(17):7915-22.
8. Boyer J, Liu RH. Apple phytochemicals and their health ben-efits. Nutr J. 2004;3(1):5-15.
9. Wu QK, Koponen JM, Mykkänen HM, Törrönen AR. Berry phenolic extracts modulate the expression of p21WAF1 and Bax
but not Bcl-2 in HT-29 colon cancer cells. J Agr Food Chem. 2007;55(4):1156-63.
10. Alimpić A, Oaldje M, Matevski V, Marin PD, Duletić-Laušević S. Antioxidant activity and total phenolic and fla-vonoid contents of Salvia amplexicaulis Lam. extracts. Arch Biol Sci. 2014;66(1):307-16.
11. Connor AM, Luby LL, Tong CBS, Finn CE, Hancock JF. Variation and heritability estimates for antioxidant activity, total phenolic content and anthocyanin content in blueberry progenies. J Am Soc Hortic Sci. 2002;127(1):82-8.
12. Wang SY, Chen H, Ehlenfeldt MK. Antioxidant capacities vary substantially among cultivars of rabbiteye blueberry ( Vac-cinium ashei Reade). Int J Food Sci Tec. 2011;46(12):2482-90. 13. Hpvasantha R, Gwendolynm H, Charles E, Philipl F. Red-fleshed apple as a source for functional beverages. Can J Plant Sci. 2010;90(1):95-100.
14. Vizzotto M, Cisneros-Zevallos L, Byrne DH, Ramming DW, Okie WR. Large variation found in the phytochemical and antioxidant activity of peach and plum germplasm. J Am Soc Hortic Sci. 2007;132(3):334-40.
15. Cevallos-Casals B, Byrne D, Okie WR, Cisneros-Zevallos L. Selecting new peach and plum genotypes rich in phenolic compounds and enhanced functional properties. Food Chem. 2005;96(2):273-80.
16. Frankel EN, Meyer AS. The problems of using one-dimen-sional methods to evaluate multifunctional food and biologi-cal antioxidants. J Sci Food Agr. 2000;80(13):1925-41.
17. Deng JL. Control problems of grey systems. Syst Control Lett. 1982;1(5):288-94.
18. Mu P, Wei Z, Li F. Use of the grey relevancy coefficient method for comprehensive evaluation of the productive per-formance of alfalfa cultivars. Pratacul Sci. 2004;21(3):26-9. 19. Zhang S, Long G. Application of grey incident analysis in
synthetical appraisal of new potato series. J Mt Agr Biol. 2003;23(3):202-5.
20. Aprea E, Carlin S, Giongo L, Grisenti M, Gasperi F. Charac-terization of 14 raspberry cultivars by solid-phase microex-traction and relationship with gray mold susceptibility. J Agr Food Chem. 2009;58(2):1100-5.
21. Yan J, Cai ZX, Shen ZJ, Zhang BB, Qan W, Yu ML. Determina-tion and comparison of 10 phenolic compounds in peach with three types of flesh color. Acta Hortic Sin. 2014;41(2):319-28. 22. Jiang JX, Wan NF. A model for ecological assessment to pesti-cide pollution management. Ecol Model. 2009;220(15):1844-51.
23. Zadeh LA. Fuzzy sets, information and control. Inf Control. 1965;8(3):338-53.
24. Spearman C. The proof and measurement of association between two things. Am J Psychol. 1904;15(1):72-101. 25. Zar JH. Significance testing of the Spearman rank correlation
coefficient. J Am Stat Assoc. 1972;67(339):578-80.
26. Lin JL, Lin CL. The use of grey-fuzzy logic for the optimi-zation of the manufacturing process. J Mater Process Tech. 2005;160(1):9-14.
27. Qin P, Shen Y, Wang Z. Grey evaluation of non-statistical uncertainty in multidimensional precision measurement. Int J Adv Manuf Tech. 2006;31(5-6):539-45.
28. Ghazy UMM. Modifications of evaluation index and subordi-nate function formulae to determine superiority of mulberry silkworm crosses. J Basic Appl Zool. 2014;67(1):1-9. 29. Zhang XH, Yuan DY, Zou F, Fan XM, Tang J, Zhu ZJ. A
study on the xenia effect in Castanea henryi. Hortic Plant J. 2016;2(6):301-8.
30. Ma QH, Liang LS, Li Q, Wang GX. Synthetical evaluation of the fruit quality of ‘Dongzao’ advanced selections using analytic hierarchy process and grey relational grade analysis. Acta Hortic. 2012;940:213-20.
31. Hou JJ, Wang D, Jia WS, Pan LG. Commentary on applica-tion of data mining in fruit quality evaluaapplica-tion. In: Li D, Li Z, editors. Computer and computing technologies in agriculture IX: IFIP Advances in Information and Communication Tech-nology. Vol 479. Berlin, Germany: Springer-Verlag; 2016. p. 505-13.
32. Sun J, Chu YF, Wu XZ, Liu RH. Antioxidant and anti-pro-liferative activities of common fruits. J Agr Food Chem. 2002;50(25):7449-54.
33. Ayala-Zavala JF, Wang SY, Wang CY, Gonzalez-Aguilar GA. Effect of storage temperatures on antioxidant capacity and aroma compounds in strawberry fruit. LWT-Food Sci Tech-nol. 2004;37(7):687-95.
34. Ferreyra RM, Vina SZ, Mugridge A, Chaves AR. Growth and ripening season effects on antioxidant capacity of strawberry cultivar Selva. Sci Hortic. 2007;112(1):27-32.
quality, antioxidant contents and activity, and inhibition of cell proliferation of strawberry fruit. Postharvest Biol Tec. 2008;49(2):201-9.
36. Hudafaujan N, Noriham A, Norrakiah AS, Babji AS. Antioxi-dant activity of plants methanolic extracts containing pheno-lic compounds. Afr J Biotechnol. 2009;8(3):484-9.
37. Harel E, Mayer AM, Shain Y. Catechol oxidases, endogenous substrates and browning in developing apples. J Sci Food Agr. 1966;17(9):389-92.
Supplementary Data