de Paula Parisotto, R., Valente Klaine, P., Nadas, J. P.B., Demo Souza, R.,
Brante, G. and Imran, M. A. (2019) Drone Base Station Positioning and
Power Allocation Using Reinforcement Learning. In: 16th International
Symposium on Wireless Communication Systems (ISWCS 2019), Oulu,
Finland, 27-30 Aug 2019, pp. 213-217. ISBN 9781728125275
(doi:
10.1109/ISWCS.2019.8877247
).
This is the author’s final accepted version.
There may be differences between this version and the published version.
You are advised to consult the publisher’s version if you wish to cite from
it.
http://eprints.gla.ac.uk/187803/
Deposited on: 01 July 2019
Enlighten – Research publications by members of the University of Glasgow
Drone Base Station Positioning and Power
Allocation using Reinforcement Learning
Rafaela de Paula Parisotto
∗, Paulo V. Klaine
†, Jo˜ao P. B. Nadas
†,
Richard Demo Souza
∗, Glauber Brante
§, Muhammad A. Imran
†∗Electrical & Electron. Eng. Dept. †School of Engineering §Commun. Syst. Lab
UFSC, Florian´opolis, Brazil University of Glasgow, Glasgow, UK UTFPR, Curitiba, Brazil
[email protected] [email protected] [email protected] [email protected] [email protected]
Abstract—Large scale natural disasters can cause unpre-dictable losses of human lives and man-made infrastructure. This can hinder the ability of both survivors as well as search and rescue teams to communicate, decreasing the probability of finding survivors. In such cases, it is crucial that a provisional communication network is deployed as fast as possible in order to re-establish communication and prevent additional casualties. As such, one promising solution for mobile and adaptable emergency communication networks is the deployment of drones equipped with base stations to act as temporary small cells. In this paper, an intelligent solution based on reinforcement learning is proposed to determine the best transmit power allocation and 3D positioning of multiple drone small cells in an emergency scenario. The main goal is to maximize the number of users covered by the drones, while considering user mobility and radio access network constraints. Results show that the proposed algorithm can reduce the number of users in outage when compared to a fixed transmit power approach and that it is also capable of providing the same coverage, with lower average transmit power and using only half of the drones necessary in the case of fixed transmit power.
Keywords—Emergency Communication Network, Machine Learning, Reinforcement Learning,Q-Learning, Drone Small Cells
I. INTRODUCTION
One of the most vital aspects during emergency situations is the ability of isolated people and survivors to communicate with the outside world. In addition, search and rescue teams also need to communicate not only among themselves in order to establish which areas need to be or were already covered and may contain survivors [1]. However, natural disasters, such as hurricanes, earthquakes and tsunamis often lead to a complete failure in existing communication infrastructure, hindering the performance of the on-field workers [1]. Since the first 72 hours after a tragedy, also known as theGolden Hours, are the most crucial ones to find survivors, the deployment of a quick, adaptable and efficient Emergency Communication Network (ECN) is vital in catastrophic situations [1], [2].
Existing methods to deploy an efficient ECN lack adapt-ability, and are restricted by environment and space, such as debris blockage or flooding. To overcome these challenges, one emerging technology that has received increased attention recently is the deployment of drone small cells (DSCs) [3]. For instance, in 2017, when the communications infrastructure of Puerto Rico was devastated by hurricane Maria, AT&T
and Verizon deployed Long-Term Evolution (LTE) equipped drones to provide wireless service, while the network was being restored [4]. It was the first time DSCs were utilized to provide large scale wireless communication after a disaster. This was made possible due to the flexibility, adaptability and mobility provided by the DSCs. As such, they are able to be deployed quickly and to provide service exactly where required [1], [4]. Moreover, these DSC capabilities can be coupled with machine learning algorithms to enable a fast, autonomous and intelligent deployment of an aerial ECN.
Based on that, in this paper, a joint 3D positioning and power allocation algorithm based on Reinforcement Learning (RL), more specifically Q-learning, is proposed. Assuming an area in which a catastrophe has occurred, completely destroying the previous wireless communication infrastructure, the aim is to deploy a flexible and efficient local area ECN based on DSCs. The proposed solution determines the more appropriate position and transmit power of each DSC in order to minimize overall user outage, therefore improving the network performance.
A. Related Work
The usage of DSCs in communication networks has at-tracted a significant attention from both academia and industry recently [1], [2], [5]–[9]. Several studies focus on the problem of drone positioning in mobile networks. For instance, in [5], the authors attempt to find the best position of multiple DSCs analytically. They propose a drone management framework for efficient operation, considering different environments. In [10], the optimal altitude of DSCs for maximum coverage is derived, with results showing that to maximize coverage, there is an optimal separation distance between drones. Wanget al., in [6], propose an expression for determining the optimal position of a DSC to maximize its coverage area considering energy constraints. In [7] the utilization of DSCs with a new path loss model is proposed. Results show that higher backhaul data rates can be achieved when compared to a solution with only a terrestrial infrastructure. Another work that investigates wireless backhaul constraints is [8], in which the authors study the usage of drones considering different types of backhaul links in order to analyze user coverage and throughput.
Moreover, other related works focus on ECN. In [9], for example, the positioning of DSCs in an emergency scenario is
investigated, with the aim of improving the network through-put. In addition, the work in [2] surveys network architectures for different scenarios, using DSCs for disaster management. Zhao et al. propose in [11] a framework of DSC-assisted ECNs with or without a terrestrial Base Station (BS) and also optimize the flight trajectory of the DSC in both scenarios.
Although the importance and contributions of previous works are clear, all surveyed works consider only analytical solutions for positioning drones, while just a few considered emergency situations. As such, to apply the above solutions to an ECN, a great amount of previous network knowledge would be necessary, such as the number of users, their positions, channel state information, etc., which would be unrealistic in a constantly changing environment. Considering this issue, Klaine et al. in [1] propose the intelligent positioning of multiple DSCs utilizing a RL-based algorithm. Such algorithm can analyze the environment, adapt itself and explore its possibilities to determine the best actions to be taken by the DSCs. The proposed solution employs Q-learning in every DSC to find their best position in a disaster scenario. Moreover, the algorithm considers user mobility and network constraints, with results showing better coverage than fixing the drones either in random or circular positions, or positioning them in the locations of hot-spots that existed when the network was fully operational.
B. Contributions
This paper is an extension of [1]. However, we assume that the previous cellular network infrastructure was completely destroyed, while in [1] the authors consider the assistance of a terrestrial macro BS. Similarly to [1], to restore cellular coverage, a number of DSCs is deployed to create an ECN, without any prior knowledge of position and channel state information, thus demanding self-optimization. In this sense, we propose a new solution based on Q-learning that jointly optimizes DSC positioning and allocates transmit power for maximizing coverage, while mitigating interference between DSCs and minimizing the number of users in outage. Results show that when power allocation is used, instead of a fixed power as in [1], it is possible to either increase the number of users covered, or even to use considerably fewer DSCs to achieve the same performance.
The remainder of this paper is organized as follows. Sec-tion II describes the urban path loss model, the network and the users distribution. Section III presents the proposed solution and the metrics used to measure the system performance. Section IV discusses simulation results. Lastly, Section V highlights the key findings and concludes the paper.
II. SYSTEMMODEL
This section introduces the parameters used in the urban path loss model in Section II-A, the DSCs network in Sec-tion II-B and the user distribuSec-tion in SecSec-tion II-C, respectively.
A. Urban Model
The urban environment model used in this paper follows the International Telecommunication Union (ITU-R) docu-ment [12], as in [1], [13], which recommends a standardized model for urban area based on the following parameters:
• α: the ratio of built-up land area to the total land area.
• β: average number of buildings per square kilometer.
• γ: scale parameter describing building height distribu-tion.
In order to model an urban scenario for this paper, ITU sta-tistical parameters and a Manhattan grid layout are considered for building distribution, following [1], [13]. The buildings have a square area of widthW and are separated by a spaceS. The height of the buildings are generated following Rayleigh distribution using the parameterγ. The selected urban scenario is deployed in anL×Lsquare area, whileW andSare given, in meters, by [1], [13] W = 1000 rα β, (1) S= 1000√ β −W. (2) B. Temporary Network
The solution proposed in this paper considers the deploy-ment of DSCs to create an ECN in a disaster scenario. To provide the necessary coverage to support the communication of rescue teams and to minimize users in outage, the DSCs are equipped with an antenna which has a given directivity. As such, it is considered that the DSCs antenna has an aperture angle θ, as in [1], which is the region that concentrates the major lobe of the antenna and has the highest gain. Thus, the coverage radius of a DSC can be expressed as
ρ=hd·tan
θ
2
, (3)
wherehdis the DSC height. Moreover, we also consider that
the irradiated signal outside ρis highly attenuated [1]. Considering a set ofU={1,2, ..., Nu}users randomly
dis-tributed in theL×Lsquare area and a set ofD={1,2, ..., Nd}
DSCs, the path loss χi,j between user i and DSC j, with
i ∈ Uandj ∈D, can be determined. The path loss (in dB) is composed by a free-space path loss component, with an additional lossξdepending on the line of sight (LOS) between a DSC and a user [13], so that
χi,j= 20 log10 4πfcdi,j c +ξ, (4)
where di,j is the distance between user i and DSC j, c is
the speed of light and fc is the carrier frequency. According
to [10], ξ adopts different deterministic values for LOS and non line of sight (NLOS) links.
C. Users Association
In order to associate users to DSCs, the Reference Signal Received Power (RSRP) between useri and DSCj, needs to be computed, and can be expressed, in dB, as
RSRPi,j=EIRPj−χi,j, (5)
where the Equivalent Isotropically Radiated Power (EIRP) is the sum of the transmit power with the antenna gain [1]. Based
on that, the Signal to Interference plus Noise Ratio (SINR) is expressed as SINRi,j= RSRPi,j N+PNd k=1,k6=jRSRPi,k , (6)
whereN is the additive white Gaussian noise power.
Users are allocated to the DSC with the best SINR. Besides that, the association also depends on the available capacity of the DSC Radio Access Network (RAN). If the SINR is above a specific threshold and there is enough RAN capacity for the user, then it is associated to the DSC. However, if the user SINR is below a threshold or if the DSC has no resource blocks (RB) available in its RAN, the next DSC (in terms of SINR) is considered as a candidate for association1. If a user
is unable to connect to a DSC in a time slot after trying to connect to all DSCs at range, then the user is considered in outage for that time slot.
III. PROPOSEDSOLUTION
This work proposes a RL-based method, usingQ-learning, to jointly optimize DSCs 3D position and transmit power, creating a local network of DSCs, with the intention of minimizing the number of users in outage in a disaster scenario where the previous network infrastructure was destroyed.
A. Q-learning
Machine learning algorithms have played an important role in communication networks in recent years [14], with special attention to intelligent applications offered by RL algorithms, which can be used, e.g., as a solution for positioning DSCs in wireless networks [1], [3]. A RL system is composed of an agent, which interacts with an environment and acquires knowledge from it. This knowledge is gathered in a trial and error approach, in which the agent tries different actions and collects the responses from the environment, in what is known as the reward. This is performed in order to discover which actions to take at specific states and this knowledge is stored in a table, known as the action-value function [15].
Q-learning, one of the most practical algorithms in RL, utilizes this idea and updates its action-value function, also known as the Q-table, via [15]
Q(st, at)←Q(st, at)+ (7)
λhrt+1+φmax
a Q(st+1, a)−Q(st, at)
i
,
whereλis the learning rate,rt+1 is the reward yielded by the
environment and φ is the discount factor (which dictates the value given to future rewards).
This table defines the value of being in a state st, at time
t, and taking an actionat. After the agent performs an action,
the environment takes the agent to a new state and generates a reward. The agent will then evaluate the reward in the new state and update the value of the previous state, now that it has the complete knowledge. Based on that, the algorithm can try different actions in different states (exploring) or choose the highest value of theQ-table which leads to better rewards at other states (exploiting) [15].
1It is considered that each user consumes 1 RB when associated to a DSC.
B. Proposed Method
In this paper, the goal of the proposed solution is to maximize user coverage by allocating power and positioning the DSCs in a dynamic system where users are moving and have different requirements. Next, the Q-learning parameters are presented.
• Environment:the disaster scenario, with buildings and moving users.
• Agents: each DSC is an independent agent, each having a differentQ-table.
• States: three dimension position of a DSC plus its transmit power.
• Actions: each drone can take nine possible actions: move up, down, right, left, forward, backward, in-crease or dein-crease its transmit power, or do nothing.
• Reward:the rewardris given by the total number of allocated users, r= Nd X j=1 Uj, (8)
where Uj is the number of users allocated to DSC
j. The DSCs are assumed to have access to the total number of allocated users by means of a central entity. Note that the DSCs must have backhaul connection to the core network, and such central entity is in the core network. The backhaul is assumed ideal in this work.
• Policy: DSCs choose their actions according to an -greed policy, with decaying over time [15].
• Update:each DSC updates itsQ-table as in (7).
• Initialization: all the drones are initialized at random locations and with their Q-tables set to zero.
• Episode: the episodes are subsequences of the agent-environment interaction. In the proposed problem, an episode can be described as a snapshot of the network. In each episode, DSCs take actions based on their current state and evaluate their reward. This process is repeated for a certain number of iterations until one of the stopping criteria is met.
• Stopping criteria: three different conditions are stop-ping criteria for the proposed method: i.) the reward has not improved after a certain number of iterations Maxit,r, ii.) a maximum number of iterations Maxit
has been carried out, or iii.) the DSC has used all RBs. When the DSC meets one of these conditions, it moves to the state which yields the best reward and stops until the next episode.
The proposed method runs in a distributed and independent fashion in each DSC, and is summarized in Algorithm 1.
C. Outage Metric
The metric utilized to analyze the results of the proposed solution is the percentage of users in outage, which is given
by Du = 100·No/Nu, where No is the number of users in
outage and is given by No=Nu−P
Nd
Algorithm 1 DSCs Power Allocation and Positioning
Require: Initialize DSC locations and Q-tables
Ensure: Power allocation and positioning of DSCs
forEvery episodedo
while Stopping criteria not metdo
DSC selects action according to-greedy policy Update DSC state
Allocate users and receive reward, rt+1
Update Q-tables
end while
Allocate power and move to state with best reward Allocate users
end for
IV. SIMULATIONRESULTS
In this section we compare the proposed solution to the method in [1], in which every DSC employs a fixed transmit power of EIRP= 0dBW. A summary of the simulation param-eters is shown in Table I. Simulation results are generated and averaged out by 15 independent runs, each with 100 episodes. Before the first episode, user positions are generated. Each episode is divided into iterations, in which users are considered static and DSCs try to find the best power allocation and position. After a certain number of iterations, depending on the stopping criteria, DSCs decide their transmit power and best position for that episode. For the next episode users move randomly, with a maximum displacement of 3 m in either X-axis or Y-X-axis, while DSCs start in the same learned position of the previous episode with the knowledge of the computed
Q-tables. This series of actions is repeated for each run. Figure 1 plots the evolution of the percentage of users in outage versus the number of episodes, in a scenario with 9 DSCs, comparing the proposed solution and the method in [1]. As we can observe, the percentage of users in outage decreases rapidly with the number of episodes, reaching near zero for both methods after around 10 episodes. In order to consider only the steady state performance, in the following we present numerical results using the average of a number of episodes beyond such transient behavior. In particular, next we consider the average performance during episodes 11 to 100.
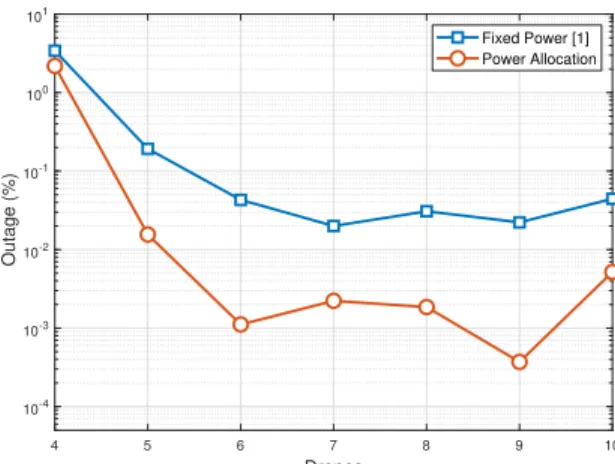
Figure 2 shows the percentage of users in outage per number of DSCs. It can be seen that the performance achieved by the fixed transmit power solution using 9 DSCs, [1], can be achieved with just 5 DSCs when using the proposed solution. In addition, the new method yields the best overall results, having a percentage of users in outage much smaller than the case with fixed transmit power when considering 9 DSCs. Moreover, in the case of 9 DSCs the average transmit power is only EIRP =−10dBW, whereas the average transmit power for the fixed power solution is EIRP = 0 dBW, as shown in Figure 3. Hence, the proposed solution presents a better performance not only in terms of users in outage, but also in average transmit power.
Finally, Figure 4 illustrates the position of 9 DSCs for a particular episode, including their transmit power and RAN load. Different drones prefer different heights, in order to maximize coverage and minimize interference. DSCs with higher altitude use the increased coverage to serve users that
Table I: Simulation parameters.
Parameters Value
Ratio of build-up to total land area (α) 0.3 Average number of buildings (β) 500 buildings/km Scale parameter for building heights (γ) 15 m
ξLOS 1 dB
ξNLOS 20 dB
Side of the square area (L) 500 m
Drone X-axis and Y-axis step 50 m
Drone Z-axis step 100 m
Minimum Drone height 200 m
Maximum Drone height 1,000 m
Users X-axis and Y-axis step 1 m
Number of users (Nu) 200
User height (hu) 1.5 m
DSC antenna directivity angle (θ) 60º Possible DSC EIRP {-20, -10, 0}dBW
RBs in DSC 50
Carrier frequency (fc) 1 GHz
Total number of episodes 100
Number of independent runs 15
Max iterations per episode (Maxit) 3600
Max iterations, same reward (Maxit,r) 70
Min iterations per episode (Minit,r) 200
Learning Rate (λ) 0.9 Discount Factor (φ) 0.9 2 4 6 8 10 12 14 Episode 0 2 4 6 8 10 12 14 16 Outage (%) Fixed Power [1] Power Allocation
Figure 1: Example of algorithm evolution as a function of the episodes, in a scenario with 9 DSCs.
would be in outage. Regarding RAN load, none of the DSCs uses full capacity, resulting in more DSCs using lower transmit power, mitigating interference and improving coverage.
V. CONCLUSION
In this paper, DSCs were used to deploy an ECN in a catastrophe scenario. The proposed solution consisted of a distributed implementation ofQ-learning, to optimize the posi-tion and power allocaposi-tion of each DSC, while maximizing the number of covered users. Results showed that power allocation at the DSCs positively impacts the network performance.
ACKNOWLEDGMENTS
This work was partially supported by CNPq and CAPES – Finance code 001, and from the DARE project grant (No.
4 5 6 7 8 9 10 Drones 10-4 10-3 10-2 10-1 100 101 Outage (%) Fixed Power [1] Power Allocation
Figure 2: Percentage of users in outage as a function of the number of DSCs. 4 5 6 7 8 9 10 Drones -20 -15 -10 -5 0
Average Transmit Power (dbW)
Fixed Power [1] Power Allocation
Figure 3: DSCs average transmit power.
EP/P028764/1) under the EPSRC’s Global Challenges Re-search Fund (GCRF) allocation.
REFERENCES
[1] P. V. Klaine, J. P. Nadas, R. D. Souza, and M. A. Imran, “Distributed drone base station positioning for emergency cellular networks using reinforcement learning,”Cognitive Computation, pp. 1–15, May 2018. [2] M. Erdelj, E. Natalizio, K. R. Chowdhury, and I. F. Akyildiz, “Help from the sky: Leveraging UAVs for disaster management,”IEEE Pervasive Computing, no. 1, pp. 24–32, Jan 2017.
[3] R. Ghanavi, E. Kalantari, M. Sabbaghian, H. Yanikomeroglu, and A. Yongacoglu, “Efficient 3D aerial base station placement considering users mobility by reinforcement learning,” inIEEE Wireless Communi-cations and Networking Conference (WCNC), June 2018, pp. 1–6. [4] J. Brodkin. (2017) An AT&T drone is now providing cellular
service to people in Puerto Rico. Accessed 2019-02-15. [Online]. Available: https://arstechnica.com/information-technology/2017/11/att-drone-brings-lte-access-to-hurricane-damaged-puerto-rico/
[5] I. Bor-Yaliniz and H. Yanikomeroglu, “The new frontier in RAN heterogeneity: Multi-tier drone-cells,”IEEE Communications Magazine, vol. 54, no. 11, pp. 48–55, Nov 2016.
[6] L. Wang, B. Hu, and S. Chen, “Energy efficient placement of a drone base station for minimum required transmit power,” IEEE Wireless Communications Letters, pp. 1–1, Feb 2018.
Pt = 0 dBW Pt = -10 dBW Pt = -20 dBW RAN Load = 29% RAN Load = 35% RAN Load = 89% RAN Load = 34% RAN Load = 64% RAN Load = 50% RAN Load = 28% RAN Load = 21% RAN Load = 47%
Figure 4: Final deployment of 9 DSCs.
[7] M. Alzenad, M. Z. Shakir, H. Yanikomeroglu, and M.-S. Alouini, “FSO-based vertical backhaul/fronthaul framework for 5G+ wireless networks,”IEEE Communications Magazine, vol. 56, no. 1, pp. 218– 224, Jan 2018.
[8] E. Kalantari, M. Z. Shakir, H. Yanikomeroglu, and A. Yongacoglu, “Backhaul-aware robust 3D drone placement in 5G+ wireless net-works,” inIEEE International Conference on Communications Work-shops (ICC WorkWork-shops), May 2017, pp. 109–114.
[9] A. Merwaday and I. Guvenc, “UAV assisted heterogeneous networks for public safety communications,” inIEEE Wireless Communications and Networking Conference Workshops (WCNCW), Mar 2015, pp. 329–334. [10] M. Mozaffari, W. Saad, M. Bennis, and M. Debbah, “Drone small cells in the clouds: Design, deployment and performance analysis,” inIEEE Global Communications Conference (GLOBECOM), Feb 2015, pp. 1–6. [11] N. Zhao, W. Lu, M. Sheng, Y. Chen, J. Tang, F. R. Yu, and K.-K. Wong, “UAV-Assisted emergency networks in disasters,”IEEE Wireless Communications, vol. 26, no. 1, pp. 45–51, Feb 2019.
[12] ITU-R, “1410-2 Propagation Data and Prediction Methods for The Design of Terrestrial Broadband Millimetric Radio Access Systems,” 2003.
[13] A. Al-Hourani, S. Kandeepan, and A. Jamalipour, “Modeling air-to-ground path loss for low altitude platforms in urban environments,” in IEEE Global Communications Conference (GLOBECOM), Dec 2014, pp. 2898–2904.
[14] P. V. Klaine, M. A. Imran, O. Onireti, and R. D. Souza, “A survey of machine learning techniques applied to self-organizing cellular networks,”IEEE Communications Surveys & Tutorials, vol. 19, no. 4, pp. 2392–2431, July 2017.
[15] R. S. Sutton and A. G. Barto,Reinforcement learning: An introduction. MIT press Cambridge, 1998.
![Figure 2 shows the percentage of users in outage per number of DSCs. It can be seen that the performance achieved by the fixed transmit power solution using 9 DSCs, [1], can be achieved with just 5 DSCs when using the proposed solution.](https://thumb-us.123doks.com/thumbv2/123dok_us/746731.2594391/5.918.504.826.230.728/percentage-performance-achieved-transmit-solution-achieved-proposed-solution.webp)