I
R
I
S
A
IN ST ITU TD E R EC HE RC HE EN IN FO RM AT IQU EE T S YST ÈMES ALÉ ATOI RESP U B L I C A T I O N
I N T E R N E
N
o1697
PEER SHARING BEHAVIOUR IN THE EDONKEY
NETWORK, AND IMPLICATIONS FOR THE DESIGN OF
SERVER-LESS FILE SHARING SYSTEMS
S. B. HANDURUKANDE, A.-M. KERMARREC, F. LE
http://www.irisa.fr
Peer Sharing Behaviour in the eDonkey Network, and
Implications for the Design of Server-less File Sharing
Systems
S. B. Handurukande* , A.-M. Kermarrec** , F. Le Fessant*** , L.
Massouli´e**** and S. Patarin*****
Syst`emes num´eriques Projet Paris
Publication interne n˚1697 — F´evrier 2005 — 31 pages
Abstract: Peer-to-peer file sharing systems have grown to the extent that they now generate most of the Internet traffic, way ahead of Web traffic. Understanding workload properties of peer-to-peer systems is necessary to optimize their performance. In this paper we present an empirical study of a workload gathered by crawling the eDonkey network for over 50 days. Besides confirming the presence of some well-known features, such as the prevalence of free-riding and the Zipf-like distribution of file popularity, we also analyze several previously ignored aspects of such workloads such as clustering. More specifically, we analyze the overlap between contents offered by different peers. We find that peer contents tend to be clustered, which may be taken as evidence that peers possess specific interests. We leverage this and allow peers to search for content without any server support, by maintaining a list of semantic neighbours, i.e. peers with similar interests. Simulation results confirm the clustering property of the trace and show that a high hit ratio is achieved by querying the most recently discovered peers even after removing the top 15% most generous peers. Results also indicate that the clustering is much higher for rare files.
Key-words: peer-to-peer overlay networks, file sharing application, clustering patterns, trace analysis, semantic proximity.
(R´esum´e : tsvp) *Distributed Programming Laboratory, EPFL,Switzerland
**INRIA-Rennes/IRISA, France
***INRIA-Futurs and LIX, Palaiseau, France ****Microsoft Research, Cambridge, UK *****University of Bologna, Italy
R´esum´e : Les syst`emes pair `a pair de partage de fichiers sont aujourd’hui `a l’origine de la plupart du trafic Internet. Une bonne appr´ehension des propri´et´es de l’activit´e g´en´er´ee par ces applications est d´esormais cruciale pour optimiser leur performance. Dans ce papier, nous pr´esentons une ´etude empirique d’une telle activit´e reposant sur des donn´ees issues du r´eseau eDonkey sur une p´eriode de 50 jours.
Outre la confirmation de comportements connus tels que l’importance du free-riding ou la distribution Zipf de la popularit´e des fichiers, nous analysons ´egalement des aspects peu ´etudi´es de telles traces. En particulier, nous nous int´eressons `a la proximit´e g´eographique des pairs offrant un fichier donn´e : en effet, la plupart des fichiers partag´es, le sont par des pairs ´emanant d’un mˆeme pays. Nous analysons l’intersection entre les fichiers partag´es par les diff´erents pairs. Cette ´etude met en ´evidence la pr´esence de proximit´e s´emantique entre pairs. Nous exploitons cette caract´eristique afin que les pairs envoient leurs requˆetes de pr´ef´erence vers des pairs qui ont des int´erˆets similaires, ´evitant ainsi la participation de serveurs au processus de recherche. Les r´esultats de simulation montrent qu’un taux important de succ`es est assur´e en effectuant des recherches sur les pairs r´ecemment d´ecouverts partageant des int´erˆets. Les r´esultats montrent ´egalement que cette caract´eristique est d’autant plus marqu´ee que les fichiers recherch´es sont rares.
Mots cl´es : R´eseau pair `a pair, application de partage de fichiers, analyse de trace, proximit´e s´emantique.
1
Introduction
File sharing peer-to-peer systems such as Gnutella [8], Kazaa [14] and eDonkey [5] have significantly gained importance in the last few years to the extent that they now domi-nate Internet traffic [3, 21, 24], way ahead of Web traffic. It has thus become of primary importance to understand workload properties of these systems, in order to optimize their performance. A number of studies of such workload properties have already been conducted [23, 29, 4]. In general previous measurement analyses of peer-to-peer networks have focused onfree-riding[1], peer connectivity and availability [2, 26], and peer distribution and locality within the network [26, 11]. However, to the best of our knowledge, no analysis has focused on either the type of content shared on these networks, the dynamics of shared content, or the relationships between content shared by distinct peers.
It is nevertheless of importance to analyze these workload features. While recent obser-vations of Kazaa [11] indicate that locality-awareness can significantly enhance efficiency of peer-to-peer networks, other (non-geographic) relationships between peers can be leveraged as well [28, 31, 32, 19, 18]. More precisely, the semantic relationships between participants of a peer-to-peer file sharing system have been identified as a relevant metric. A semantic relationship between two peers in a peer-to-peer file sharing system exists if the peers share some interest (i.e. exhibit some interest-based locality). Similar requests or a significant overlap in cache contents reveal a semantic relationship between peers. Exploiting this form of locality may reduce the duration of the search phase in general, and more specifically when searching for rare files [28]. The relevance of this concept and the performance gains obtained from exploiting either type of locality heavily depend on the corresponding degree of clustering. One aim of our study is to measure the extent of such clustering in present peer-to-peer systems and provide directions to leverage it.
This study is based on a trace gathered from eDonkey peer-to-peer network from Decem-ber 9, 2003 to February 2, 2004: to this end, we crawled part of the eDonkey peer-to-peer network and gathered a trace from over 2.5 million connections to peers to browse their cache contents. The total volume of shared data thus discovered (with multiple counting) was over 350 terabytes. As opposed to recent studies on peer-to-peer workloads in which the traces are gathered by observing network traffic from a single location, usually a University or an ISP, our trace is collected by actively probing the cache contents of peers distributed over several countries, mostly in Europe, where eDonkey is the dominant peer-to-peer network.
In this paper, we present the analysis of this trace to gain a better understanding in sharing patterns along three directions. First, we evaluate the trace in terms of sharing and replication properties. More specifically, we analyze the evolution of file popularity and client contents over time. Second, we focus on geographical and semantic clustering properties. To this end, we first study the correlation between clients cache contents as the main metric. We then evaluate the semantic links themselves. Exploiting the presence of clustering may improve the search performance in peer-to-peer file sharing systems for example by creating additional links connecting semantically-related clients. We evaluate the impact of such a mechanism and observed that the search phase can be significantly improved. We also measure clustering by removing potential biases caused by either generous uploaders or
very popular files. Finally, in order to compare our results with a trace without clustering properties, werandomize the initial trace and performed the same set of experiments. Our results, compared to a fully randomized trace, demonstrate the fact that peer-to-peer file sharing workloads are subject to interest-based clustering.
The rest of this paper is structured as follows. In Section 2, we present the eDonkey network and the techniques we used to gather the measurements. Section 3 evaluates the static and dynamic properties of the workload with respect to file popularity and client sharing patterns. We present measures of semantic and geographic clustering in Section 4. Section 5 describes the results of leveraging interest-based proximity by creating semantic links between peers. Section 6 provides additional measurements on the trace. In Section 7, we review related work on peer-to-peer systems measurements before concluding in Section 8.
2
Trace collection
Before describing our experimental settings for data collection, let us recall some necessary background on eDonkey.
2.1
The eDonkey network
The eDonkey network [5] (also well known for one of its open-source clients, Emule) is, in September 2004, the most popular peer-to-peer file sharing networks with 2.4 millions daily users [27]. EDonkey provides advanced features, such as search based on file meta-data, concurrent downloads of a file from different sources, partial sharing of downloads and corruption detection.
The architecture of the network is hybrid: the first tier is composed of servers, often hosted and administrated by experienced users, in charge of indexing files and the second tier consists inclientsdownloading and uploading files. We describe below the interactions between clients and servers, and between clients themselves.
Client-server interactions
The client-server connection serves two main purposes: (i)searching for new files to down-load, and(ii)finding new sources of files while they are being downloaded. At startup, each client initiates a TCP connection to at least one server. The client then publishes the list of files it is willing to share (its cache contents). A list of available servers is maintained by the servers — it is the only data communicated between servers — and propagated to the clients after connection.
Clients send queries to discover new files to download. Queries can be complex: searches by keywords in fields (e.g. MP3 tags), range queries on size, bit rates and availability, and any combination of them with logical operators (and, or, not). Each file has a unique identifier (see below) which is used by clients to query for sources where they can download it. Queries for sources are retried every twenty minutes in an attempt to discover new
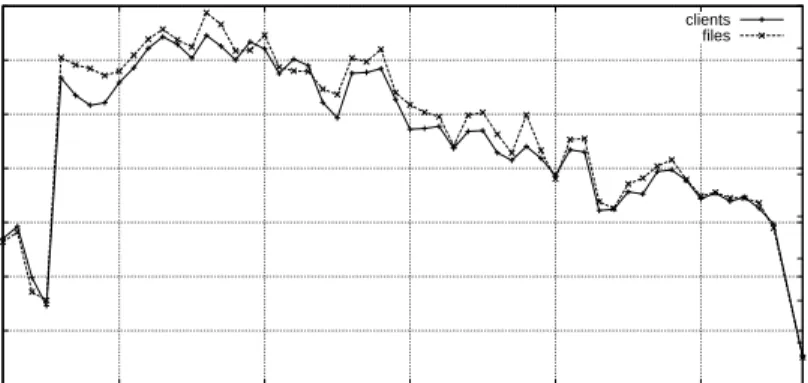
0 10 20 30 40 50 60 70 350 360 370 380 390 0 0.2 0.4 0.6 0.8 1 1.2 1.4 1.6 1.8 Clients (Thousands) Files (Millions) Days clients files
Figure 1: Evolution of the number of clients and shared files per day over the period (extrapolated trace).
sources. Clients also use UDP messages to propagate their queries to other servers since no broadcast functionality is available between servers.
Some old servers support the query-users functionality, i.e. searching users by nickname. As will be seen, we use this feature, which is unfortunately no longer implemented in the new versions of the servers.
Client-client interactions
Once a source has been discovered, the client establishes a TCP connection to it. If the source sits behind a firewall, the client may ask the source server to force the source to initiate the connection to the client. The client asks the source whether the requested file is available using its unique identifier and which blocks of the file are available. Finally, the client asks for a download session, to query in small chunks all the blocks of interest.
Files are divided in 9.5 MB blocks, and a MD4 checksum [22] is computed for each block. Checksums can be propagated between clients on demand. The file identifier itself is generated as a MD4 checksum of all the partial checksums of the file. Files are shared (available for download) as soon as at least one block has been downloaded and verified, which requires that a client sharing a file also owns the checksums since it has been able to verify that block.
Finally, clients can also browse other clients, i.e. ask another client for the list of files it is currently sharing. This feature, which we use in our crawler, is not available on all clients for security reasons, or at least can be disabled by the user.
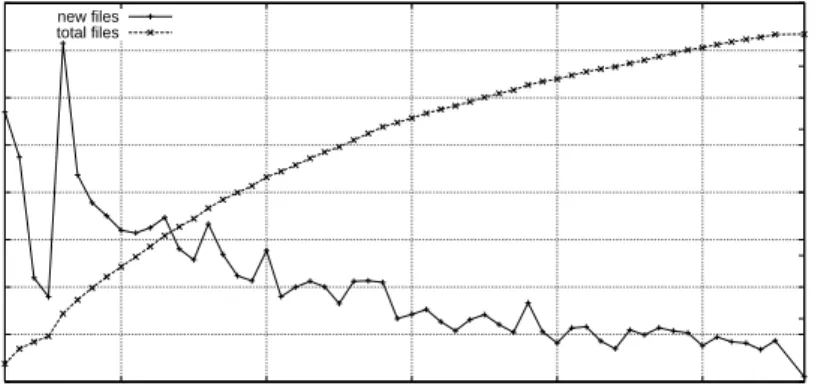
0 0.1 0.2 0.3 0.4 0.5 0.6 0.7 0.8 350 360 370 380 390 0 2 4 6 8 10 12
New files (Millions) Total files (Millions)
Days new files
total files
Figure 2: Evolution of the number of files discovered during the trace (full trace).
2.2
The eDonkey crawler
To gather a trace of eDonkey clients, we modified an open-source eDonkey client,MLdonkey [6].
Our crawler is initialized with a list of current eDonkey servers. It concurrently connects to all servers, retrieving new lists of servers, and starts asking for clients that are connected to these servers. For each query, a server either does not reply (if the query-users feature is not implemented) or returns a list of users, whose nicknames match the query. Current eDonkey servers can handle more than 200,000 connected users (provided they have the necessary bandwidth), but our crawler cannot receive the complete list in one query, since they are limited to at most 200 users per query. Instead, it tries 263 different queries, starting with "aaa"and ending with "zzz". Unfortunately, many clients share a common name (some softwares use their Web site URL as the default user nickname), thus preventing us from retrieving from one server more than the 200 users returned by the corresponding query.
The list of users is then filtered to keep only reachable clients (i.e. not firewalled clients), and stored on disk. Another module of the crawler then connects repeatedly to these clients every day (or more often if the connections fail until a given maximum number of retries). Once a client is connected, its cache content is retrieved, i.e. the list and description of all files it shares, plus any additional information available.
The crawler ran on a 1 Ghz computer with 512 MB RAM connected by a 100 Mb/s link to the Internet.
2.3
General trace characteristics
Now we discuss some preliminary observations from the trace that was collected from De-cember 9, 2003 to February 2, 2004.
Raw trace
Number of days of the trace 56 Number of uniquely identified clients 1158976 Number of free-riders 975116 (84 %) Number of successful snapshots 2520090 Number of distinct files 11014603 Space used by distinct files 318 TB Filtered trace
Number of distinct clients 320190 Number of free-riders 226570 (70 %) Extrapolated trace
Number of days of the trace 42 Number of distinct clients 53476 Number of free-riders after 39445 (74 %)
Table 1: General characteristics of the trace. For unknown reason, the proportion of free-riders is lower in the filtered trace, which has no impact on our analysis since we only focus on common files between peers.
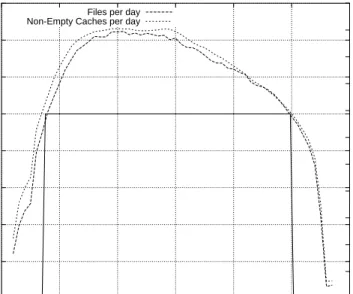
0 200000 400000 600000 800000 1e+06 1.2e+06 1.4e+06 1.6e+06 340 350 360 370 380 390 400 0 1000 2000 3000 4000 5000 6000 7000 8000 9000 10000 11000 Number of Files
Number of Non-Empty Caches
Days Files per day Non-Empty Caches per day
Figure 3: After extrapolation, the analysis is done from day 348 to day 389, where at least 1,000,000 files and 7,000 interesting clients are available.
Figure 1 depicts the number of clients and files successfully scanned daily, over the measurement period. It shows a decrease of the number of clients traced daily (from 65,000
at the beginning to 35,000 at the end). This is an artifact of the measurement (the number of clients on eDonkey has been increasing during the measurement period), and is explained by several reasons. We have been subject to incremental bandwidth restrictions by our network administrators. The increase of the number of known clients no longer connected caused more connection attempts. Finally, the amount of information retrieved from each client significantly increased over the measurement period. Nevertheless, this decrease has no impact on the analysis presented in this paper.
Figure 2 shows the total number of files and the number of new files per day over time. Even after one month, our crawler discovered 100,000 new files per day. By relating the number of new files discovered to the numbers of browsed clients reported in 1, one finds that on average clients share 5 new files per day. The drop at the beginning was caused by a network failure partially interrupting the crawler work for two days.
The general characteristics of the trace are presented in Table 1. During this analysis, we were confronted with a tremendous amount of data to process. Indeed, we identified over one million peers (29% in Germany, 28% in France, 16% in Spain and only 5% in the US) with either a different IP address or a different unique identifier, and 11 millions of distinct files.
Clients can sometimes change either their IP address (DHCP) or unique identifier (by reinstalling the software). To avoid taking such clients several times into account in our analysis, we removed all clients sharing only either the same IP address or the same unique identifier. We call the resulting trace of 330,000 clients the filtered trace, and all static analysis results are computed on this trace. For dynamic analysis, we further filtered this trace to keep only 53,000 clients in theextrapolated trace, that were connected at least 5 times over the period, with at least 10 days between the first and the last connection. Out of those peers, 38,000 were free-riders. We then extrapolated peer caches in the following pessimistic way: for every day where a peer could not be connected to, we put, in its extrapolated cache, the intersection of the files at the previous and at the subsequent connection. This is indeed pessimistic for inferring clustering properties of peer cache contents, as this underestimates the actual content.
Figure 3 presents the total number of files crawled per day, after filtering and extrapo-lation. Based on these results, we decided to perform the dynamic analysis on days 348 to 389 (Dec. 15 - Jan. 25) where at least one million files per day were available, in at least 7,000 non-empty peer caches per day.
3
Peer contribution and file popularity
We report first on the general peer contribution and file replication statistics in both static and dynamic settings. The results presented in this section confirm some well-known features of peer to peer workloads in terms of file popularity and free riding characteristics: free riders still dominate and file popularity tend to increase suddenly and decrease gradually. We also provide a different insight such as the spread of popular files over time.
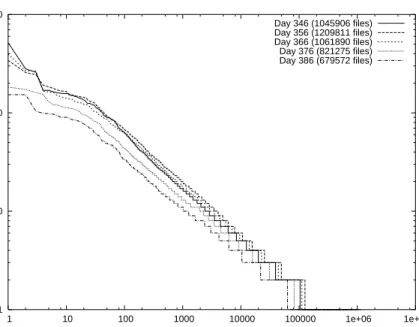
1 10 100 1000
1 10 100 1000 10000 100000 1e+06 1e+07
Number of Sources per File
File Rank Day 346 (1045906 files) Day 356 (1209811 files) Day 366 (1061890 files) Day 376 (821275 files) Day 386 (679572 files)
Figure 4: Distribution of file replication for 5 days of the extrapolated trace.
We measure the popularity of a file by the number of replicas (or sources) per file in the system. Most previous studies measured file popularity as the number of requests. We cannot observe the requests but found that the two measures lead to similar popularity characterization.
Figure 4 depicts the distribution of file replication per file rank for all files crawled in a day, for 5 given days. We can make two observations. First, we observe properties similar to those of the Kazaa workloads [11] and the 3 days-Edonkey workload [7]. This distribution, after an initial small flat region, follows a linear trend on a log-log plot. The second observation is that these patterns seem to be quite consistent over systems, and also over time in the same system.
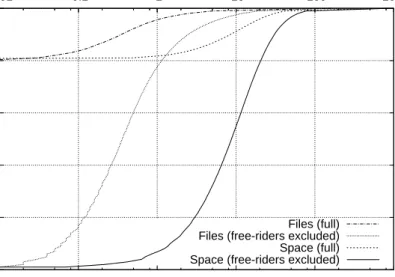
Figure 5 depicts the cumulative distribution of file sizes for distinct levels of popularity. We observe that most files are small files: 40% of the files are less than 1MB, 50% of files are between 1 and 10 MB and probably correspond to MP3 files. Only 10% of the files are larger than 10MB. However, when popularity is taken into account, it appears that 50 % of the downloaded files (i.e. replicated ones) are larger than 600MB (often DIVX movies), and only 20 % between 1MB and 10MB (MP3 files), and 20 % between them (complete MP3 albums, small videos and programs). This clearly shows the specialization of the eDonkey network for downloading large files.
Figure 6 presents the number of files and the amount of data shared per client, with and without free-riders. We observe that free-riding (approximatively 80% of the clients)
0 0.2 0.4 0.6 0.8 1 0.01 0.1 1 10 100 1000 10000 100000 1e+06 1e+07 Proportion of files (CDF) File size (KB) popularity >= 1 >= 5 >= 10
Figure 5: Cumulative distribution of file sizes (filtered trace).
is very common in eDonkey. Most of the remaining clients share a few files, 80% of the non free-riders share less than 100 files, but these are large files, since less than 10% of non free-riders share less than 1GB. This feature is common to most peer-to-peer file sharing systems, but this phenomenon is even more pronounced in the eDonkey network, as illus-trated previously in Figure 5. This is due to the fact that eDonkey is primarily used as a system for downloading large files.
Figure 7 displays the percentage of replication (fraction of clients holding a copy of the file) from the 6 most popular (on average) files over the measurement period and shows the evolution of their popularity. The maximum number of clients holding a copy of a given file is 372 out of the 53476 clients (day 361). We can observe the same for 5 of these 6 files, there is a sudden increase in the number of copies for a popular file for a few days and then gradually the number of copies tends to slowly decrease.
The percentage of spread on the measured period is never more than 0.7%, a somewhat small fraction. This suggests that, in systems such as Gnutella where search is based on flooding, a large number of queries must be generated prior to finding the target file: for randomly selected target peers, an average of 1/.007≈143 peers must be contacted, for the most popular files.
Figures 8 and 9 show the rank of the 5 most popular files of day 348, at the beginning of the trace, and day 367, corresponding to the middle of the trace. Note that these files may be different of the ones evaluated in Figure 7. These figures show that the ranks of popular
0 0.2 0.4 0.6 0.8 1 1 10 100 1000 10000 100000 0.01 0.1 1 10 100 1000 Proportion of clients (CDF) Shared Files Shared Space (GB) Files (full) Files (free-riders excluded) Space (full) Space (free-riders excluded)
Figure 6: Files and disk space shared per client (filtered trace).
files tend to remain stable over time, even though the degree of popularity measured by the number of replicas may decrease. We observe on Figure 9 the beginning of the life of popular files, whereas Figure 8 would be the end of the life of popular files. Effectively, we observe the beginning of the drop in the ranking from day 370.
4
Clustering patterns
In this section, we analyze the clustering characteristics of the workload and observe that peers are geographically and semantically related. More specifically, we evaluate cache content clustering via correlation statistics on the global trace. Our goal is to detect the degree of interest locality between peers. Genuine interest might be masked by the presence of generous peers or popular files that share interest respectively with a large proportion of other peers or files. In order to isolate the amount of clustering stemming from the presence of either generous peers or popular files, we applied a randomization technique, described below, to the original trace. We used this technique later in the paper as well.
4.1
Trace randomization for clustering removal
A technique for separating out the generous peer/popular file effects on the clustering degree from the effect of genuine interest-proximity between peers is to randomize the original trace.
0 0.1 0.2 0.3 0.4 0.5 0.6 0.7 350 355 360 365 370 375 380 385 Spread (%) Days #1 #2 #3 #4 #5 #6
Figure 7: Spread (percentage of the number of files) for the 6 most popular files over time (filtered trace).
The randomization procedure removes any such interest-proximity while maintaining the presence of generous peers and of popular files.
The original trace consists of a list of peers, together with the list of their cache contents. Our goal is to replace it with a trace where each peer maintains a cache with the same number of files, and where a given file is replicated in the same number of caches, thereby preserving the generous peer and the popular file effects: but the randomized trace should distribute files randomly among all peers while satisfying above constraints.
To this end, we use the following randomization algorithm, based on swappings. 1. Pick a peer uwith a probability|Cu|/(Pallpeersw|Cw|), where|Cw|is the size of the
file collectionCw of peerw.
2. Pick a filef, uniformly fromCu (i.e. each with probability 1/|Cu|).
3. Iterate on steps 1) and 2) to obtain another random peerv, and a random filef0 from
Cv.
4. Update the two collections Cu, Cv, by swapping documents f and f0: Cu is now
Cu−f+f0, andCv=Cv−f0+f. This is done only iff0 is not inCuoriginally, and
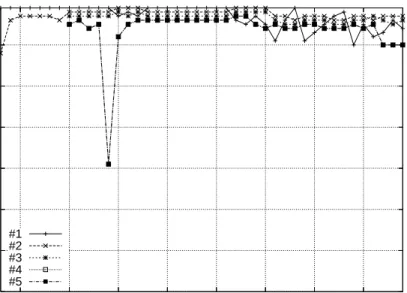
10 20 30 40 50 60 70 350 355 360 365 370 375 380 385 Rank Days #1 #2 #3 #4 #5
Figure 8: Evolution of the file ranks, for the top 5 of day 348 (filtered trace). AS Global National Name
3320 21 % 75 % Deutsche Telekom AG 3215 15 % 51 % France Telecom Transpac 3352 8 % 50 % Telefonica Data Espana 12322 7 % 24 % Proxad ISP France
1668 3 % 60 % AOL-primehost USA
Table 2: The 5 first autonomous systems involved in the Edonkey network, according to the number of hosted clients, among all Edonkey clients (Global) or among clients in the same country (National).
It can be shown that after a sufficient number of iterations, this algorithm effectively returns a randomized trace meeting our requirements. It can also be shown that it is enough to iterate only (1/2)∗N∗ln(N) many times, whereN :=Pu|Cu| is the total number of file replicas in the trace.
4.2
Geographical clustering patterns
Intuitively, semantic and geographical localities are not completely uncorrelated. More precisely, it is reasonable to consider that clients located in a similar area will share some interest as well. For each file, one may define its home country and home autonomous system
10 20 30 40 50 60 70 350 355 360 365 370 375 380 385 Rank Days #1 #2 #3 #4 #5
Figure 9: Evolution of the file ranks, for the top 5 of day 367 (filtered trace).
(AS) as the one to which most of the file sources belong. Figure 10 and Figure 11 show the cumulative distribution function of the fraction of sources that belong to the home country and AS respectively. The different curves on the graphs show how the distribution varies as a function of the average popularity of the files. Theaverage popularity of a given file is defined as the number of distinct sources of this file, divided by the number of days during which the file was seen in the trace. For example on Figure 10, we observe that 50% of files with an average popularity greater or equal to 20 have all their sources in the same country, while this is the case for only 10% of the files with a popularity greater or equal to 50. In both figures, there is a clear distinction between popular and non popular files. The geographical clustering tends to be more pronounced for non popular files.
Table 2 shows that a large proportion of the clients of the trace (54%) are connected to five autonomous systems. This leaves a clear opportunity to leverage this tendency at AS level.
The results displayed above reveal that clients belonging to the same area are more likely to share some interest. There have been recently some propositions to exploit this property at the network level. PeerCache [20] is a cache installed by network operators in order to limit the impact of peer-to-peer traffic on their bandwidth. A cache is shared between clients belonging to the same AS for example and limits the impact of peer-to-peer traffic on the bandwidth. To avoid the issue of network operators storing potential illegal contents, caches may contain index rather than content.
0 0.2 0.4 0.6 0.8 1 0 20 40 60 80 100 Proportion of files (CDF)
Proportion of sources in main country Minimum Popularity 5 10 20 50 100
Figure 10: Distribution of files according to the number of sources in the main country (filtered trace).
4.3
Semantic clustering patterns
4.3.1 Clustering correlation
Figure 12 displays the clustering correlation between every pair of peers. The correlation is measured as the probability that any two clients having at least a given number of files in common share another one. The shape of the curve is similar for all extrapolated days, so we only plot the curve for day 348. We observe that this curve increases pretty quickly with the number of files in common. If some clients have a small number of files in common, the probability that they will share another one is very high. For audio files, we observe in particular that unpopular files are more subject to clustering.
Figure 13 shows the difference between clustering observed on the real trace and on the randomized trace, derived from the real one. In the left graph, we observe that there is almost no difference in clustering between the two traces. This is mainly due to the presence of popular files, which are present on the same clients with a high probability. Therefore, the effect ofgenuine clustering is almost entirely masked by the presence of popular files. In order to suppress this effect, we conducted the same experiments on two low-levels of popularity, 3 and 5 respectively, displayed on the middle and right graphs. We observe a significant difference in the measure of the clustering metric indicating that clustering of interest for these files is indeed present.
0 0.2 0.4 0.6 0.8 1 0 20 40 60 80 100 Proportion of files (CDF)
Proportion of sources in main autonomous system Minimum Popularity 5 10 20 50 100
Figure 11: Distribution of files according to the number of sources in the main au-tonomous system (filtered trace).
4.3.2 Dynamic measurements
Figures 14, 15 and 16 present the evolution of the overlap between pairs of clients sharing between respectively 1 and 10 files, 20 and 57 files and over 157 files. In each graph, we chose to represent a few number of values. These values were chosen arbitrarily out of the large amount of data available to us.
In Figure 14, we observe that the proximity, expressed here as the number of files in common, tends to decrease over the 45 days period represented in a very homogeneous fashion for all curves. For such pairs of clients with initial overlap between 1 and 10, this smooth decay in overlap is explained by the fact that at latter times the overlap consists essentially of those initially common files that are still shared by both clients. In other words, these clients no longer share interests.
In contrast, in Figure 15, we observe longplateaux; see for example the pairs having 51 files in common, this level of clustering remains stable for 20 days. Even if there is a decrease in overlap, we still observe some stable period (see pairs sharing 57 files for example) after 15 days. We thus observe that, when the overlap between caches is higher, it remains at a high level for a longer period of time. This observation is confirmed by the results of Figure 16 for even larger initial overlaps.
0 20 40 60 80 100 1 10 100 1000 10000
Probability for Another Common File (%)
Number of Files in Common
All shared files of day 348 (extrapolated trace) Audio files, popularity in [1..10] (full trace) Audio files, popularity in [30..40] (full trace)
Figure 12: The probability to find additional files on neighbours is similar for everyday (we only plot day 348), and slightly higher for audio files, and in particular for rare files).
These observations suggest that high overlap is sustained over durations as long as 45 days.
As mentioned in Section 2, the trace is highly dynamic (about 5 cache replacements per client per day), and this indicates that the files in the intersection of two peers’ caches change over time. Therefore these results suggest that interest-based proximity between peers is maintained over time.
5
Semantic proximity
In this section, we assess the clustering characteristics of the given trace using the semantic links.
5.1
Getting connected to semantically related peers
Recently a number of approaches have advocated the use of interest-based locality to com-plement (or replace) a peer-to-peer overlay with additional semantic links [28, 31, 12]. The basic idea is to assign to each peer a set of additional neighbours (semantic neighbours) in the overlay. By definition, these are peers who show interest in similar files to the peer under
0 20 40 60 80 100 1 10 100
Probability for Another Common File (%)
For All Files Trace Random 0 20 40 60 80 100 1 10 100 Files with popularity 3 Trace Random 0 20 40 60 80 100 1 10 100 Files with popularity 5 Trace
Random
Figure 13: Comparison of clustering correlation between the trace and a randomized distribution (filtered trace).
consideration, as reflected by their downloads and their cache contents. The motivation for the creation of semantic links is that a peer queries can potentially be served by one such semantic neighbour. Thus by querying semantic neighbours first, peers may frequently avoid the need to connect to servers.
We assess the usefulness of semantic links, which constitutes an operational index of independent interest, and, at the same time, reflects the underlying clustering properties of the workload. We run experiments in the following manner.
First, we observe that the general sharing and distribution properties of a request-based trace [11] or a content-based trace [7] are very similar: the popularity distribution of files is similar whether it is expressed in terms of number of requests or number of replicas. In addition, it has been observed that peer-to-peer file sharing users tend to have afetch once download behavior and do not exhibit any temporal locality properties in their download patterns. Therefore, we assume that the list of contents in a peer cache is representative of the list of its requests and therefore can be used as such. We then measure the hit ratio when using the list of semantic neighbours.
We wrote a simple discrete event simulator where a simulated peer is associated to an eDonkey peer. Each peer is assigned a list of requests according to the list of files its cache contains in the real trace. During the simulations, each peer performs its list of requests for files sequentially. Two situations may occur: (i)either filef has already been requested
0 1 2 3 4 5 6 7 8 9 10 345 350 355 360 365 370 375 380 385 390
Common Files Mean
Days
10 Common Files, 577 Pairs 9 Common Files, 743 Pairs 8 Common Files, 1158 Pairs 7 Common Files, 1645 Pairs 6 Common Files, 2734 Pairs 5 Common Files, 5713 Pairs 4 Common Files, 11525 Pairs 3 Common Files, 24248 Pairs 2 Common Files, 81394 Pairs 1 Common Files, 345898 Pairs
Figure 14: Evolution of pairs of clients over time. Each curve corresponds to a set of pairs of clients, having a given number of common files the first day (extrapolated trace).
in the system and is replicated in other peer caches. In that situation, peer pdownloads
f from one of those peers (potentially using its semantic neighbours list) and updates its semantic neighbours list according to the chosen algorithms. If more than one peer has the file, all those peers are taken into account when updating the list. (ii) peer p is the first peer requestingf and we then consider thatpmaintains the initial replica off.
We used several algorithms in our experiments to manage the semantic neighbour lists. The LRU algorithm corresponds to the most natural strategy, taking into account the most recent downloads. This algorithm has been proved efficient in many contexts in the past [31]. In this algorithm, the most recent uploaders (whether they already belong to the semantic neighbour list or not) are placed at the top of the list of semantic neighbours. Upon a request, the x first semantic neighbours,x being a system parameter, are requested first. Upon failure, the standard search mechanism should be used. We also experimented with thehistory algorithm [31]. This algorithm measures the usefulness of a semantic neighbour as the number of times it has served, or been able to serve requests, over a large period of time.
The hit ratio computed during this experiment indirectly reflects the degree of interest-based clustering. It is also influenced by the presence of generous peers, and of popular files: having semantic links to a generous peer, one is likely to find files in its cache; moreover,
0 10 20 30 40 50 60 345 350 355 360 365 370 375 380 385 390
Common Files Mean
Days
57 Common Files, 3 Pairs 51 Common Files, 6 Pairs 45 Common Files, 6 Pairs 40 Common Files, 4 Pairs 35 Common Files, 17 Pairs 30 Common Files, 18 Pairs 25 Common Files, 22 Pairs 20 Common Files, 56 Pairs
Figure 15: Evolution of pairs of clients over time (extrapolated trace).
if the query is to a popular file, it becomes even more likely that this file will be in the generous peer cache. As a first attempt to estimate the impact of generous peers on the hit ratio, we compute the hit ratio on the trace after having removed the most generous peers, and/or the most popular files.
5.2
Semantic clustering improves search performance
In this second set of experiments, we create semantic neighbour lists according to two al-gorithms, LRU and History. We also use as a benchmark randomly generated neighbour lists. The objective of these experiments is to measure the efficiency of semantic neighbours in answering queries. Figure 17 shows the hit rate, depending on the number of seman-tic neighbours contacted using the LRU and History algorithms for maintaining semanseman-tic neighbour lists. When searching for a given file, if the file can be fetched using only the semantic neighbours it is considered as a hit. As seen in the graph we observe a significant hit ratio: for example just by using 20 semantic neighbours one can achieve hit ratio of 41% and 47% with LRU and History algorithm respectively. One could assume these hits are due to widely replicated popular files, rather than to semantic clustering. However, if this were the case the hit rates for randomly selected queried nodes would be as high, which is obviously not the case.
0 50 100 150 200 250 300 350 345 350 355 360 365 370 375
Common Files Mean
Days
327 Common Files, 6 Pairs 172 Common Files, 3 Pairs 161 Common Files, 1 Pairs 159 Common Files, 3 Pairs
Figure 16: Evolution of pairs of clients over time (extrapolated trace).
5.2.1 Generous uploader syndrome
The significant hit rates achieved by using semantic neighbours suggest that there is a high degree of clustering. But this could also be due to the presence of “generous uploaders” who offer large numbers of files to others. One can argue that each node keeps these generous uploaders in their semantic lists not because there is a semantic relationship between them, but just because the generous uploaders are frequently helpful. To evaluate this impact, we computed the hit rate without considering the X% (X=5,10,15) of the most generous uploaders(the percentage is calculated only taking non-freerider peers). Figure 18 shows the results of this simulation using the LRU algorithm. For the purpose of comparison the hit rate with all uploaders is also included. As seen on the graph the hit rate gets reduced by a considerable amount, especially when the size of the semantic neighbour list is high (e.g., 200). On the other hand even with 15% of the most generous uploaders removed one can achieve a significant hit ratio (e.g., above 30% with 20 semantic neighbours). It is a well known fact that in peer-to-peer networks a large portion of files are offered by few peers. For example, in the trace that we used in our simulation top 15% of nodes offered 75% of the files.
We observed that even though the hit ratio is influenced by generous uploaders, a sig-nificant degree of semantic clustering exists between peers.
0% 10% 20% 30% 40% 50% 60% 70% 80% 90% 100% 0 20 40 60 80 100 120 140 160 180 200
N um ber of Sem antic N eighbors
Hi
ts
(%)
LR U H istory R andom
Figure 17: Impact of the semantic links managed using LRU, History and random algorithms.
5.2.2 Semantic clustering is higher for rare files
As mentioned above, the presence of generous uploaders tends to contaminate the list of semantic neighbours and has a small negative impact on the hit ratio. Likewise file popularity may influence the results of semantic searches. Figure 19 shows the results of the simulations where we removed from 5 to 30% of the most popular files. It should be noted that the number of simulated requests decreases significantly as we remove the requests to most popular files: for 5%, 15% and 30% of the most popular files removed, the number of remaining requests is 67%, 48% and 33% respectively. We observe first that the hit ratio is significantly increased as we removed most popular files. Secondly the fewer semantic neighbours are contacted the more emphasized the impact is. For example, for the 5 semantic neighbour lists, the hit ratio using the LRU on all files is a bit less than 30% and is increased to almost 50% when 30% of the most popular files are not taken into account.
From these observations, we conclude that the clustering degree between peers is even more significant for rare files: this confirms the results obtained in Section 4. This result is very interesting as rare files are usually the most difficult ones to locate in a peer to peer file sharing system [17]. Therefore, implementing semantic links is more relevant for these files and may yield to significant gains in search performance. In this context a challenging
0% 10% 20% 30% 40% 50% 60% 70% 80% 90% 100% 0 20 40 60 80 100 120 140 160 180 200
N um ber of Sem antic N eighbours
Hi
ts
(
%)
W ith All U ploaders W ithout Top 5% W ithout Top 10% W ithout Top 15%
Figure 18: Impact of the semantic links managed using a LRU algorithm without the 5-15% most generous uploaders.
issue is to identify such rare files so that the semantic neighbour lists are not contaminated by links to peers serving requests to popular files. The popularity algorithm, proposed in [31] to manage semantic lists, enables to infer file popularity in flooding-based systems and could be used to evaluate file popularity.
Table 3 summarizes the influence of the generous uploaders and the popular files: it compares the hit ratio without the 5% & 15% of generous uploaders and 5% & 15% of popular files against the hit ratio with all the files (the 2nd row). For example, 3rd and 4th row show hit ratio without generous uploaders and popular files with semantic neighbours of 5, 10, 20 (LRU). The 5th row, for example, shows the removal both 5% of generous uploaders and 5% of popular files.
These results show that popular files and generous uploaders have a contradictory influ-ence on the hit ratio.
Number of Semantic Neighbours 5 10 20 LRU (%) 28 34 41 LRU without top 5% uploaders1 (%) 21 26 33 LRU without 5% popular files2(%) 36 42 47 LRU without both 1 and 2 (%) 25 30 34 LRU without top 15% uploaders3(%) 19 24 31 LRU without 15% popular files4(%) 43 47 52 LRU without both 3 and 4 (%) 28 30 31
Table 3: Combined influence of generous uploaders and popular files.
0% 10% 20% 30% 40% 50% 60% 70% 80% 90% 100% 5 10 20 100 200
N um ber of Sem antic N eighbours
Hi
ts
(%)
W ith all files
W ithout 5% of popular files W ithout 15% of popular files W ithout 30% of popular files
Figure 19: Impact of the semantic links managed using a LRU algorithm without the 5-15% most popular files.
5.2.3 Hit rates with randomized trace
We would like to understand which part of the high hit rate previously observed is at-tributable to generous peers and popular files, and which part is atat-tributable to semantic clustering.
To this end, we re-ran the simulation on a “randomized” version of the original trace, obtained from the algorithm described in Section 4.1. This random file swapping algorithm
0% 10% 20% 30% 40% 50% 60% 70% 80% 90% 100% 0 500000 1000000 1500000 2000000 2500000 3000000 3500000 4000000 N um ber of file sw apping
Hi
t
(%)
R andom ized trace
Figure 20: Impact of the LRU-based semantic search on the randomized trace.
should destroy semantic clustering, while generous uploaders and popular files retain their status in the randomized trace. Figure 20 illustrates how the hit rate obtained from querying 10 semantic neighbours chosen according to LRU decreases as the number of swappings increases, i.e. as we further randomize the trace. Note that the hit rate of the original trace (non randomized) is shown when the number of swapping is zero (x=0), and equals 35%. The hit rate decreases down to 5%, which is the part of the hit rate that can be explained by generous uploaders and popular files. The difference of 30% between the two values can be accounted for only by genuine semantic proximity between peers.
5.2.4 Transitivity of the semantic relationship
Finally, we tested the transitivity property of the semantic relationship between peers. In other words, we investigated whether the semantic neighbours of my semantic neighbours are my semantic neighbours and therefore can help when searching for files. That is, a peer first asks its semantic neighbours and failing to find the file, the peer asks its second level semantic neighbours. This is analogous to forming a semantic overlay on top of the peer-to-peer overlay and searching files from the semantic neighbours that are two hops away. In Figure 21 the x-axis shows the hit ratio that can be achieved by using this approach and
0% 10% 20% 30% 40% 50% 60% 70% 80% 90% 100% 0 20 40 60 80 100 120 140 160 180 200
N um ber of Sem antic N eighbours
Hi
ts
(
%
)
W ith 2nd hop neighbours W ith 1 hop neighbours
W ith 2nd hop neighbours; w ithout top 5% uploaders
W ith 2nd hop neighbours; w ithout top 15% uploaders
Figure 21: Impact of a 2-hop semantic search using a LRU algorithm with and without most generous uploaders.
y-axis shows the number of semantic neighbours maintained by each peer. It appears clearly that the semantic neighbours that are two hops away can help to find files.
We conducted the same experiments while removing from 5 to 30% of the most repli-cated files and observe similar trends as for 1 hop semantic search. The hit ratio for the 2 hop semantic search is increased from 32% when semantic lists are composed of 5 semantic neighbours and all files are taken into account to 40%, 45% and over 50% when respec-tively 5%, 15% and 30% of the most popular files are ignored. As the number of semantic neighbours increases, the discrepency decreases.
These results confirm that rare files are more subject to clustering and that the impact of 2 hop semantic neighbours is positive.
6
Other measurements
In this paragraph, we briefly provide additional measurements neither related to sharing patterns nor clustering properties. These measurements will be the purpose of further study and due to space constraints, we provide a very brief explanation.
1 10 100 1000 10000 100000 1e+06 1e+07 1 10 100 1000 10000 100000 1e+06 1e+07 Number of occurences Keyword rank
Figure 22: Number of occurrences of each word in file names (full trace).
Word occurrence The first result, illustrated by Figure 22, represents the power-law popularity of keywords in file names. In our set of 11 millions files, popular keywords are often short (mp3appears 5.7 millions times andjpg1.8 millions times), but longer words are also frequent (trackappears 123,000 times, anddvdrip92,000 times). This result shows that any attempt to use a distributed hash table for searches in such a network should contain a mechanism to prevent such a keyword from being mapped on only one client and confirms the issue of keyword-based search in a DHT-based system [17].
Corruption The second result, illustrated by Figure 23, is the level of corruption that appears in the eDonkey network. Here, we consider that a file is corrupted when at least half of its blocks are equal to the blocks of another file and a proportion of the other half is different. The eDonkey protocol contains a mechanism to detect corrupted blocks, but cannot prevent corruption caused either by the user or by buggy software. Indeed, one of probable reasons for the existence of these files are downloads voluntarily interrupted by the user, and shared afterwards under a different unique identifier: 5 % of multi-blocks files contain at least one empty block, i.e. a block only filled with zeroes. The figure shows that 10% of the multi-blocks files (those greater than 9.5 MB) are corrupted, and that this level can reach 20 % for files with 75-76 blocks (which are typically 700 MB divx movies). However, the number of corrupted files drops to 5 % when compared to the total number of files (with replicas): users filter out corrupted files when they preview them. Consequently,
0 5 10 15 20 25 30 0 20 40 60 80 100 Corruption (%) Number of Chunks Files Copies
Figure 23: Proportion of corrupted files per size (full trace).
a high number of replicas reflects the correctness of a file: this can be checked out before starting download.
7
Related work
A number of studies have recently been conducted to analyze the behaviour of peers and the characteristics of existing file sharing system networks. Saroiu et al. [25] studied the peer characteristics of both the Napster and Gnutella networks. They concluded that there are significant disparities between peers in terms of capacities and behaviour. More recently, Gummadi et al. [11] conducted a 200 day analysis of the Kazaa network at the University of Washington. This analysis extracted a number of general patterns of sharing properties, and was used as a basis to model peer-to-peer systems. The Kazaa and Gnutella networks were also evaluated in the context of content delivery networks [24], in which authors analyzed the caching potential of such networks. Another evaluation of Fasttrack protocol (Kazaa) [15] analyzes several peer-to-peer traffic measurements and focuses on the potential of caching mechanisms in to-peer systems. The results of a seven day crawl of the Overnet peer-to-peer file sharing system [2], focusing on peer availability, demonstrate that there is a significant turnover and a non negligible impact of IP aliasing that should be taken into account in the design of peer-to-peer systems. A theoretical analysis of a peer-to-peer
network [16] was also proposed along the recurrent concern of frequent node arrivals and departures.
Peer availability, sharing patterns and Internet bandwidth usage have been major con-cerns in previous works; the main objectives were to study the impact of peer frequent arrivals and departures in the design of peer-to-peer systems as well as the potential of caching on peer-to-peer workloads. By way of complementing knowledge so far, we focused on the emergent clustering properties of such workloads in order to exploit them in various other applications.
Recently eDonkey has been identified as the main competitor of Kazaa, and ahead of Kazaa in Europe. As a consequence, eDonkey has generated a lot of interest and some im-portant results have been obtained. An analysis [30] of the eDonkey traffic observed outside the University of Wurzburg during 12 days focuses on the network-level properties of the traffic, i.e. the amount of administrated bandwidth used compared to downloads, and the “mice and elephants” effect on the network. Besides, analyses of two logs of an eDonkey server have been proposed [10, 9]. Those papers mainly focus on short-term dynamic be-haviour of clients (request frequency, etc.) and on the graph of clients related through the server. From the clustering point of view, interesting results report that around 20% of the edges of the exchange graph are bidirectional, and that cliques — subsets of clients all connected to each other — of size 100 and higher exist among the server clients. Another recent work [7] analyzes a three day crawl of eDonkey clients, and demonstrates the presence of semantic clustering.
The smart downloading algorithm of the Bittorrent network has also seduced a large number of clients recently. An analysis of a 5-months logs of the Bittorrent tracker [3] used during the diffusion of Linux Redhat 9 has been provided [13]. The Bittorrent protocol can be seen as a subset of eDonkey, where all clients interested in a file are connected to the same server: the tracker. Thus, clustering is forced by the protocol itself, as a client only knows of clients which are interested in the same file they are downloading. Consequently, the analysis mainly focuses on the download properties (number of uploaders and downloaders, download and upload rates, session times) and is rather orthogonal to our work.
The use of semantic neighbours has been first evaluated on a real trace by Sripanidkulchai et al. [28]. Although better results were obtained on a Web trace, they also evaluated their scheme on a peer-to-peer workload. Their experimental results suggest that simple, light-weight techniques exploiting semantic structure in an implicit manner may yield to significant gains in search performance. Although this was not the purpose of the paper, these results also attest of semantic clustering in peer-to-peer file sharing systems. Similar results have been obtained on a synthetic trace [31].
8
Conclusion
Peer-to-peer file sharing, now the dominant factor on the Internet, is yet to be fully un-derstood, given the scale on which those systems operate. In this paper, we analyzed a two-month trace of the eDonkey network, collected from 2.5 millions connections to clients
scattered around the world. In addition to the extraction of general sharing patterns, which corroborate the results obtained in other measurement studies on various networks and d-ifferent settings (see Section 7), we focused on the dynamic properties of the trace. We analyzed the cache contents over time to extract the evolution of the popularity patterns. We observed that the sharing distribution is still skewed: a few clients share most of the files, both in terms of size and number of files. The popularity of very popular items tends to remain stable over the trace. One of the interesting observations we made is that the workload is highly dynamic: clients tend to share the same number of files but the turnover is pretty high.
We demonstrated the presence of clustering between clients in peer-to-peer file sharing workloads, both geographical and semantic. We based our analysis on correlation between clients, where we measured the overlap between cache contents. This analysis demonstrat-ed that semantic clustering is even stronger for rare files. We also evaluatdemonstrat-ed some simple strategies that can easily capture and exploit the semantic relationships observed between peers and then measure their impact on the search mechanism. The improved efficiency re-veals the presence of semantic proximity between peers in a peer-to-peer file sharing system. We also conducted various experiments, on a randomized trace, without the most gener-ous uploaders and without the most popular files to evaluate the impact on our clustering metric. We concluded that the clustering is definitely present, whether it is geographical or semantic, and is worth exploiting in a number of applications.
We have now started an implementation of semantic links in an eDonkey client, MLdon-key, and we hope to be able soon to report interesting results on their efficiency.
References
[1] E. Adar and B.A. Huberman. Free riding on gnutella. First Monday 5, October 2000. [2] R. Bhagwan, S. Savage, and G. Voelker. Understanding availability. InIPTPS’03. [3] Bittorrent. http://bitconjurer.org/BitTorrent/.
[4] Y. Chawathe, S. Ratnasamy, L. Breslau, N. Lanham, and S. Shenker. Making gnutella-like p2p systems scalable. InSIGCOMM’03.
[5] Edonkey. http://www.edonkey2000.com/index.html.
[6] F. Le Fessant. Mldonkey, a multi-network file-sharing client. http://www.mldonkey.net/, 2002. [7] F. Le Fessant, S. Handurukande, A.-M. Kermarrec, and L. Massouli´e. Clustering in peer-to-peer file
sharing workloads. InIPTPS’04. [8] Gnutella. http://www.gnutella.com.
[9] J.-L.. Guillaume and S. Le-Blond. P2p exchange network: measurement and analysis. InSubmitted to IMC’04.
[10] J.-L. Guillaume and S. Le-Blond. Statistical properties of exchanges in p2p systems. InPDPTA’04. [11] K.P. Gummadi, R.J. Dunn, S. Saroiu, S.D. Gribble, H.M. Levy, and J. Zahorjan. Measurement,
modeling and analysis of a peer-to-peer file-sharing workload. InSOSP’03.
[12] S. Handurukande, A.-M. Kermarrec, F. Le Fessant, and L. Massouli´e. Exploiting semantic clustering in the edonkey p2p network. InSIGOPS’2004.
[13] M. Izal, G. Urvoy-Keller, E.W. Biersack, P. Felber, A. Al Hamra, and L. Garc´es-Erice. Dissecting bittorrent: Five months in a torrent’s lifetime. InPAM’04, 4 2004.
[14] Kazaa. http://www.kazaa.com/.
[15] N. Leibowitza, A. Bergman, R. Ben-Shaul, and A. Shavit. Are file swapping networks cacheable? characterizing p2p traffic. InWCW’02, 2002.
[16] D. Liben-Nowell, H. balakrishnan, and D. Karger. Analysis of the evolution of peer-to-peer networks. InPODC’02.
[17] B. T. Loo, R. Huebsch, I. Stoica, and J. Hellerstein. The case for a hybrid p2p search infrastructure. InIPTPS’04.
[18] S. Marti, P. Ganesan, and H. Garcia-Molina. Dht routing using social links. InIPTPS’04.
[19] M. Naor and U. Wieder. Know my neighbor’s neighbor: better routing for skip-graphs and small worlds. InIPTPS’04.
[20] Peercache. http://www.joltid.com/index.php/peercache/.
[21] D. Plonka. Napster traffic measurement. Technical report, University of Wisconsin-Madison, 2000. [22] R. Rivest. RFC 1320: The MD4 message-digest algorithm, April 1992. Status: INFORMATIONAL. [23] A. Rowstron and P. Druschel. Pastry: Scalable, distributed object location and routing for large-scale
peer-to-peer systems. InMiddleware, 2001.
[24] S. Saroiu, K. P. Gummadi, R. Dunn, S. D. Gribble, and H. M. Levy. An analysis of Internet content delivery systems. InOSDI’02.
[25] S. Saroiu and S.D. Gribble P. Krishna Gummadi. A measurement study of peer-to-peer file sharing systems. InMMCN’02.
[26] S. Sen and J. Wong. Analyzing peer-to-peer traffic across large networks. InSIGCOMM’02 Workshop on Internet Measurment.
[27] Slyck. http://www.slyck.com/.
[28] K. Sripanidkulchai, B. Maggs, and H. Zhang. Efficient content location using interest-based locality in peer-to-peer systems. InINFOCOM’03.
[29] I. Stoica, R. Morris, D. Karger, F. Kaashoek, and H. Balakrishnan. Chord: A scalable peer-to-peer lookup service for internet applications. InSIGCOMM’01.
[30] K. Tutschku. A measurement-based traffic profile of the edonkey filesharing service. InPAM’04. [31] S. Voulgaris, A.-M. Kermarrec, L. Massouli´e, and M. van Steen. Exploiting semantic proximity in
peer-to-peer content searching. InFTDCS’04.
[32] H.J. Wang, Y.-C. Hu, C. Yuan, Z. Zhang, and Y.-M. Wang. Friends troubleshooting networks: towards privacy-preserving, automatic, troubleshooting. InIPTPS’04.